Significance
Nervous system injury can cause lifelong disability, because repair rarely leads to reconnection with the target tissue. In the nematode Caenorhabditis elegans and in several other species, regeneration can proceed through a mechanism of axonal fusion, whereby regrowing axons reconnect and fuse with their own separated fragments, rapidly and efficiently restoring the original axonal tract. We have found that the process of axonal fusion restores full function to damaged neurons. In addition, we show that injury-induced changes to the axonal membrane that result in exposure of lipid “save-me” signals mediate the level of axonal fusion. Thus, our results establish axonal fusion as a complete regenerative mechanism that can be modulated by changing the level of save-me signals exposed after injury.
Keywords: axonal fusion, axonal regeneration, phosphatidylserine, nervous system repair, Caenorhabditis elegans
Abstract
Functional regeneration after axonal injury requires transected axons to regrow and reestablish connection with their original target tissue. The spontaneous regenerative mechanism known as axonal fusion provides a highly efficient means of achieving targeted reconnection, as a regrowing axon is able to recognize and fuse with its own detached axon segment, thereby rapidly reestablishing the original axonal tract. Here, we use behavioral assays and fluorescent reporters to show that axonal fusion enables full recovery of function after axotomy of Caenorhabditis elegans mechanosensory neurons. Furthermore, we reveal that the phospholipid phosphatidylserine, which becomes exposed on the damaged axon to function as a “save-me” signal, defines the level of axonal fusion. We also show that successful axonal fusion correlates with the regrowth potential and branching of the proximal fragment and with the retraction length and degeneration of the separated segment. Finally, we identify discrete axonal domains that vary in their propensity to regrow through fusion and show that the level of axonal fusion can be genetically modulated. Taken together, our results reveal that axonal fusion restores full function to injured neurons, is dependent on exposure of phospholipid signals, and is achieved through the balance between regenerative potential and level of degeneration.
Spontaneous, complete functional repair of damaged or injured nerves is a rare naturally occurring event, particularly in the central nervous system. Significant advancements in our understanding of neuronal regeneration have been made possible through the development and optimization of UV laser axotomy (1, 2). Using the nematode Caenorhabditis elegans, it is now possible to sever GFP-labeled axons with a high degree of efficiency and with minimal damage to the surrounding tissues. This technology has aided the discovery of many conserved cellular and molecular pathways that govern a neuron’s ability to regenerate, including the finding that increased levels of intracellular calcium and cAMP facilitate the branching of a regrowing axon toward its postsynaptic target via p38 and JNK MAPK cascades (3–6). Additional studies have revealed other important intrinsic mechanisms that govern neuronal regeneration in C. elegans, such as the role of microtubule stabilizers (7, 8), serotonin expression (9), and the insulin and Notch signaling pathways (10, 11). However, very little is known on how targeted reinnervation occurs, and there is even less understanding of how damaged neurons accomplish functional recovery postinjury. Yanik et al. (2) previously demonstrated that spontaneous functional recovery is possible after transection of the C. elegans GABAergic motor neurons, but the precise mechanistic and molecular details of how this occurs have not been determined.
C. elegans is one of several invertebrate species that have been shown to possess the ability to spontaneously regenerate injured axons via a mechanism of axonal fusion (5, 12–17). This highly efficient type of repair is characterized by the ability of the proximal segment of a transected axon to regrow and reconnect with its original target tissue. Regeneration through this mechanism can restore the continuity of both the cell membrane and cytoplasm (17). We have recently shown that the process of axonal fusion is mechanistically similar to the way in which apoptotic cells are recognized for engulfment; phosphatidylserine (PS) is flipped to the outer membrane for recognition by both secreted and transmembrane proteins that mediate interactions between opposing membranes (18). After reconnection has been established, the two axonal membranes are fused together through the actions of the fusogen Epithelial Fusion Failure 1 (EFF-1) (5, 18). We have also previously shown that approximately one-third of posterior lateral microtubule (PLM) axons severed in the final larval stage [larval stage 4 (L4)] of development regenerate through axonal fusion, whereas the remainder are able to regrow but do not fuse (17–19). However, the regrowth capacity of these neurons after early developmental stages is simply not sufficient to extend the axon for its entire normal length beyond the site of damage, making functional repair difficult to achieve. Axonal fusion overcomes this limitation and is, therefore, a more efficient mechanism of repair.
Genetic tractability combined with its short lifespan make C. elegans an optimal model in which to study the effects of aging on regeneration. Previous research has established a decrease in overall regrowth as the animal ages, as well as a decrease in the deterministic guidance of novel regrowth (1, 4, 6, 10, 20, 21). In this study, we show that regenerative axonal fusion restores full function to the C. elegans PLM neurons after laser-induced axotomy, reestablishing active transport within the axon. We show that the amount of PS “save-me” signals exposed on the axonal membrane strongly correlates with the level of axonal fusion and increases with age. Thus, despite the decrease in regrowth that occurs in aged animals, a higher percentage of reconnection events is made possible because of enhanced levels of externalized PS, increasing the potential for complete repair of the transected PLM axon by fusion. Furthermore, we reveal that the length of retraction between the two axon segments after injury and the amount of regenerative branching also contribute to the percentage of axons regrowing through fusion. We also show that genetically enhancing the regrowth capacity of PLM increases the frequency of axonal fusion. Taken together, these findings define axonal fusion as a fully functional mechanism of repair.
Results
Axonal Fusion Fully Restores Function to Transected Neurons.
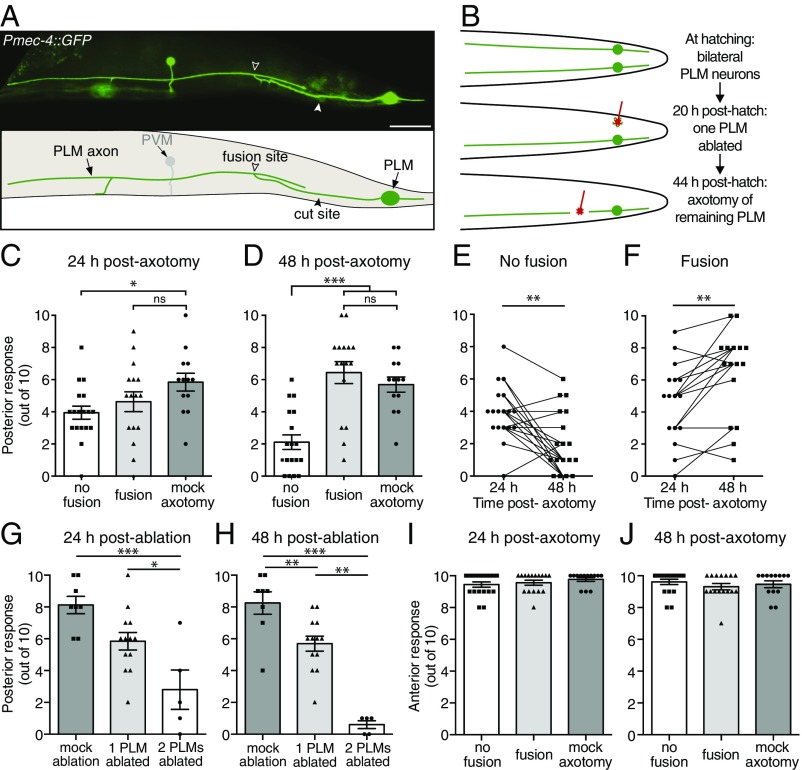
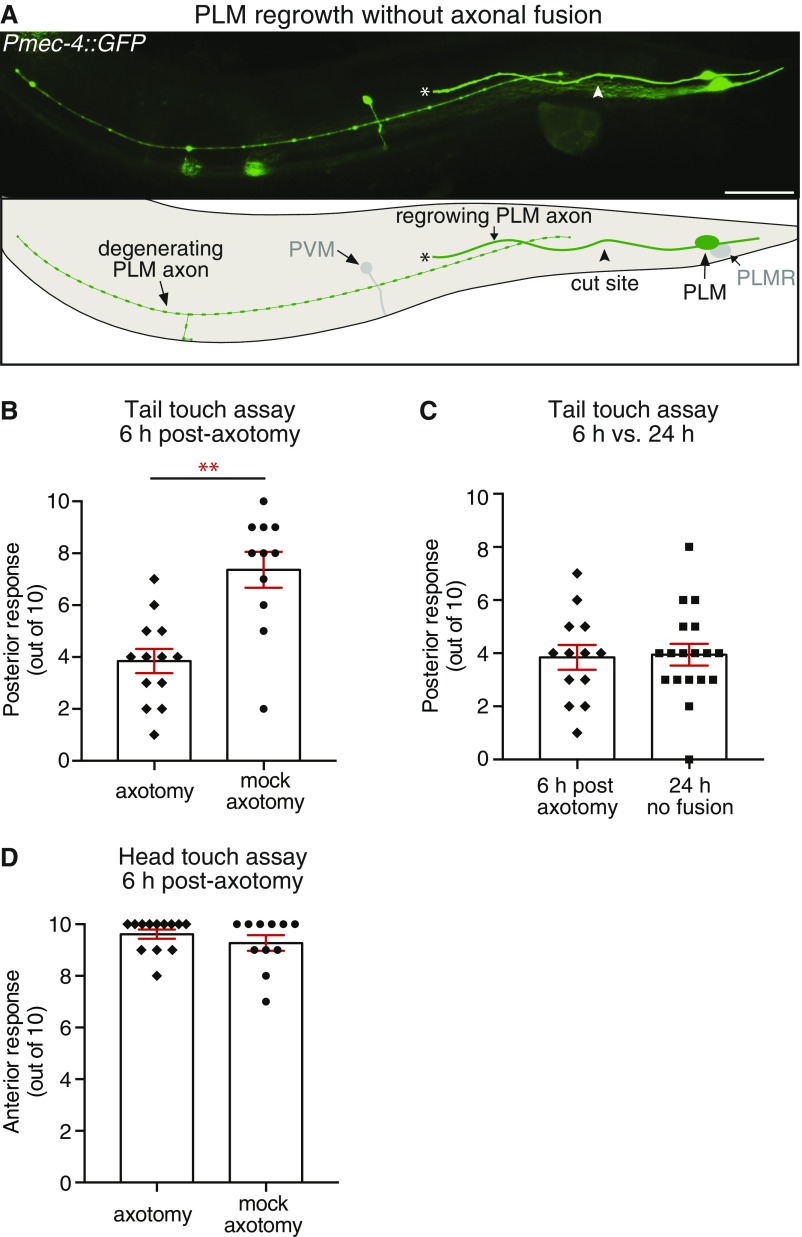
To determine whether regenerative axonal fusion (Fig. 1A and Fig. S1A) conveys functional recovery, we focused on the bilateral pair of PLM neurons that mediate forward acceleration upon gentle mechanical stimulation applied to the posterior half of the animal’s body. We assayed PLM function using the light touch assay (22). To facilitate our analyses and to make them more precise, we focused on a single PLM neuron by killing one of two neurons and then performing axotomy on the remaining one. One of the PLM neurons was ablated 20 h posthatching, and the axon of the contralateral PLM neuron was transected 24 h later at the L4 stage (Fig. 1B). A light touch assay was performed on these animals at both 24 and 48 h postaxotomy followed by epifluorescence microscopy analysis to determine if the axon had regrown through axonal fusion. As shown in Fig. 1C, we found no functional recovery at 24 h postaxotomy, whereas at 48 h striking recovery was apparent in animals in which axonal fusion occurred (Fig. 1 D and F). Significant deterioration of function occurred in the absence of axonal fusion (Fig. 1 D and E). The functional recovery observed after axonal fusion was indistinguishable from the function of PLM neurons in control animals in which a mock axotomy was performed (Fig. 1 D, G, and H), showing that axonal fusion restores full neuronal function. Touch assays performed in animals with one PLM ablated and the axon of the second PLM severed 6 h before analysis revealed that neuronal function rapidly declines after axotomy (Fig. S1B). Interestingly, the reduction in function at this time point was almost identical to that found at 24 h postaxotomy in animals without fusion (Fig. S1C). This indicates that PLM function does not significantly worsen between the 6- and 24-h time points, which is likely a reflection of the slow rate of degeneration that occurs in the separated distal segment (23). We observed no change in the function of the anterior mechanosensory circuit [mediated by the anterior lateral microtubule (ALM) and anterior ventral microtubule (AVM) neurons] after axotomy or ablation of PLM (Fig. 1 I and J and Fig. S1D), highlighting the specificity of these procedures.
Fig. 1.
Axonal fusion restores complete function to transected PLM neurons. (A) Image and schematic of regenerative axonal fusion 24 h postaxotomy in a PLM neuron. The closed arrowhead designates the cut site, and the open arrowhead designates the fusion site. Anterior is left and ventral is down for this and all following images. The posterior ventral microtubule (PVM) neuron is also visible in this image. (Scale bar: 25 μm.) (B) Schematic representation of a dorsal view to show how PLM function was assessed postaxotomy. A UV laser was used to ablate one PLM neuron 20 h posthatching and to transect the axon of the contralateral PLM neuron 24 h later. (C and D) A light touch assay was performed on these animals 24 (C) and 48 h (D) postaxotomy to assess the function of the remaining PLM neuron. Animals with only one PLM ablated and no axotomy performed on the second PLM neuron were used as controls (mock axotomy). Bars represent mean ± SE. Symbols represent individual animals; n ≥ 13. P values are from Tukey’s multiple comparisons test. ns, not significant. *P < 0.05. ***P < 0.001. Comparison of light touch response at 24 and 48 h postaxotomy (E) in animals in which axonal fusion was not observed, and (F) in animals in which fusion was observed. Data shown in E and F are replotted from C and D. Symbols represent individual animals, and lines connect the responses of the same animals. P values are from paired t tests. **P < 0.01. (G and H) Forward response induced by posterior mechanical touch stimulation at 24 (G) and 48 h (H) postablation in control animals in which no PLM neurons were ablated (mock ablation), one PLM was ablated, or both PLM neurons were ablated. Bars represent mean ± SE; symbols represent individual animals. P values are from Tukey’s multiple comparisons test. *P < 0.05; **P < 0.01; ***P < 0.001. (I and J) Backward response to anterior light touch (mediated by the ALM and AVM neurons) at 24 (I) and 48 h (J) postaxotomy for animals in which one PLM neuron was ablated and the axon of the second PLM was either transected or left intact (mock axotomy); disruption of the posterior mechanosensory neurons did not affect the function of the anterior mechanosensory neurons.
Fig. S1.
Regeneration without fusion and behavioral response 6 h postaxotomy. (A) Image and schematic of a PLM neuron 24 h postaxotomy displaying regenerative growth without axonal fusion. Arrowheads designate cut site; asterisks highlight the end of the regrowing axon. The posterior lateral microtubule right (PLMR) and posterior ventral microtubule (PVM) neurons are also visible in this image. (Scale bar: 25 μm.) (B and C) Forward response after mechanical stimulation (light touch) on the posterior section of the body. (B) Six hours postaxotomy of animals in which one PLM neuron was ablated and the axon of the second PLM was either transected or left intact (mock axotomy). PLM function is significantly reduced 6 h postaxotomy; (C) behavioral response in animals 6 h postaxotomy compared with those at 24 h postaxotomy without fusion. Data in C are replotted from B and Fig. 1C. (D) Backward response after mechanical stimulation (light touch) on the anterior section of the body; axotomy of PLM did not affect the function of the anterior mechanosensory neurons. Bars represent mean ± SE; symbols represent individual animals. P values are from paired t test. **P < 0.01.
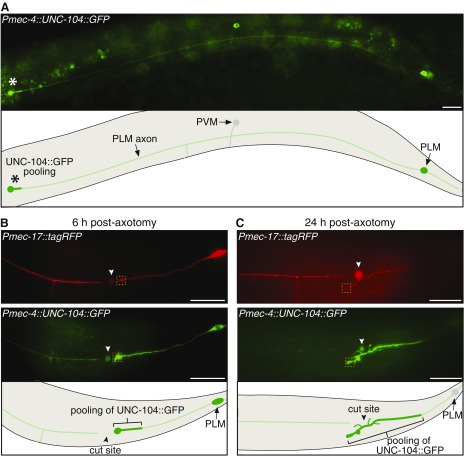
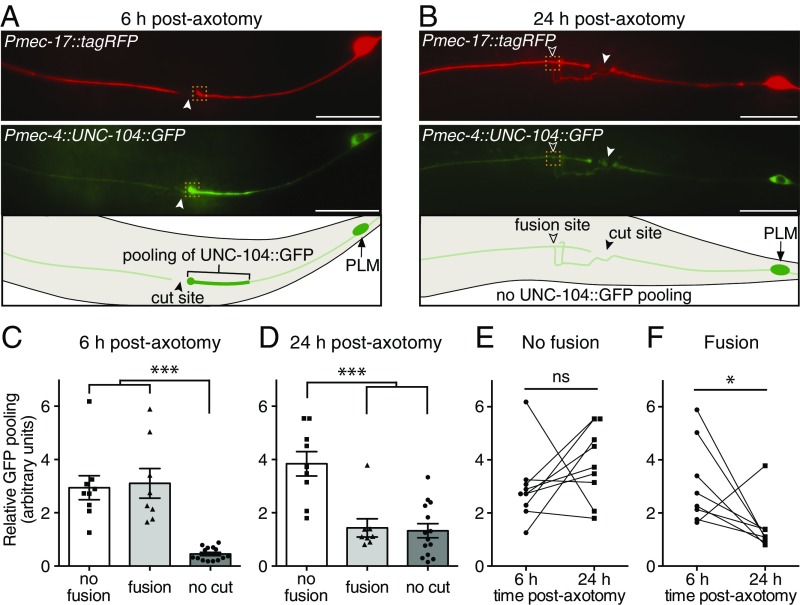
We previously showed that diffusible fluorophores can traverse across the site of axonal fusion in both anterograde and retrograde directions (17). Because of the critical importance of intact transport mechanisms for neuronal function (24), we assessed whether active transport mechanisms are also restored by axonal fusion. To achieve this, we used a functional GFP-tagged version of UNC-104/kinesin-3 (25), a motor protein responsible for the movement of synaptic vesicles to presynaptic sites (26). Expression of this molecule in the PLM neurons produced a weak GFP signal throughout the majority of the axon, with strong fluorescence (pooling) observed at the distal end of the axon and at presynaptic sites (25, 27) (Fig. S2A). We used this pooling of GFP fluorescence as a readout for axonal transport. As expected, axotomy induced pooling of GFP on the proximal side of the cut site, indicating that the axon had been transected and that transport had been blocked (Fig. 2A and Fig. S2B). As shown in Fig. 2 B–F, this blockage of axonal transport was released after axonal fusion, whereas GFP pooling remained in those animals in which axonal fusion did not occur (Fig. S2C). Thus, axonal fusion reestablishes movement of UNC-104/kinesin-3 and active anterograde transport.
Fig. S2.
Analysis of UNC-104::GFP in PLM neurons. (A) Image and schematic of a PLM neuron expressing UNC-104::GFP. Asterisks highlight the pooling of GFP that occurs at the distal end of the axon. Autofluorescence from the intestinal cells is visible in this image. The posterior ventral microtubule (PVM) neuron is also visible in this image. (Scale bars: 25 μm.) (B) Images and schematic showing the localization of tagRFP (Top) and UNC-104::GFP (Middle) in PLM 6 h after axotomy. Pooling of UNC-104::GFP is apparent at the end of the proximal axon fragment. (C) Twenty-four hours postaxotomy, the same axon as shown in B has regrown without axonal fusion, and pooling of GFP is still evident toward the end of the regrowing segment. Closed arrowheads designate cut sites; dashed boxes highlight the regions used for quantification of relative GFP pooling levels shown in Fig. 2 C–E. Note the accumulation of both red and green fluorophores at the site of axotomy at both time points (B and C), likely the result of collateral tissue damage caused by the UV laser. (Scale bars: 25 μm.)
Fig. 2.
Axonal transport is restored after axonal fusion. (A) Images and schematic 6 h after axotomy of PLM expressing diffusible tagRFP and UNC-104::GFP. Transection of the PLM axon prevents the normal anterograde transport, leading to pooling of UNC-104::GFP fluorescence on the proximal side of the cut site. Closed arrowheads designate cut sites. (Scale bars: 25 μm.) (B) By 24 h postaxotomy, axonal fusion has occurred in the same animal as shown in A, restoring axonal transport and releasing the pool of UNC-104::GFP. Open arrowheads designate fusion sites; dashed boxes in A and B highlight the regions used for quantification of relative GFP pooling in C–F. (C and D) Quantification of GFP pooling at 6 (C) and 24 h (D) postaxotomy in animals that regrew without axonal fusion (no fusion) (Fig. S2 B and C), those that displayed fusion, and those in which no axotomy was performed (no cut). Bars represent mean ± SE. Symbols represent individual animals; n ≥ 8. P values are from Tukey’s multiple comparisons test. ***P < 0.001. Comparison of relative GFP pooling levels at 6 and 24 h postaxotomy (E) in animals where axonal fusion was not observed and (F) in animals where fusion was observed. Data shown in E and F are replotted from C and D. Symbols represent individual animals, and lines connect the responses of the same animals; P values are from paired t tests. ns, not significant. *P < 0.05.
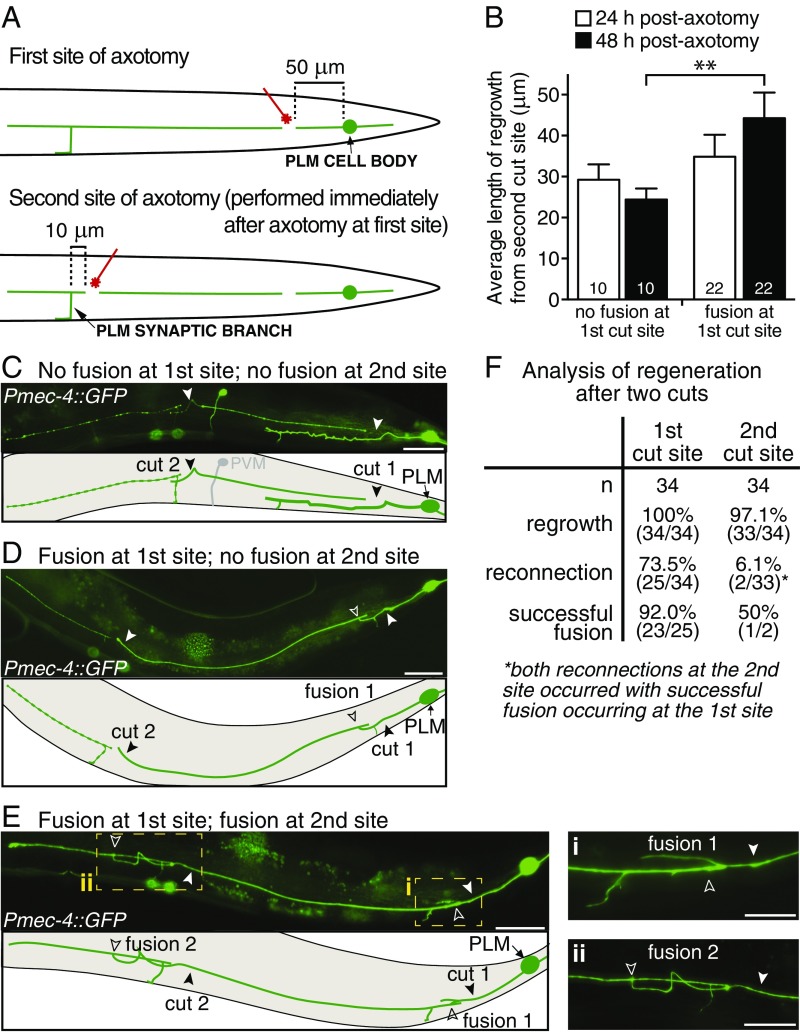
To further investigate functional recovery, we asked if the regenerative capacity of PLM could be restored by axonal fusion. To address this, we performed experiments in which the PLM axon was transected at two different sites: first, at the typical site 50 μm anterior to the cell body and second, immediately afterward at a more anterior point (10 μm posterior to the synaptic branch, equating to ≈250 μm anterior to the cell body) (Fig. 3A). We compared the length of regrowth from the second axotomy site at 24 and 48 h postaxotomy in animals with no fusion at the first site as well as in those where axonal fusion occurred at the first site. Interestingly, the vast majority of animals (irrespective of fusion status at the first site of axotomy) displayed regrowth from the second cut within the first 24 h postaxotomy (33 of 34 animals with an average of 33.09 ± 3.84 μm of regrowth) (Fig. 3B, white bars), showing that the PLM axon is able to mount a regenerative response even when separated from its soma. This regrowth confirms previous reports of growth cone activity in severed PLM segments (28), as well as sustained functionality of sensory neurites when separated from their soma (29, 30). However, animals without fusion at the first cut site (Fig. 3C) displayed little to no additional regrowth from the second site after this time point, and in some cases displayed reduced regrowth, likely because of pruning or retraction of the new branches after the 24-h time point (0.89-fold change in average length of regrowth from 24 to 48 h postaxotomy) (Fig. 3B). Conversely, axonal fusion at the first cut site (Fig. 3D) greatly facilitated regeneration from the second site, with significant regrowth observed in these animals between the 24- and 48-h time points (1.36-fold change in regrowth) (Fig. 3B). Remarkably, in one of the animals analyzed, we found evidence of fusion occurring at both sites (Fig. 3 E and F). Taken together, these data provide strong support to the notion that regenerative axonal fusion leads to restoration of neuronal structure and function.
Fig. 3.
Axonal fusion facilitates regrowth from a second site of axotomy. (A) Schematic representation of a lateral view of the PLM neuron showing where the two cuts were performed; Upper shows the first axotomy site ≈50 μm from the PLM cell body, and Lower shows the second site ≈10 μm from the PLM synaptic branch. The second axotomy was performed immediately after the first. (B) Average length of regrowth at 24 h (white bars) and 48 h (black bars) postaxotomy quantified for animals that displayed no fusion at the first site of axotomy and those in which fusion was observed at the first axotomy site. Bars represent mean ± SE; n values are within each bar. P value is from Tukey’s multiple comparisons test. **P < 0.01. Images and schematic of an animal 24 h postaxotomy (C) in which reconnection and fusion have failed to occur at either cut site and (D) in which fusion has occurred only at the first cut site. (E) Images and schematic of an animal 48 h postaxotomy with fusion occurring at both cut sites. Dashed boxes highlight regions magnified in Right, which shows the two fusion sites after transection 50 μm anterior from the cell body (i) and 10 μm posterior from the synaptic branch (ii). This was the only animal in which double fusion was observed; one other animal displayed reconnection at the second site but not successful fusion. No reconnection events were observed at the second site in animals without fusion at the first site. Closed arrowheads designate the cut sites, and open arrowheads designate the fusion sites. Autofluorescence from the intestinal cells is visible in some images. (Scale bars: C–E, 25 μm; E, i and ii, 10 μm.) (F) Table displays the number of animals presenting regrowth, reconnection, and successful fusion at the first and second cut sites.
The Level of Axonal Fusion Is Modulated by Age.
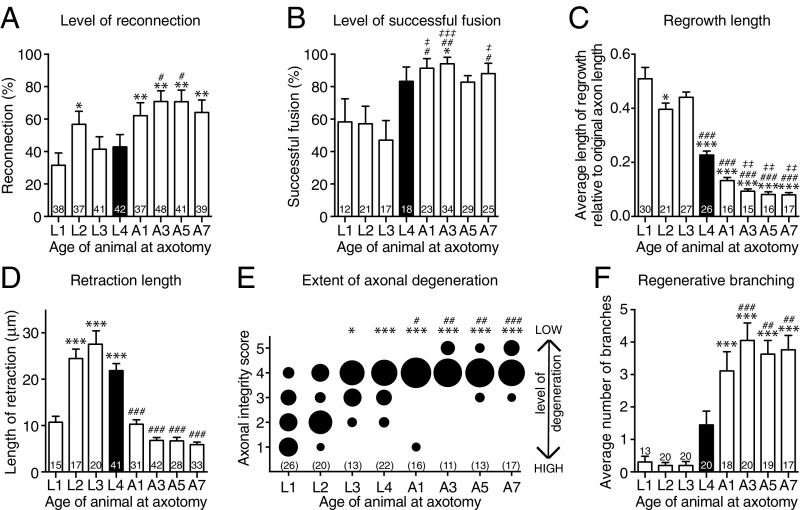
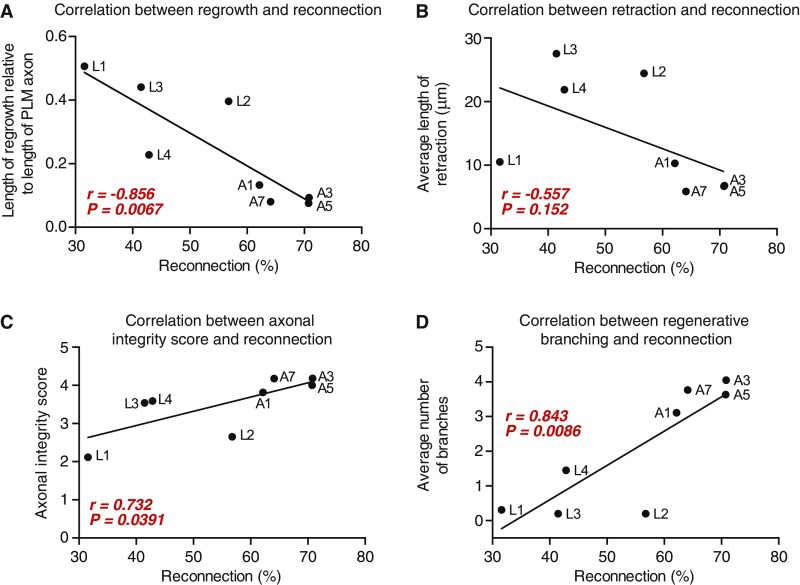
To define how the level of axonal fusion changes with age, we performed PLM axotomies in animals at each of the four developmental larval stages and in four different adult stages. This revealed that larval-stage animals present a relatively low level of reconnection and successful fusion [defined as maintenance of the separated distal segment after reconnection had been made (17, 18)] compared with adult-stage animals that displayed a high capacity for using axonal fusion as a means of repair (Fig. 4 A and B and Table S1). As it is well-established that the length of regrowth declines with advancing age, we next determined how the level of reconnection compared with the length of regrowth. To account for the dramatic increase in the length of the PLM axon that occurs during development (mean length 189.84 ± 7.94 μm at L1 compared with 571.71 ± 17.21 μm at the 5-d-old adult stage; n ≥ 14, P value from t test: P < 0.001), we calculated the average length of regrowth relative to the total length of the PLM axon. Regrowth capacity was maximal in the early larval stages and significantly reduced in the adult stages (Fig. 4C and Table S1). Intriguingly, the extent of reconnection showed a strong inverse correlation with the average length of regrowth (r = −0.856) (Fig. S3A). We also found that the level of reconnection inversely correlated with the length of retraction after axotomy (r = −0.557) (Fig. 4D and Fig. S3B) and with the extent of axonal degeneration (r = 0.732) (Fig. 4E and Fig. S3C) and directly correlated with the amount of regenerative branching (r = 0.843) (Fig. 4F and Fig. S3D).
Fig. 4.
Axonal reconnection and fusion increase with age and are related to regrowth, degeneration, and branching. (A) The percentage of proximal–distal reconnection in PLM neurons 24 h postaxotomy in animals of different ages; n values are within each bar. Black bar designates L4 animals that were used for analyses in other figures. P values are from t test. *P < 0.05 compared with L1; **P < 0.01 compared with L1; #P < 0.05 compared with L3 and L4. (B) The percentage of successful axonal fusion in PLM neurons in animals that underwent axotomy at different ages. Data in B are derived from the animals displaying reconnection in A. P values are from t test. *P < 0.05 compared with L1; #P < 0.05 compared with L2; ##P < 0.01 compared with L2; ‡P < 0.05 compared with L3; ‡‡‡P < 0.001 compared with L3. (C) The average length of regrowth calculated 24 h postaxotomy across different ages relative to the length of the original PLM axon. P values are from Tukey’s multiple comparisons test. *P < 0.05 compared with L1; ***P < 0.001 compared with L1; ###P < 0.001 compared with L2 and L3; ‡‡P < 0.01 compared with L4. (D) The average length of retraction between the proximal and distal axons 24 h postaxotomy across animals of varying ages. P values are from Tukey’s multiple comparisons test. Bars represent mean ± SE of proportion (A and B) or ±SE (C and D). ***P < 0.001 compared with L1; ###P < 0.001 compared with L2, L3, and L4. (E) Quantification of axonal degeneration in the separate distal axon segment 24 h postaxotomy using the axonal integrity scoring system (23), where a score of five represents no degeneration, and one represents complete clearance of the separated axon. The area of each circle represents the proportion of data within each category; n values are shown below each bubble plot. P values are from Kruskal–Wallis test. *P < 0.05 compared with L1; ***P < 0.001 compared with L1; #P < 0.05 compared with L2; ##P < 0.01 compared with L2; ###P < 0.001 compared with L2. (F) Quantification of the average number of regenerative branches across different-aged animals 24 h postaxotomy. Bars represent mean ± SE; n values are within or above each bar. P values are from Tukey’s multiple comparisons test. A, adult stage. ***P < 0.001 compared with L1, L2, and L3; ##P < 0.01 compared with L4; ###P < 0.001 compared with L4.
Table S1.
Analysis of regeneration across different ages with axotomy performed at varying distances from the cell body, in different transgenic backgrounds, and in males
| Genotype | n | Regrowth, % | Reconnection, % | Successful fusion, % | Total fusion, % | Length of regrowth, μm |
| zdIs5 L1 | 38 | 100 (38) | 31.6 (12) | 58.3 (7/12) | 18.4 (7/38) | 96.14 |
| zdIs5 L2 | 37 | 100 (37) | 56.8 (21) | 57.1 (12/21) | 32.4 (12/37) | 146.77 |
| zdIs5 L3 | 41 | 100 (41) | 41.5 (17) | 47.1 (8/17) | 19.5 (8/41) | 172.89 |
| zdIs5 L4 | 42 | 100 (42) | 42.9 (18) | 83.3 (15/18) | 35.7 (15/42) | 88.76 |
| zdIs5 A1 | 37 | 100 (37) | 62.2 (23) | 91.3 (21/23) | 56.8 (21/37) | 65.92 |
| zdIs5 A3 | 48 | 100 (48) | 70.8 (34) | 94.1 (32/34) | 66.7 (32/48) | 47.75 |
| zdIs5 A5 | 41 | 100 (41) | 70.7 (29) | 82.8 (24/29) | 58.5 (24/41) | 50.12 |
| zdIs5 A7 | 40 | 97.5 (39) | 64.1 (25) | 88.0 (22/25) | 56.4 (22/39) | 45.72 |
| zdIs5 L4 100 μm | 43 | 100 (43) | 32.6 (14) | 35.7 (5/14) | 11.6 (5/43) | 58.12 |
| zdIs5 L4 150 μm | 54 | 100 (54) | 14.8 (8) | 50.0 (4/8) | 7.4 (4/54) | 64.90 |
| zdIs5 L4 200 μm | 52 | 100 (52) | 7.7 (4) | 50.0 (2/4) | 3.8 (2/52) | 57.99 |
| zdIs5 L4 250 μm | 42 | 100 (42) | 9.5 (4) | 25.0 (1/4) | 2.4 (1/42) | 49.90 |
| zdIs4 L4 | 47 | 100 (47) | 36.2 (17) | 29.4 (5/17) | 10.6 (5/47) | 61.34 |
| jsIs973 L4 | 52 | 100 (52) | 71.2 (37) | 91.9 (34/37) | 65.4 (34/52) | 72.93 |
| uIs115 L4 | 43 | 97.7 (42) | 59.5 (25) | 96.0 (24/25) | 57.1 (24/42) | 67.76 |
| zdIs5 L4 males | 50 | 100 (50) | 36.0 (18) | 88.9 (16/18) | 32.0 (16/50) | 74.96 |
| rpm-1(ju41); zdIs5 L4 | 35 | 100 (35) | 71.4 (25) | 92.0 (23/25) | 65.7 (23/35) | 123.02 |
| dlk-1(ju476); zdIs5 L4 | 41 | 70.7 (29) | 3.45 (1) | 0.0 (0/1) | 0.0 (0/29) | 15.23 |
Axotomies were performed ≈50 μm anterior to the PLM soma unless otherwise stated.
Fig. S3.
Correlation analyses. (A) Correlation between the percentage of reconnection (x axis) and the average length of regrowth (scaled to the original length of the PLM axon; y axis) 24 h postaxotomy. (B) Correlation between the percentage of reconnection (x axis) and the average length of proximal–distal retraction (y axis) 24 h postaxotomy. (C) Correlation between the percentage of reconnection (x axis) and the extent of axonal degeneration in the separated PLM distal segment (axonal integrity score; y axis) 24 h postaxotomy. (D) Correlation between the percentage of reconnection (x axis) and the average number of branches on the regrowing axon (y axis) 24 h postaxotomy; r and P values from Pearson correlation coefficients are displayed in red within each graph. A, adult stage.
PS Exposure Modulates the Extent of Axonal Fusion.
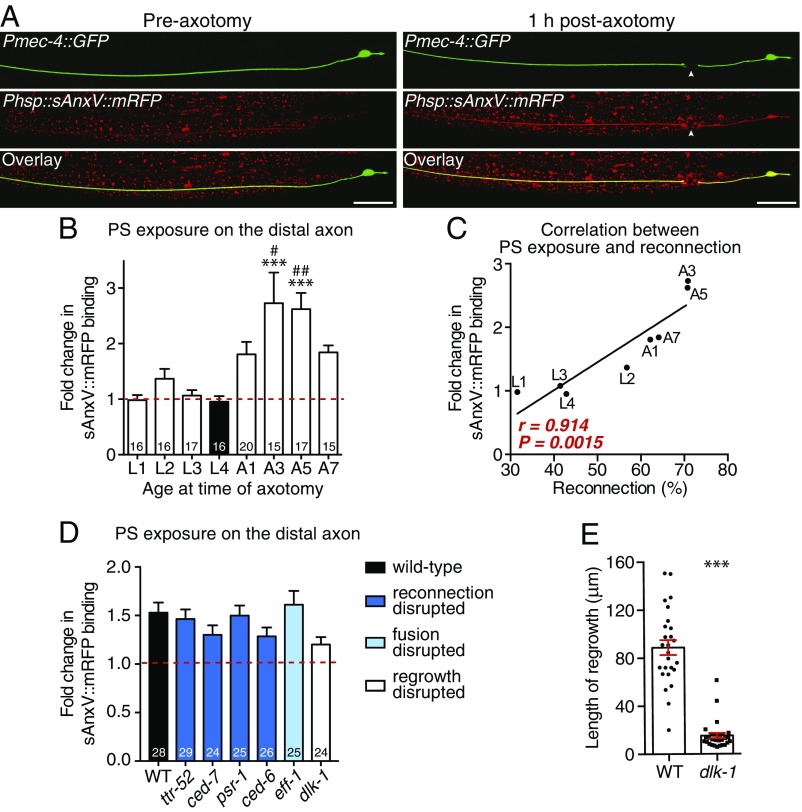
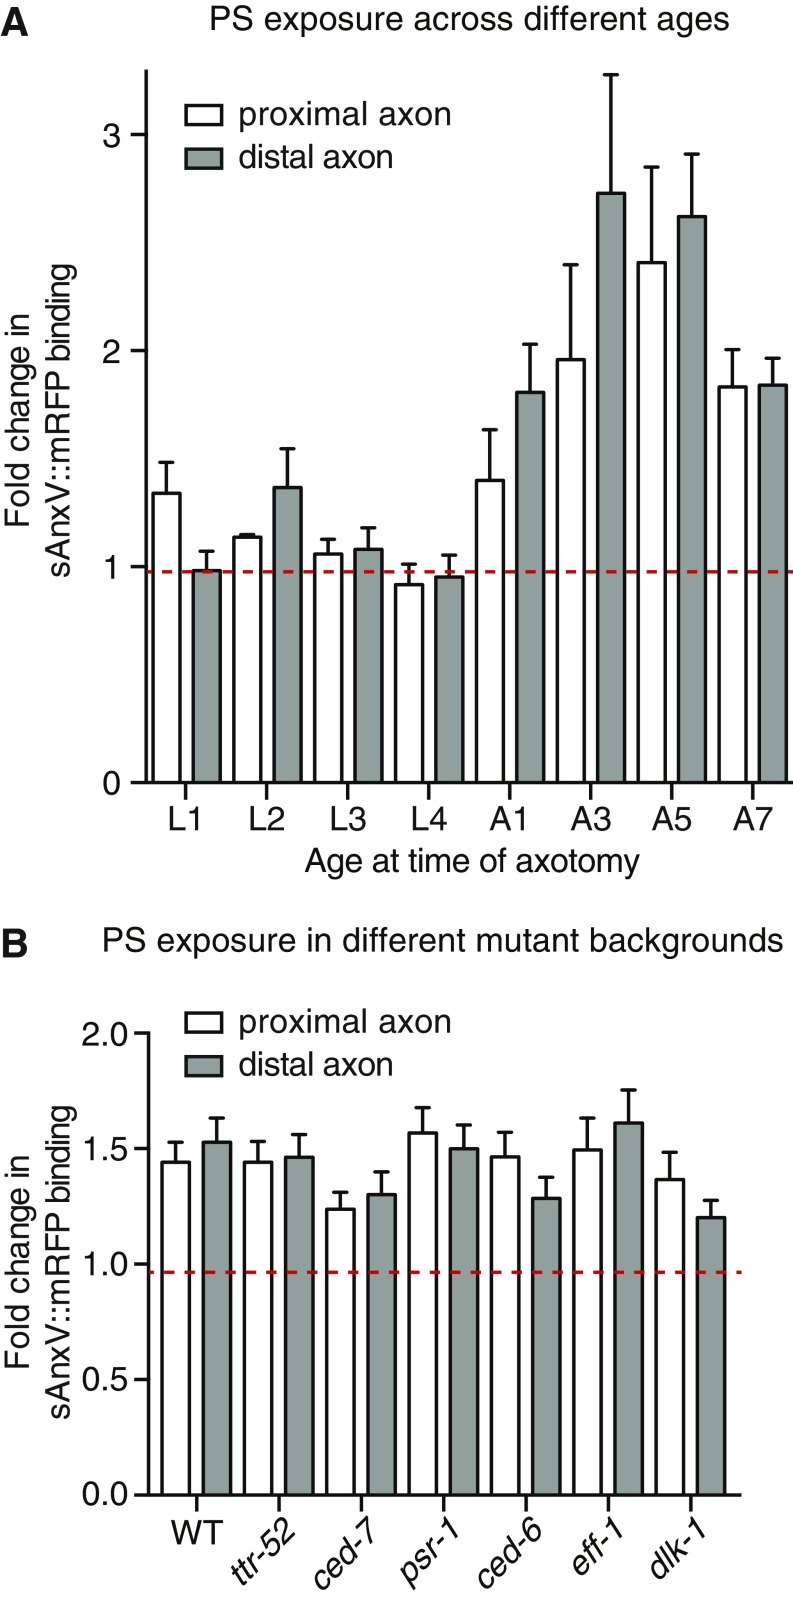
We recently reported that PS is exposed on the external surface of the PLM axon after injury and proposed that this acts as an essential save-me signal for recognition by the regrowing axon (18). To determine whether this PS signal is modulated by age and may, therefore, be responsible for mediating the different levels of axonal fusion across ages, we visualized PS with an inducible mRFP-tagged version of Annexin V (Phsp::sAnxV::mRFP) (31). sAnxV::mRFP expression was induced by heat shock 4 h before PLM axotomy, and PS exposure was quantified 1 h postaxotomy, a time point at which we previously observed strong exposure of PS (18). As shown in Fig. 5 A and B, the relative levels of PS exposure closely mirrored the percentages of reconnection that we observed (Fig. 4A), with very low levels of sAnxV binding detected in larval-stage animals compared with much stronger levels in adults. These different levels of PS exposure displayed a very strong correlation with the levels of reconnection (r = 0.914) (Fig. 5C), indicating that the ability of PLM to undergo axonal fusion is strongly mediated by the amount of PS exposed after injury. Interestingly, we observed comparable levels of PS exposure on both the distal and proximal sides of the cut site across all ages analyzed (Fig. S4A). Similar observations have been made during apoptosis, in which PS exposure on the engulfing cell, in addition to the apoptotic cell, is essential for the efficient clearance of dying cells (31–33). Our data suggest the similar importance of PS exposure on both sides of the membrane, and indicate that the level of PS exposure on the transected axon defines whether regeneration can occur through axonal fusion.
Fig. 5.
PS exposure strongly correlates with the level of axonal fusion. (A) Images of PLM in a 1-d-old adult animal before (Left) and 1 h after (Right) axotomy. The Pmec-4::GFP transgene was used to visualize the PLM neuron, and Phsp::sAnxV::mRFP was used to visualize exposed PS. Overlay images are shown in Bottom; arrowheads designate the cut site. (Scale bars: 25 μm.) (B) Quantification of the change in sAnxV binding to the distal PLM axon segment from before axotomy to 1 h postaxotomy. Bars represent mean ± SE. Dotted line signifies a value of one (no change); n values are within each bar. P values are from Tukey’s multiple comparisons test. ***P < 0.001 compared with L1, L3, and L4; #P < 0.05 compared with L2; ##P < 0.01 compared with L2. (C) Correlation between the percentage of reconnection (x axis) and the fold change in sAnxV::mRFP binding to the distal PLM axon (y axis) 24 h postaxotomy. Data shown in C are replotted from B; r and P values from Pearson correlation coefficients are displayed in the graph. (D) Quantification of the change in sAnxV binding to the distal PLM axon segment 1 h postaxotomy in WT as well as mutant backgrounds that disrupt proximal–distal reconnection (dark blue bars), fusion (light blue bar), or regrowth (white bar). Bars represent mean ± SE. Dotted line signifies a value of one (no change); n values are within each bar. No significant differences were observed from one-way ANOVA. (E) Quantification of regrowth length 24 h postaxotomy in WT and dlk-1(ju476) mutant strains; dlk-1 mutants were also defective in the initiation of regrowth, with 12 of 41 (29.3%) displaying no regrowth compared with 0 of 42 (0%) WT animals: P < 0.001 from t test. Bars represent mean ± SE; symbols represent individual animals. P values are from t test. A, adult stage.***P < 0.001.
Fig. S4.
PS exposure on the PLM axon after axotomy in animals of advancing age and in those defective for reconnection, fusion, and regrowth. (A) Quantification of sAnxV::mRFP binding to the proximal (white bars) or distal (gray bars) PLM axon segments 1 h postaxotomy relative to preaxotomy levels. Red dashed line designates a value of one (no change). Bars represent mean ± SE; n ≥ 15. A, adult stage. (B) Quantification at 1 h postaxotomy relative to preaxotomy levels of sAnxV::mRFP binding to the proximal (white bars) or distal (gray bars) PLM axon segments of the WT and animals carrying mutations in the listed genes. Bars represent mean ± SE; n ≥ 24. Red dashed line designates a value of one (no change).
We previously showed that proximal–distal reconnection during axonal fusion is mediated by components of the apoptotic recognition pathway (18). The secreted lipid binding protein TTR-52/transthyretin, the membrane-bound CED-7/ABC transporter, the PS receptor PSR-1, and the intracellular adapter CED-6/GULP function in a molecular cascade to allow the regrowing proximal axon to recognize its separated distal segment (18). To determine if these molecules affect PS exposure and to better define the pathway of regrowth, reconnection, and fusion, we quantified sAnxV binding in animals carrying mutations in the encoding genes. As shown in Fig. 5D and Fig. S4B, mutations in any of the genes involved in reconnection failed to significantly alter the level of PS exposed on the PLM axon after axotomy. Next, we performed similar experiments in animals lacking the fusogen EFF-1, which is required for fusing the axonal membranes after reconnection occurs (5, 18). Similar to our findings for the genes involved in reconnection, loss of EFF-1 did not affect the level of PS exposed after axotomy compared with WT animals (Fig. 5D and Fig. S4B). Finally, we assessed PS exposure in animals defective for regrowth by targeting the MAPKK kinase DLK-1, a key intrinsic regulator of axonal regeneration (3, 4). Although loss of DLK-1 largely abolished PLM regrowth (Fig. 5E), the level of PS exposed was not significantly changed compared with WT animals (Fig. 5D and Fig. S4B). Overall, these results show that PS exposure is an early, initiating event for axonal fusion, which is not affected by disrupting downstream molecules involved in regrowth, reconnection, or fusion.
The Location of Axotomy and the Genetic Background Influence the Level of Axonal Fusion.
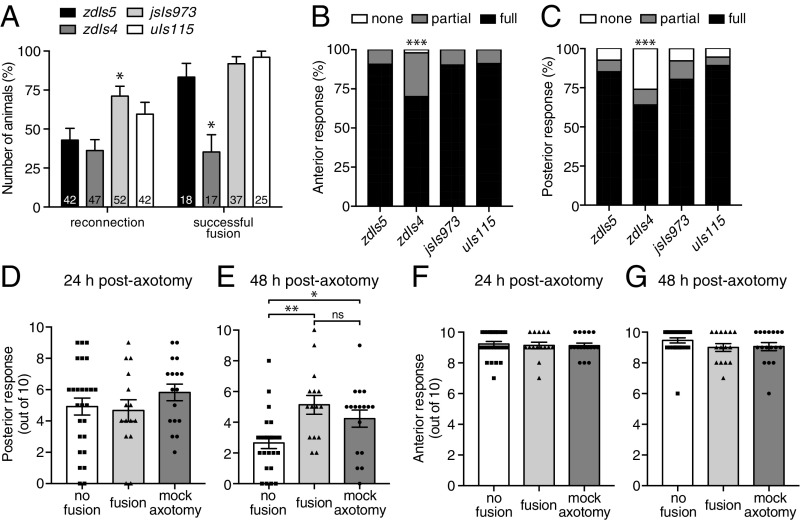
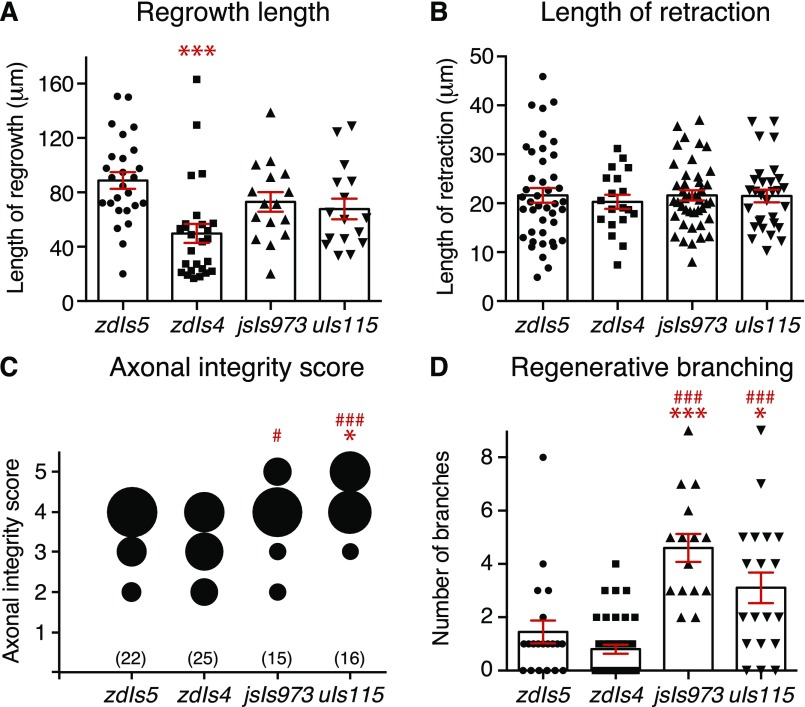
To determine whether axonal fusion is affected by different genetic backgrounds as previous suggested (5), we compared the regrowth of PLM in four different transgenic strains: zdIs5(Pmec-4::GFP), which we routinely use for analysis; zdIs4(Pmec-4::GFP), which is an independent but similar transgene integrated in a different region of the genome; jsIs973(Pmec-7::mRFP), in which PLM is labeled with the red fluorescent protein mRFP; and uIs115(Pmec-17::tagRFP), in which a different red fluorescent protein (tagRFP) labels PLM. Interestingly, we found differences in many aspects of regeneration between the four transgenes, including in the percentages of reconnection and successful fusion (Fig. 6A), the length of regrowth, the extent of degeneration in the separated distal fragment, and the level of regenerative branching (Fig. S5). PLM neurons in the jsIs973 background displayed a large increase in the percentage of reconnection, increasing from ≈40% in zdIs5 and zdIs4 to more than 70% (Fig. 6A), which corresponded to a large increase in the level of regenerative branching (Fig. S5D). Animals analyzed in the zdIs4 background displayed an ≈50% reduction in the level of successful fusion compared with the other three transgenes (Fig. 6A) as well as a similar reduction in regrowth potential (Fig. S5A). To assess whether these differences were associated with variation in mechanosensory function between the strains, we performed two-trial touch assays in the absence of any manipulations. The responses of animals carrying the zdIs5, jsIs973, and uIs115 transgenes were indistinguishable from one another; however, those with the zdIs4 transgene displayed significantly reduced responses to both anterior and posterior stimulations (Fig. 6 B and C). To determine if these differences would affect recovery of function after axotomy, we repeated the assays shown in Fig. 1 in animals carrying the zdIs4 transgene. As shown in Fig. 6 D and E, animals displaying axonal fusion again displayed a strong recovery of function 48 h postaxotomy that was not significantly different from the mock axotomy condition. Disruption of the posterior mechanosensory neurons again had no effect on the function of the anterior mechanosensory neurons (Fig. 6 F and G). Thus, despite the differences in penetrance between the genetic backgrounds, a substantial number of animals displayed regenerative axonal fusion in all four, and this was again concomitant with full recovery of function.
Fig. 6.
Axonal fusion is modulated by genetic background. (A) Quantification of reconnection and successful axonal fusion in different genetic backgrounds: zdIs5(Pmec-4::GFP), zdIs4(Pmec-4::GFP), jsIs973(Pmec-7::mRFP), and uIs115(Pmec-17::tagRFP). Bars represent mean ± SE of proportion; n values are within each bar. P values are from t tests. *P < 0.05. (B and C) Behavioral response of four different transgenic backgrounds to mechanical stimulation (two-trial light touch assays) performed either on the anterior (B) or posterior (C) section of the animals. Bars represent proportions of animals with each response (full, partial, or none); n ≥ 100. P values are from Fisher’s exact test. ***P < 0.001. (D and E) A light touch assay was performed on zdIs4 animals with one PLM neuron ablated and the second transected as per Fig. 1. Responses were recorded at 24 h (D) and 48 h (E) postaxotomy. Animals with one PLM ablated and no axotomy performed on the second PLM neuron were used as controls (mock axotomy). Bars represent mean ± SE; symbols represent individual animals. P values are from Tukey’s multiple comparisons test. ns, not significant. *P < 0.05; **P < 0.01. (F and G) Backward response to anterior light touch at 24 h (F) and 48 h (G) postaxotomy for animals in which one PLM neuron was ablated and the axon of the second PLM was either transected or left intact (mock axotomy); disruption of the posterior mechanosensory neurons did not affect the function of the anterior mechanosensory neurons.
Fig. S5.
Analysis of axonal dynamics in axotomized PLM neurons in different transgenic backgrounds. (A) Length of regrowth from the cut site quantified 24 h postaxotomy of PLM performed in different transgenic backgrounds [zdIs5(Pmec-4::GFP), zdIs4(Pmec-4::GFP), jsIs973(Pmec-7::mRFP), uIs115(Pmec-17::tagRFP)]. Bars represent mean ± SE; symbols represent individual animals. P values are from Tukey’s multiple comparisons test. ***P < 0.001 compared with zdIs5. (B) Length of retraction quantified for the same animals shown in A. (C) Quantification of axonal degeneration in the separate axon segment 24 h postaxotomy using the axonal integrity scoring system. The area of each circle represents the proportion of data within each category; n values are shown below each bubble plot. P values are from Kruskal–Wallis test. *P < 0.05 compared with zdIs5; #P < 0.05 compared with zdIs4; ###P < 0.001 compared with zdIs4. (D) Average number of branches on the regrowing axon quantified for the same animals shown in A. Bars represent mean ± SE; symbols represent individual animals. P values are from Tukey’s multiple comparisons test. *P < 0.05 compared with zdIs5; ***P < 0.001 compared with zdIs5; ###P < 0.001 compared with zdIs4.
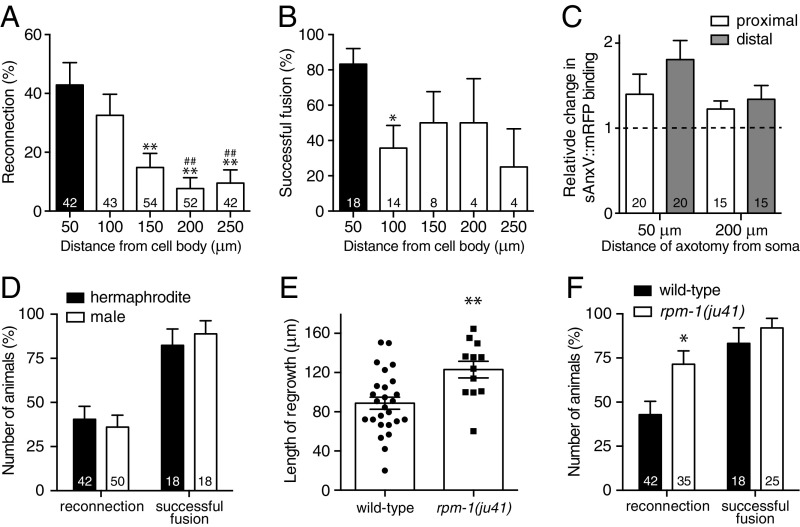
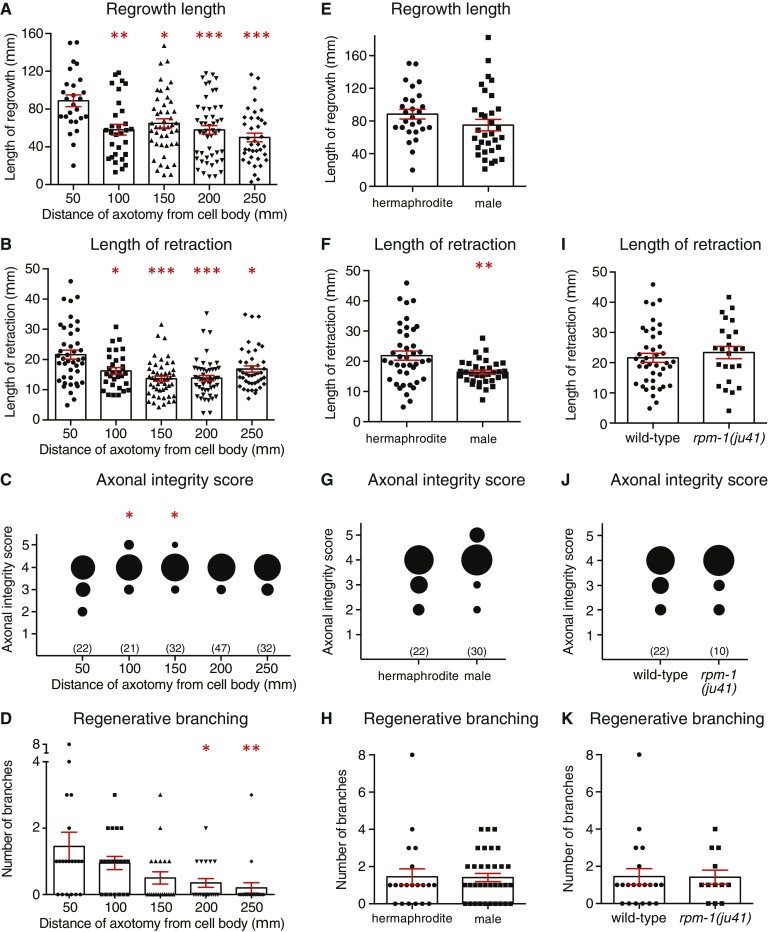
To assess whether the dynamics of axonal fusion vary along the length of the PLM axon, we performed axotomies at increasing distances from the cell body and assessed regrowth. Axotomies were performed at 50-μm intervals beginning 50 μm from the cell body and extending as far as possible toward the synaptic branch (250 μm), after which the PLM axon does not regrow (1). As shown in Fig. 7A, we found a significant reduction in the percentage of reconnection when we performed axotomies farther from the cell body, with a more than fourfold reduction observed when the axon was severed 200 μm or more from the soma. The level of successful fusion after reconnection was also reduced, with a success rate of 50% or less when the axon was cut beyond the typical 50-μm distance, at which we find an 83% success rate (Fig. 7B and Table S1). Severing the PLM axon at the farther distances led to modest but significant differences in the average length of regrowth and retraction, in the degeneration of the separated fragment, and in the level of branching observed after axotomy (Fig. S6 A–D). Analysis of externalized PS using the sAnxV::mRFP marker revealed a 35% reduction in exposure on the distal axon segment when axotomy was performed 200 μm from the PLM cell body compared with when it was cut at 50 μm (Fig. 7C). Although this reduction did not reach statistical significance (P = 0.1003 from t test), the large decrease adds support to the notion that PS exposure is a critical factor in determining the level of axonal fusion.
Fig. 7.
Axonal fusion is modulated by the site of axotomy and regrowth potential. (A) Quantification of reconnection between the regrowing proximal axon and the separated distal segment after transections performed at increasing distances from the PLM cell body. Bars represent mean ± SE of proportion; n values are within each bar. P values are from t test. **P < 0.01 compared with 50 μm; ##P < 0.01 compared with 100 μm. (B) Quantification of successful axonal fusion in animals displaying reconnection after transections performed at varying distances from the PLM cell body. Data in B are derived from the animals displaying reconnection in A. P values are from t test. *P < 0.05 compared with 50 μm. (C) Quantification of sAnxV::mRFP binding to the proximal (white bars) and distal (gray bars) segments of PLM 1 h postaxotomy performed at either 50 or 200 μm from the cell body. Bars represent mean ± SE. Dotted line signifies a value of one (no change); n values are within each bar. (D) Comparison of reconnection and successful axonal fusion in zdIs5(Pmec-4::GFP) hermaphrodites (black bars) and males (white bars). Bars represent mean ± SE of proportion; n values are within each bar. (E) Average length of regrowth in the WT and rpm-1(ju41) mutants. Bars represent mean ± SE; symbols represent individual animals. P values are from t test. **P < 0.01. (F) Quantification of reconnection and successful axonal fusion in WT (black bars) and rpm-1(ju41) (white bars) animals. Bars represent mean ± SE of proportion; n values within each bar. P values are from t test. *P < 0.05.
Fig. S6.
Analysis of axonal dynamics after axotomy of the PLM neurons at varying distances from the cell body, in different sexes, and in rpm-1 mutants. (A–D) Length of regrowth (A), retraction (B), level of axonal degeneration (C), and regenerative branching (D) quantified 24 h postaxotomy of PLM performed at different distances from the cell body. (E–H) Length of regrowth (E), retraction (F), level of axonal degeneration (G), and regenerative branching (H) quantified 24 h postaxotomy of PLM performed in hermaphrodites or males. (I–K) Length of retraction (I), level of axonal degeneration (J), and regenerative branching (K) quantified 24 h postaxotomy of PLM performed in the WT and rpm-1(ju41) mutants. Bars represent mean ± SE; symbols represent individual animals. Axonal degeneration was quantified using the axonal integrity scoring system (23). Area of each circle represents the proportion of data within each category; n values are shown below each bubble plot. P values are from Tukey’s multiple comparisons test in A, B, and D. P values in C are from Kruskal–Wallis test. P values are from t test in F. *P < 0.05 compared with 50 μm in A, B, and D; **P < 0.01 compared with 50 μm in A, B, and D; ***P < 0.001 compared with 50 μm in A, B, and D; *P < 0.05 compared with 50 μm in C; **P < 0.01 in F.
We next assessed whether sex differences affected regeneration of the PLM neurons. As shown in Fig. 7D, PLM displayed almost identical percentages of reconnection and successful fusion in males and in hermaphrodites. Males were also similar in their average length of regrowth, branching, and extent of degeneration in the separated axon segment (Fig. S6 E, G, and H), although they did show significant differences in the length of retraction (Fig. S6F). Taken together, these results suggest that sex does not have a strong effect on the dynamics of axonal regeneration in C. elegans.
The Level of Axonal Fusion Can Be Enhanced by Increasing Regrowth Potential.
The DLK-1 mitogen-activated kinase pathway is a major conserved regulator of axonal regeneration (34). The ubiquitin ligase RPM-1 negatively regulates DLK-1; loss of RPM-1 stabilizes DLK-1, a condition that has previously been shown to increase axonal regeneration of the C. elegans GABAergic motor and anterior ventral mechanosensory neurons (4, 21). To determine if the level of axonal fusion could be enhanced by simply increasing the length of regrowth, we analyzed regeneration in animals carrying a loss-of-function allele in rpm-1. As shown in Fig. 7E, we found that animals carrying the rpm-1(ju41) mutant allele displayed a 39% increase in the length of PLM regrowth 24 h postaxotomy, whereas there was no effect on the length of retraction, level of degeneration in the separated distal segment, or the average number of regenerative branches (Fig. S6 I–K). This increase in length of regrowth was sufficient to significantly increase the percentage of reconnection from 43% in WT animals to 71% in rpm-1(ju41) animals (Fig. 7F), and resulted in a 30% increase in the total number of animals regrowing through axonal fusion (35.7% in the WT compared with 65.7% in rpm-1 mutants) (Table S1). Thus, these data indicate that genetic enhancement of regrowth capacity can be used to facilitate axonal fusion.
Discussion
Complete regeneration of neuronal circuits is essential for full recovery of function after injury to the nervous system. Here, we show that regenerative axonal fusion achieves this goal through restoration of the damaged neuron and complete functional recovery. Axonal fusion prevents degeneration of the detached axon segment, restores membrane and cytoplasmic continuity (17), reinstates axonal transport and the regrowth capacity of the axon, and as a consequence, restores full functionality within 48 h of injury. Previous research in other species is also supportive of axonal fusion as an efficient means of restoring function after injury. Bedi and Glanzman (12) reported that an axonal fusion-like mechanism in cultured mechanosensory neurons of Aplysia californica restored cytoplasmic continuity and suppressed the hyperexcitability and morphological changes normally associated with damaged axons. Furthermore, axonal fusion in the regenerating axons of crayfish, earthworms, and leeches allows action potentials generated proximal to the lesion to pass through the fusion site and into the distal axon segments (13–15). Thus, axonal fusion seems to provide an efficient means of achieving functional recovery in every species in which it has been observed.
The observed decline in regrowth capacity of the PLM neurons with increasing age accords with previous data obtained in this species (34), and also parallels observations made in mammalian species (35–37). However, somewhat counterintuitively, we observed a large increase in the level of axonal fusion with advancing age and found that higher percentages of reconnection strongly correlate with reduced regrowth capacity. Perhaps more predictably, we also observed that the reconnection percentage strongly correlated with reduced retraction, reduced degeneration in the distal segment, and increased number of branches extending from the regrowing axon. These factors facilitate fusion by providing a reduction in the distance between the proximal and distal ends of the axon, a more intact distal segment, and a greater probability of contact between the two segments. Moreover, the increased frequency of axonal fusion observed in the regrowth-promoting rpm-1 mutant background shows that declining regrowth potential can be uncoupled from the increased level of fusion. Thus, although older animals lack the regrowth capacity of their younger counterparts, they maintain sufficient levels of regrowth to permit axonal extension across the cut site.
We observed a very strong correlation between the relative level of PS exposure and the reconnection percentage. We also showed that PS exposure is unchanged by mutations in pathways that disrupt regrowth, reconnection, or fusion. These data together with our previous research showing PS exposure on the PLM axon within 15 min of axotomy (18) strongly support the notion that PS exposure is a crucial early event that is required for proximal–distal reconnection to occur. PS is normally restricted to the inner leaflet of plasma membranes through the activity of flippase proteins that translocate it in an ATP-dependent manner from the outer to the inner leaflet of the membrane (38). Initiation of cellular events, such as apoptosis or platelet activation, disrupts this polarized distribution of PS through the caspase-mediated inactivation of flippases (39) and activation of scramblase proteins through caspase- and/or Ca2+-dependent mechanisms (40–43). Consequently, PS is aberrantly exposed on the external leaflet of the membrane, where it serves as a recognition signal to trigger the phagocytic engulfment of apoptotic cells (44) or act as a scaffold for coagulation factors (45). In the case of axonal fusion, exposed PS serves as a save-me signal that mediates the recognition between the regrowing axon and its detached segment (18). Given that the loss of either the executioner caspase CED-3 or its activator CED-4/APAF-1 does not significantly affect the level of axonal fusion in the PLM neurons (18), it is likely that the exposure of PS after axonal injury is not caspase-dependent. Although C. elegans possesses three other caspase-like molecules (46) that are yet to be studied in the context of axonal fusion, we speculate that Ca2+-dependent scramblases are likely to mediate PS exposure after axotomy in the PLM neurons. Indeed, axotomy of these neurons induces rapid calcium transients that correlate with the length of regrowth (5) and also correspond with the rapid exposure of PS that occurs after axotomy (18). Our data showing that the level of PS exposure increases with age suggest that this more robust presentation of the save-me signal circumvents the severely restricted regrowth capacity present in older animals and therefore, permits a higher incidence of complete repair through axonal fusion.
Accompanying the exposure of PS on the separated axon fragment is similar exposure on the proximal side of the cut site (this study and ref. 18). Interestingly, similar observations have been made during apoptosis, in which both dying and engulfing cells present PS on their external surfaces (31–33). Exposure of PS on the phagocytic membrane is important for cell corpse engulfment, which in C. elegans, has been shown to occur through the transfer of PS-containing vesicles from the dying cell in a CED-7/ABC transporter- and TTR-52/transthyretin-dependent fashion (31). We previously showed the importance of both of these molecules in axonal fusion, revealing that loss of either CED-7 or TTR-52 strongly reduced the percentage of reconnection and successful fusion events after axotomy (18). Our data showing no change in PS exposure on either the proximal or distal segments in the absence of these molecules may suggest that they do not perform the same function during axonal fusion as they do during apoptosis. Alternatively, they might mediate the transfer of PS at later time points during the regenerative process (i.e., beyond the 1-h time point analyzed in this study) or possess redundant roles. Although the role of PS exposure in mediating axonal fusion is clear, its function on the proximal side of the cut site and exactly how it is regulated remain to be determined.
PS has previously been show to carry out important roles in diverse membrane fusion events. During the process of exocytosis, SNARE proteins mediate the docking of synaptic vesicles with their presynaptic target membranes (47). Temporal control for this process is provided by synaptotagmin-1 in the membrane of the vesicles. Binding of Ca2+ to synaptotagmin-1 allows it to insert into the target membrane and permits interactions with SNARE proteins and membrane phospholipids to induce fusion between the two membranes (48). PS is essential for efficient binding of synaptotagmin-1 to the membrane, increasing the depth of its membrane penetration and reducing its dissociation rate from the membrane (49). PS is also vital for the normal function of α-synuclein, a Parkinson’s disease-associated protein, in promoting SNARE complex assembly and vesicle docking (50). In addition, PS exposure is a key event for fusion events outside of the nervous system, including during homotypic fusion essential for correct morphogenesis and function of the endoplasmic reticulum (51) and for myotube formation (52), macrophage polykaryon formation (53), fertilization of eggs (54), and development of the placental syncytiotrophoblast (55). Thus, nonapoptotic exposure of PS seems to be play a common role in various types of membrane fusion events through interactions with a variety of different proteins.
Exposed PS also serves as a cofactor for viral infection. Binding of HIV-1 to receptors on its target cell surface induces PS exposure, which plays an important role in mediating membrane fusion and viral infection (56). Furthermore, a number of other viruses require PS for efficient host–cell infection, including vaccinia, dengue, and Ebola (57–59). Intriguingly, the E glycoprotein of dengue virus and EFF-1 are structurally and functionally related class II fusion proteins (60). As both proteins require PS for membrane fusion, it is possible that PS has similar functions during the various cell–cell, virus–cell, and axon–axon fusion events. It is also conceivable, therefore, that, under specific circumstances, structurally similar fusion proteins in other species might also be capable of mediating axonal fusion-like regenerative paradigms.
An important finding from this study is that the level of axonal fusion can be endogenously modulated by age, injury site, and the level of PS exposure, and can be ectopically increased by enhancing regrowth capacity. This knowledge combined with the identification of the molecular pathways that mediate the process (18) significantly build on our understanding of this efficient and functional regenerative mechanism. Extensive recent reports have established genetic targets that could be used to significantly promote regeneration in mammalian systems (61) and establish viable strategies with which to induce axonal fusion-like mechanisms to repair peripheral nervous system injuries (62). A complete understanding of the axonal fusion process in C. elegans may, therefore, aid in the development of paradigms to induce axonal fusion mechanisms for therapeutic purposes.
Methods
C. elegans Strains and Genetics.
Maintenance, crosses, and other genetic manipulations were all performed via standard procedures (63). Hermaphrodites were used for all experiments unless otherwise specified and were grown at 20 °C on nematode growth medium (NGM) plates seeded with OP50 Escherichia coli. The ced-6(n1813), ced-7(n2690), dlk-1(ju476), eff-1(ok1021), psr-1(ok714), rpm-1(ju41), and ttr-52(sm211) mutant strains were used together with the following transgenes: jsIs1111(Pmec-4::UNC-104::GFP) (25), jsIs973(Pmec-7::mRFP) (64), smIs95(Phsp16-2::sAnxV::mRFP) (31), uIs115(Pmec-17::tagRFP) (65), zdIs4(Pmec-4::GFP), and zdIs5(Pmec-4::GFP). A full list of strains is provided in Table S2.
Table S2.
Strains used in this study
| Strain | Genotype | Origin |
| QH3135 | zdIs5(Pmec-4::GFP) | Laboratory of M.A.H. |
| QH3714 | zdIs4(Pmec-4::GFP) | Laboratory of M.A.H. |
| NM3336 | jsIs973[Pmec-7::mRFP, unc-119(+)] | Michael Nonet, Washington University, St. Louis |
| TU4065 | uIs115(Pmec-17::tagRFP) | Martin Chalfie, Columbia University, New York |
| CU4204 | smIs95(Phsp16-2::sAnxV::mRFP); zdIs5 | Ding Xue, University of Colorado, Boulder, CO |
| BXN035 | jsIs1111(Pmec-4::UNC-104::GFP); uIs115 | Laboratory of B.N. |
| QH3742 | dlk-1(ju476); zdIs5 | Laboratory of M.A.H. |
| QH5081 | rpm-1(ju41); zdIs5 | Laboratory of M.A.H. |
| QH4665 | ced-6(n1813); smIs95; zdIs5 | Laboratory of M.A.H. |
| BXN323 | ced-7(n2690); smIs95; zdIs5 | Laboratory of B.N. |
| BXN305 | dlk-1(ju476); smIs95; zdIs5 | Laboratory of B.N. |
| BXN303 | eff-1(ok1021); smIs95; zdIs5 | Laboratory of B.N. |
| QH4659 | psr-1(ok714); smIs95; zdIs5 | Laboratory of M.A.H. |
| QH4663 | ttr-52(sm211); smIs95; zdIs5 | Laboratory of M.A.H. |
Laser Axotomy and Microscopy.
Axotomies were performed as previously described (17, 18) at the L1 [7 h posthatching], L2 (16 h posthatching), L3 (26 h posthatching), L4 (32 h posthatching), and 1-, 3-, 5-, and 7-d-old adult stages. Axons were transected ≈50 μm anterior to the PLM cell body (except when stated otherwise), except for L1 animals, which were transected 20 μm anterior to the cell body. Animals were imaged after axotomy using a Zeiss Axio Imager M2 microscope and analyzed at 24-, 48-, and 72-h time points postaxotomy, depending on regenerative capacity.
Quantification of Regrowth.
Axonal regrowth was quantified by measuring the length of the longest regenerative branch extending from the proximal side of the cut site using Zen2 or Image J 1.47n software. Axons that underwent successful fusion were excluded, and only extensions greater that 5 μm were recorded as regrowth. To account for the differences in PLM axon length across age, regrowth was divided by the length of the original axon, which was quantified by measuring the distance from the PLM cell body to the end of the original axon 24 h postaxotomy. Animals in which the separated distal axon had been completely cleared were excluded from these analyses. Retraction length was recorded by measuring the distance between the tips of the proximal and distal axons 24 h postaxotomy. Axonal degeneration was assessed using the axonal integrity scoring system (23), where five represents a completely intact axon, four represents beading/thinning of the axon, three represents one break in the axon, two represents multiple breaks or significant clearing of the axon, and one is a completely cleared axon. Regenerative branches 24 h postaxotomy were quantified by counting novel projections extending >5 μm from the primary branch. Animals with only a primary regrowth branch were given a score of zero. Reconnection events were identified visually using a 63× objective, and successful axonal fusion was defined as the reconnection of the proximal and distal segments that subsequently prevented degeneration of the distal axon (17, 18).
Analysis of Neuronal Function After Axotomy.
Animals were synchronized using a hatch-off method (19), whereby newly hatched larvae (0–30 min posthatch) were transferred to new plates. Twenty hours posthatch (L2), one PLM neuron was laser ablated, and the animals recovered to OP50 seeded NGM agar plates. Twenty-four hours later (L4), the axon of the remaining PLM neuron was transected, and the animals were recovered to seeded plates. A modified version of the light touch assay (22) was used to test the function of the remaining PLM neuron. Individual animals were assessed by gently touching the animals with an eyebrow hair mounted on a pipette tip. Each animal was touched once on the posterior half of the body and once on the anterior half and was not touched again for a period of 3–5 min. This was repeated a total of 10 times. Thus, this represents a 20-trial touch assay with a 3- to 5-min interstimulus interval. For posterior mechanical stimulations, animals were touched farther anterior to the anus than is typical to ensure that the distal axon segment and not the proximal segment was activated. Touch assays were performed before axons were analyzed with epifluorescence microscopy, such that the assay was performed blind to the mechanism of regeneration. For mock axotomy controls, one PLM was ablated; 24 h later, the animal was anesthetized as above, but no axotomy was performed. Instead, the laser was fired at a point ≈10 μm dorsal to the axon. Mock cell ablations were performed similarly, with laser pulses directed 10 μm away from the soma.
Two-Trial Touch Assays.
For analysis of touch response across populations of animals, two-trial touch assays were performed. One-day-old adults within a population of animals were each touched once on the head and once on the tail with an eyebrow hair, and their responses were recorded. Full responses were defined as movement backward (after head touch) or forward (tail touch) more than a body length; partial responses were when the animal responded but moved less than a body length. No responses were when no change in behavior occurred. The individual responses of all of the animals for a given population were combined to represent the percentage of response for a specific strain.
Quantification of UNC-104::GFP.
The maximum intensity of tagRFP and UNC-104::GFP was calculated 6 h postaxotomy from a region at the end of both the proximal and distal sides of the cut site using ImageJ 1.47n software. GFP intensity was normalized to tagRFP, and these values were used to compare the relative GFP intensity on the proximal and distal cut sites. GFP intensity 24 h postaxotomy was quantified from measurements taken at the fusion site or at the end of the longest regrowing branch before being compared with the distal side of the cut site. “No cut” control animals were imaged without axotomy, and measurements were calculated ≈50 μm anterior to the PLM cell body.
Quantification of Annexin V.
To induce sAnx::mRFP expression, smIs95(Phsp16-2::sAnxV::mRFP); zdIs5 animals were incubated at 30 °C for 30 min 4 h before analysis. PS exposure was visualized with a Leica SP8 confocal microscope equipped with LAS X software. Green fluorescence was visualized with a 488-nm laser (2.4% power; 600 gain; 8× averaging), and red fluorescence was visualized with a 543-nm laser (100% power; 1,000 gain; 8× averaging). Fluorescence intensities were calculated from line scans recorded in 15-μm measurements along both the proximal and distal axon segments using ImageJ 1.47n software. To avoid fluorescence caused by collateral damage, line scans were taken 5 μm away from the cut site. mRFP expression 1 h postaxotomy was calculated relative to expression levels immediately preceding axotomy.
Statistical Analysis.
Statistical analysis was performed using GraphPad Prism 7 and Primer of Biostatistics. The error of proportions was used to assess variation across a single population, two-way comparison was performed using the t test, and ANOVA was used for comparing groups with more than two samples followed by Tukey’s multiple comparisons or Kruskal–Wallis (for comparisons of axonal integrity scores, which did not follow a normal distribution) post hoc tests.
Supplementary Material
Acknowledgments
We thank Ding Xue, Sandhya Koushika, Martin Chalfie, and Michael Nonet for sharing strains; Rowan Tweedale, Sean Coakley, and Ming Soh for manuscript comments; and members of the laboratory of B.N. and Roger Pocock's laboratory for valuable input. Some strains were provided by the Caenorhabditis Genetics Center, which is funded by NIH Office of Research Infrastructure Programs P40 OD010440. We acknowledge Monash Micro Imaging, Monash University for the provision of instrumentation, training, and technical support. This work was supported by National Health and Medical Research Council (NHMRC) Project Grant 1101974 (to M.A.H. and B.N.). M.A.H. is also supported by an NHMRC Senior Research Fellowship.
Footnotes
The authors declare no conflict of interest.
This article is a PNAS Direct Submission.
This article contains supporting information online at www.pnas.org/lookup/suppl/doi:10.1073/pnas.1703807114/-/DCSupplemental.
References
- 1.Wu Z, et al. Caenorhabditis elegans neuronal regeneration is influenced by life stage, ephrin signaling, and synaptic branching. Proc Natl Acad Sci USA. 2007;104:15132–15137. doi: 10.1073/pnas.0707001104. [DOI] [PMC free article] [PubMed] [Google Scholar]
- 2.Yanik MF, et al. Neurosurgery: Functional regeneration after laser axotomy. Nature. 2004;432:822. doi: 10.1038/432822a. [DOI] [PubMed] [Google Scholar]
- 3.Yan D, Wu Z, Chisholm AD, Jin Y. The DLK-1 kinase promotes mRNA stability and local translation in C. elegans synapses and axon regeneration. Cell. 2009;138:1005–1018. doi: 10.1016/j.cell.2009.06.023. [DOI] [PMC free article] [PubMed] [Google Scholar]
- 4.Hammarlund M, Nix P, Hauth L, Jorgensen EM, Bastiani M. Axon regeneration requires a conserved MAP kinase pathway. Science. 2009;323:802–806. doi: 10.1126/science.1165527. [DOI] [PMC free article] [PubMed] [Google Scholar]
- 5.Ghosh-Roy A, Wu Z, Goncharov A, Jin Y, Chisholm AD. Calcium and cyclic AMP promote axonal regeneration in Caenorhabditis elegans and require DLK-1 kinase. J Neurosci. 2010;30:3175–3183. doi: 10.1523/JNEUROSCI.5464-09.2010. [DOI] [PMC free article] [PubMed] [Google Scholar]
- 6.Nix P, Hisamoto N, Matsumoto K, Bastiani M. Axon regeneration requires coordinate activation of p38 and JNK MAPK pathways. Proc Natl Acad Sci USA. 2011;108:10738–10743. doi: 10.1073/pnas.1104830108. [DOI] [PMC free article] [PubMed] [Google Scholar]
- 7.Chen L, et al. Axon regeneration pathways identified by systematic genetic screening in C. elegans. Neuron. 2011;71:1043–1057. doi: 10.1016/j.neuron.2011.07.009. [DOI] [PMC free article] [PubMed] [Google Scholar]
- 8.Ghosh-Roy A, Goncharov A, Jin Y, Chisholm AD. Kinesin-13 and tubulin posttranslational modifications regulate microtubule growth in axon regeneration. Dev Cell. 2012;23:716–728. doi: 10.1016/j.devcel.2012.08.010. [DOI] [PMC free article] [PubMed] [Google Scholar]
- 9.Alam T, et al. Axotomy-induced HIF-serotonin signalling axis promotes axon regeneration in C. elegans. Nat Commun. 2016;7:10388. doi: 10.1038/ncomms10388. [DOI] [PMC free article] [PubMed] [Google Scholar]
- 10.Byrne AB, et al. Insulin/IGF1 signaling inhibits age-dependent axon regeneration. Neuron. 2014;81:561–573. doi: 10.1016/j.neuron.2013.11.019. [DOI] [PMC free article] [PubMed] [Google Scholar]
- 11.El Bejjani R, Hammarlund M. Notch signaling inhibits axon regeneration. Neuron. 2012;73:268–278. doi: 10.1016/j.neuron.2011.11.017. [DOI] [PMC free article] [PubMed] [Google Scholar]
- 12.Bedi SS, Glanzman DL. Axonal rejoining inhibits injury-induced long-term changes in Aplysia sensory neurons in vitro. J Neurosci. 2001;21:9667–9677. doi: 10.1523/JNEUROSCI.21-24-09667.2001. [DOI] [PMC free article] [PubMed] [Google Scholar]
- 13.Birse SC, Bittner GD. Regeneration of giant axons in earthworms. Brain Res. 1976;113:575–581. doi: 10.1016/0006-8993(76)90058-5. [DOI] [PubMed] [Google Scholar]
- 14.Deriemer SA, Elliott EJ, Macagno ER, Muller KJ. Morphological evidence that regenerating axons can fuse with severed axon segments. Brain Res. 1983;272:157–161. doi: 10.1016/0006-8993(83)90373-6. [DOI] [PubMed] [Google Scholar]
- 15.Hoy RR, Bittner GD, Kennedy D. Regeneration in crustacean motoneurons: Evidence for axonal fusion. Science. 1967;156:251–252. doi: 10.1126/science.156.3772.251. [DOI] [PubMed] [Google Scholar]
- 16.Macagno ER, Muller KJ, DeRiemer SA. Regeneration of axons and synaptic connections by touch sensory neurons in the leech central nervous system. J Neurosci. 1985;5:2510–2521. doi: 10.1523/JNEUROSCI.05-09-02510.1985. [DOI] [PMC free article] [PubMed] [Google Scholar]
- 17.Neumann B, Nguyen KC, Hall DH, Ben-Yakar A, Hilliard MA. Axonal regeneration proceeds through specific axonal fusion in transected C. elegans neurons. Dev Dyn. 2011;240:1365–1372. doi: 10.1002/dvdy.22606. [DOI] [PMC free article] [PubMed] [Google Scholar]
- 18.Neumann B, et al. EFF-1-mediated regenerative axonal fusion requires components of the apoptotic pathway. Nature. 2015;517:219–222. doi: 10.1038/nature14102. [DOI] [PubMed] [Google Scholar]
- 19.Kirszenblat L, Neumann B, Coakley S, Hilliard MA. A dominant mutation in mec-7/β-tubulin affects axon development and regeneration in Caenorhabditis elegans neurons. Mol Biol Cell. 2013;24:285–296. doi: 10.1091/mbc.E12-06-0441. [DOI] [PMC free article] [PubMed] [Google Scholar]
- 20.Gabel CV, Antoine F, Chuang CF, Samuel AD, Chang C. Distinct cellular and molecular mechanisms mediate initial axon development and adult-stage axon regeneration in C. elegans. Development. 2008;135:1129–1136, and erratum (2008) 135:3623. doi: 10.1242/dev.013995. [DOI] [PubMed] [Google Scholar]
- 21.Zou Y, et al. Developmental decline in neuronal regeneration by the progressive change of two intrinsic timers. Science. 2013;340:372–376. doi: 10.1126/science.1231321. [DOI] [PMC free article] [PubMed] [Google Scholar]
- 22.Chalfie M, Hart AC, Rankin CH, Goodman MB. Assaying mechanosensation. WormBook. July 31, 2014 doi: 10.1895/wormbook.1.172.1. [DOI] [PMC free article] [PubMed] [Google Scholar]
- 23.Nichols AL, et al. The apoptotic engulfment machinery regulates axonal degeneration in C. elegans neurons. Cell Rep. 2016;14:1673–1683. doi: 10.1016/j.celrep.2016.01.050. [DOI] [PMC free article] [PubMed] [Google Scholar]
- 24.Coleman M. Axon degeneration mechanisms: Commonality amid diversity. Nat Rev Neurosci. 2005;6:889–898. doi: 10.1038/nrn1788. [DOI] [PubMed] [Google Scholar]
- 25.Kumar J, et al. The Caenorhabditis elegans kinesin-3 motor UNC-104/KIF1A is degraded upon loss of specific binding to cargo. PLoS Genet. 2010;6:e1001200. doi: 10.1371/journal.pgen.1001200. [DOI] [PMC free article] [PubMed] [Google Scholar]
- 26.Hall DH, Hedgecock EM. Kinesin-related gene unc-104 is required for axonal transport of synaptic vesicles in C. elegans. Cell. 1991;65:837–847. doi: 10.1016/0092-8674(91)90391-b. [DOI] [PubMed] [Google Scholar]
- 27.Neumann B, Hilliard MA. Loss of MEC-17 leads to microtubule instability and axonal degeneration. Cell Rep. 2014;6:93–103. doi: 10.1016/j.celrep.2013.12.004. [DOI] [PMC free article] [PubMed] [Google Scholar]
- 28.Guo SX, et al. Femtosecond laser nanoaxotomy lab-on-a-chip for in vivo nerve regeneration studies. Nat Methods. 2008;5:531–533. doi: 10.1038/nmeth.1203. [DOI] [PMC free article] [PubMed] [Google Scholar]
- 29.Chalfie M, Sulston J. Developmental genetics of the mechanosensory neurons of Caenorhabditis elegans. Dev Biol. 1981;82:358–370. doi: 10.1016/0012-1606(81)90459-0. [DOI] [PubMed] [Google Scholar]
- 30.Clark DA, Biron D, Sengupta P, Samuel AD. The AFD sensory neurons encode multiple functions underlying thermotactic behavior in Caenorhabditis elegans. J Neurosci. 2006;26:7444–7451. doi: 10.1523/JNEUROSCI.1137-06.2006. [DOI] [PMC free article] [PubMed] [Google Scholar]
- 31.Mapes J, et al. CED-1, CED-7, and TTR-52 regulate surface phosphatidylserine expression on apoptotic and phagocytic cells. Curr Biol. 2012;22:1267–1275. doi: 10.1016/j.cub.2012.05.052. [DOI] [PMC free article] [PubMed] [Google Scholar]
- 32.Callahan MK, Williamson P, Schlegel RA. Surface expression of phosphatidylserine on macrophages is required for phagocytosis of apoptotic thymocytes. Cell Death Differ. 2000;7:645–653. doi: 10.1038/sj.cdd.4400690. [DOI] [PubMed] [Google Scholar]
- 33.Marguet D, Luciani MF, Moynault A, Williamson P, Chimini G. Engulfment of apoptotic cells involves the redistribution of membrane phosphatidylserine on phagocyte and prey. Nat Cell Biol. 1999;1:454–456. doi: 10.1038/15690. [DOI] [PubMed] [Google Scholar]
- 34.Byrne AB, Hammarlund M. Axon regeneration in C. elegans: Worming our way to mechanisms of axon regeneration. Exp Neurol. 2017;287(Pt 3):300–309. doi: 10.1016/j.expneurol.2016.08.015. [DOI] [PMC free article] [PubMed] [Google Scholar]
- 35.Geoffroy CG, Hilton BJ, Tetzlaff W, Zheng B. Evidence for an age-dependent decline in axon regeneration in the adult mammalian central nervous system. Cell Rep. 2016;15:238–246. doi: 10.1016/j.celrep.2016.03.028. [DOI] [PMC free article] [PubMed] [Google Scholar]
- 36.Pestronk A, Drachman DB, Griffin JW. Effects of aging on nerve sprouting and regeneration. Exp Neurol. 1980;70:65–82. doi: 10.1016/0014-4886(80)90006-0. [DOI] [PubMed] [Google Scholar]
- 37.Verdú E, Ceballos D, Vilches JJ, Navarro X. Influence of aging on peripheral nerve function and regeneration. J Peripher Nerv Syst. 2000;5:191–208. doi: 10.1046/j.1529-8027.2000.00026.x. [DOI] [PubMed] [Google Scholar]
- 38.Leventis PA, Grinstein S. The distribution and function of phosphatidylserine in cellular membranes. Annu Rev Biophys. 2010;39:407–427. doi: 10.1146/annurev.biophys.093008.131234. [DOI] [PubMed] [Google Scholar]
- 39.Segawa K, et al. Caspase-mediated cleavage of phospholipid flippase for apoptotic phosphatidylserine exposure. Science. 2014;344:1164–1168. doi: 10.1126/science.1252809. [DOI] [PubMed] [Google Scholar]
- 40.Suzuki J, Umeda M, Sims PJ, Nagata S. Calcium-dependent phospholipid scrambling by TMEM16F. Nature. 2010;468:834–838. doi: 10.1038/nature09583. [DOI] [PubMed] [Google Scholar]
- 41.Chen YZ, Mapes J, Lee ES, Skeen-Gaar RR, Xue D. Caspase-mediated activation of Caenorhabditis elegans CED-8 promotes apoptosis and phosphatidylserine externalization. Nat Commun. 2013;4:2726. doi: 10.1038/ncomms3726. [DOI] [PMC free article] [PubMed] [Google Scholar]
- 42.Suzuki J, Denning DP, Imanishi E, Horvitz HR, Nagata S. Xk-related protein 8 and CED-8 promote phosphatidylserine exposure in apoptotic cells. Science. 2013;341:403–406. doi: 10.1126/science.1236758. [DOI] [PubMed] [Google Scholar]
- 43.Segawa K, Nagata S. An apoptotic ‘eat me’ signal: Phosphatidylserine exposure. Trends Cell Biol. 2015;25:639–650. doi: 10.1016/j.tcb.2015.08.003. [DOI] [PubMed] [Google Scholar]
- 44.Fadok VA, et al. Exposure of phosphatidylserine on the surface of apoptotic lymphocytes triggers specific recognition and removal by macrophages. J Immunol. 1992;148:2207–2216. [PubMed] [Google Scholar]
- 45.Bevers EM, Comfurius P, Zwaal RF. Changes in membrane phospholipid distribution during platelet activation. Biochim Biophys Acta. 1983;736:57–66. doi: 10.1016/0005-2736(83)90169-4. [DOI] [PubMed] [Google Scholar]
- 46.Shaham S. Identification of multiple Caenorhabditis elegans caspases and their potential roles in proteolytic cascades. J Biol Chem. 1998;273:35109–35117. doi: 10.1074/jbc.273.52.35109. [DOI] [PubMed] [Google Scholar]
- 47.Hong W, Lev S. Tethering the assembly of SNARE complexes. Trends Cell Biol. 2014;24:35–43. doi: 10.1016/j.tcb.2013.09.006. [DOI] [PubMed] [Google Scholar]
- 48.Südhof TC. Calcium control of neurotransmitter release. Cold Spring Harb Perspect Biol. 2012;4:a011353. doi: 10.1101/cshperspect.a011353. [DOI] [PMC free article] [PubMed] [Google Scholar]
- 49.Pérez-Lara Á, et al. PtdInsP2 and PtdSer cooperate to trap synaptotagmin-1 to the plasma membrane in the presence of calcium. Elife. 2016;5:e15886. doi: 10.7554/eLife.15886. [DOI] [PMC free article] [PubMed] [Google Scholar]
- 50.Lou X, Kim J, Hawk BJ, Shin YK. α-Synuclein may cross-bridge v-SNARE and acidic phospholipids to facilitate SNARE-dependent vesicle docking. Biochem J. 2017;474:2039–2049. doi: 10.1042/BCJ20170200. [DOI] [PMC free article] [PubMed] [Google Scholar]
- 51.Sugiura S, Mima J. Physiological lipid composition is vital for homotypic ER membrane fusion mediated by the dynamin-related GTPase Sey1p. Sci Rep. 2016;6:20407. doi: 10.1038/srep20407. [DOI] [PMC free article] [PubMed] [Google Scholar]
- 52.van den Eijnde SM, et al. Transient expression of phosphatidylserine at cell-cell contact areas is required for myotube formation. J Cell Sci. 2001;114:3631–3642. doi: 10.1242/jcs.114.20.3631. [DOI] [PubMed] [Google Scholar]
- 53.Helming L, Winter J, Gordon S. The scavenger receptor CD36 plays a role in cytokine-induced macrophage fusion. J Cell Sci. 2009;122:453–459. doi: 10.1242/jcs.037200. [DOI] [PMC free article] [PubMed] [Google Scholar]
- 54.Gadella BM, Harrison RA. The capacitating agent bicarbonate induces protein kinase A-dependent changes in phospholipid transbilayer behavior in the sperm plasma membrane. Development. 2000;127:2407–2420. doi: 10.1242/dev.127.11.2407. [DOI] [PubMed] [Google Scholar]
- 55.Adler RR, Ng AK, Rote NS. Monoclonal antiphosphatidylserine antibody inhibits intercellular fusion of the choriocarcinoma line, JAR. Biol Reprod. 1995;53:905–910. doi: 10.1095/biolreprod53.4.905. [DOI] [PubMed] [Google Scholar]
- 56.Zaitseva E, et al. Fusion stage of HIV-1 entry depends on virus-induced cell surface exposure of phosphatidylserine. Cell Host Microbe. 2017;22:99–110.e7. doi: 10.1016/j.chom.2017.06.012. [DOI] [PMC free article] [PubMed] [Google Scholar]
- 57.Amara A, Mercer J. Viral apoptotic mimicry. Nat Rev Microbiol. 2015;13:461–469. doi: 10.1038/nrmicro3469. [DOI] [PMC free article] [PubMed] [Google Scholar]
- 58.Zaitseva E, Yang ST, Melikov K, Pourmal S, Chernomordik LV. Dengue virus ensures its fusion in late endosomes using compartment-specific lipids. PLoS Pathog. 2010;6:e1001131. doi: 10.1371/journal.ppat.1001131. [DOI] [PMC free article] [PubMed] [Google Scholar]
- 59.Mercer J, Helenius A. Vaccinia virus uses macropinocytosis and apoptotic mimicry to enter host cells. Science. 2008;320:531–535. doi: 10.1126/science.1155164. [DOI] [PubMed] [Google Scholar]
- 60.Pérez-Vargas J, et al. Structural basis of eukaryotic cell-cell fusion. Cell. 2014;157:407–419. doi: 10.1016/j.cell.2014.02.020. [DOI] [PubMed] [Google Scholar]
- 61.Chen M, Zheng B. Axon plasticity in the mammalian central nervous system after injury. Trends Neurosci. 2014;37:583–593. doi: 10.1016/j.tins.2014.08.008. [DOI] [PMC free article] [PubMed] [Google Scholar]
- 62.Bittner GD, et al. The curious ability of polyethylene glycol fusion technologies to restore lost behaviors after nerve severance. J Neurosci Res. 2016;94:207–230. doi: 10.1002/jnr.23685. [DOI] [PMC free article] [PubMed] [Google Scholar]
- 63.Brenner S. The genetics of Caenorhabditis elegans. Genetics. 1974;77:71–94. doi: 10.1093/genetics/77.1.71. [DOI] [PMC free article] [PubMed] [Google Scholar]
- 64.Zheng Q, Schaefer AM, Nonet ML. Regulation of C. elegans presynaptic differentiation and neurite branching via a novel signaling pathway initiated by SAM-10. Development. 2011;138:87–96. doi: 10.1242/dev.055350. [DOI] [PMC free article] [PubMed] [Google Scholar]
- 65.Zheng C, Jin FQ, Chalfie M. Hox proteins act as transcriptional guarantors to ensure terminal differentiation. Cell Rep. 2015;13:1343–1352. doi: 10.1016/j.celrep.2015.10.044. [DOI] [PMC free article] [PubMed] [Google Scholar]


