

Abstract
Background: Toxicities due to anti-TB treatment frequently occur among TB/HIV-coinfected patients.
Objectives: To determine the association between anti-TB drug concentrations and the occurrence of hepatotoxicity and peripheral neuropathy among TB/HIV-coinfected patients.
Methods: TB/HIV-coinfected patients were started on standard dose anti-TB treatment according to WHO guidelines. Anti-TB drug concentrations were measured using HPLC 1, 2 and 4 h after drug intake at 2, 8 and 24 weeks following initiation of TB treatment. Participants were assessed for hepatotoxicity using Division of AIDS toxicity tables and for peripheral neuropathy using clinical assessment of tendon reflexes, vibration sensation or symptoms. Cox regression was used to determine the association between toxicities and drug concentrations.
Results: Of the 268 patients enrolled, 58% were male with a median age of 34 years. Participants with no hepatotoxicity or mild, moderate and severe hepatotoxicity had a median Cmax of 6.57 (IQR 4.83–9.41) μg/mL, 7.39 (IQR 5.10–10.20) μg/mL, 7.00 (IQR 6.05–10.95) μg/mL and 3.86 (IQR 2.81–14.24) μg/mL, respectively. There was no difference in the median Cmax of rifampicin among those who had hepatotoxicity and those who did not (P = 0.322). There was no difference in the isoniazid median Cmax among those who had peripheral neuropathy 2.34 (1.52–3.23) μg/mL and those who did not 2.21 (1.45–3.11) μg/mL (P = 0.49).
Conclusions: There was no association between rifampicin concentrations and hepatotoxicity or isoniazid concentrations and peripheral neuropathy among TB/HIV-coinfected patients.
Introduction
Of the 10.4 million people with TB worldwide, 12% are HIV-coinfected (1.2 million). The risk for TB is up to 30 times higher in HIV-infected patients compared with the HIV-uninfected population. The TB/HIV epidemic is concentrated in sub-Saharan Africa, which bears over 50% of the global burden of TB/HIV-coinfection.1 Curative treatment for TB is available, though requires adherence to a prolonged duration of drug therapy and may expose patients to drug-induced toxicities. The standard recommended treatment for TB includes rifampicin, isoniazid, ethambutol and pyrazinamide over a 2 month intensive phase followed by a continuation phase with rifampicin and isoniazid for 4 months.
Anti-TB drugs are generally well tolerated though toxicities may occur in up to 80% of patients with TB.2 One of the most common toxicities of anti-TB drugs is hepatotoxicity associated with isoniazid, rifampicin and pyrazinamide,3 which occurs in 3%–40% of TB patients.4–7 Among patients with TB, age over 35 years, female gender, elevated pre-treatment liver function tests, malnutrition and HIV infection increase the increased risk of hepatotoxicity.8
Peripheral neuropathy occurs in up to 40% of patients on anti-TB treatment9 and more frequently among TB/HIV-coinfected patients compared with HIV-uninfected individuals.10,11 Importantly, neuropathy among HIV-infected patients may have alternative causes including HIV infection itself, particularly among patients with low CD4 cell counts, and ART, especially nucleoside reverse transcriptase inhibitors.12 The high burden of toxicities among TB/HIV-coinfected patients10,11,13,14 may lead to treatment interruption and contribute to morbidity and mortality.15
Isoniazid-induced peripheral neuropathy is considered to be concentration dependent and occurs more frequently in slow metabolizers of the drug.16 Rifampicin-induced hepatotoxicity is also considered to be dose related.17,18 It is therefore important to optimize TB treatment to enable the attainment of adequate drug concentrations, while minimizing toxicities.
The correlation between blood concentrations of anti-TB drugs and the occurrence of toxicities in TB/HIV-coinfected patients has not been well elucidated. The aim of this study therefore was to determine the association between hepatotoxicity, peripheral neuropathy and serum concentrations of rifampicin and isoniazid given at the standard dose recommended by WHO guidelines.19
Patients and methods
Setting
We recruited TB/HIV-coinfected patients at the Infectious Diseases Institute (IDI) in Kampala, Uganda, which runs a large outpatient HIV clinic serving over 8000 persons living with HIV; ∼300 patients are diagnosed with TB each year.
Study design and population
This was a prospective observational study enrolling patients aged 18 years and above with new pulmonary TB. Pregnant women, patients with alanine transferase (ALT) >5 times the upper limit of normal (ULN), glomerular filtration rate (GFR) <50 mL/min and those with a history of TB in the past were excluded from the study.
Participants were started on anti-TB medication according to WHO recommendations which require 2 months (intensive phase) of rifampicin, isoniazid, pyrazinamide and ethambutol (RHZE) followed by 4 months (continuation phase) of rifampicin and isoniazid (HR), with dosages according to weight bands: three tablets of RHZE or HR if the patient’s weight is <55 kg, four tablets of RHZE or HR for weight ≥55 kg, and five tablets of RHZE or HR for weight ≥70 kg. Participants were on fixed-dose combinations where each tablet contained 150 mg rifampicin, 75 mg isoniazid, 400 mg pyrazinamide and 275 mg ethambutol. Combination antiretroviral treatment (cART) was started at least 2 weeks after initiation of anti-TB treatment and included zidovudine, lamivudine and efavirenz. Patients who were on nevirapine-based cART prior to starting TB treatment were switched to efavirenz.
Assessment of toxicities
Hepatotoxicity was defined as ALT ≥ 40 IU/L. The severity of hepatotoxicity was graded according to the National Institutes of Health Division of AIDS toxicity tables (DAIDS)20 as follows: ALT 40–119, mild/grade 1; ALT 120–199, moderate/grade 2; ALT >200, severe/grade/grade 3. ALT was measured at the Makerere University Johns Hopkins University (MUJHU) core laboratory, which is a College of American Pathologists (CAP)-certified laboratory. Participants were assessed for hepatotoxicity 2, 8 and 24 weeks after starting TB treatment or when they developed symptoms including vomiting, nausea, anorexia, abdominal pain or jaundice.
Peripheral neuropathy was assessed using a history of symptoms of peripheral neuropathy followed by evaluation for loss of vibration sensation at the malleolus graded from 0 to 3; 0 = vibration felt for >10 s (normal), 1 = vibration felt for 6–10 s (mild loss), 2 = vibration felt for <5 s (moderate loss), 3 = vibration not felt (severe loss). Tendon reflexes were tested and classified as absent, hypoactive, normal, hyperactive and hyperactive with clonus. Peripheral neuropathy was defined using variables from the AIDS Clinical Trial Group Brief Peripheral Neuropathy Screening Tool,21 as loss of vibration sensation in both limbs and/or abnormal tendon reflexes bilaterally; this was assessed at every study visit (weeks 2, 8 and 24).
All participants were given 25 mg pyridoxine to prevent isoniazid-induced peripheral neuropathy according to WHO TB treatment guidelines.19 Patients reporting worsening of peripheral neuropathy or new incidence of peripheral neuropathy were given a higher dose of pyridoxine.
Peripheral neuropathy and hepatotoxicity were reported as adverse events if they were not present at baseline or if there was worsening of pre-existing symptoms from baseline assessments.
Pharmacokinetic measurements
Study visits were conducted at weeks 2, 8 and 24 after initiation of anti-TB treatment. On each follow-up visit, blood sampling was performed on participants prior to drug dosing (0 h) and at 1, 2 and 4 h after witnessed dosing of anti-TB drugs and cART where applicable; participants were asked to fast for at least 8 h prior to drug dosing and were allowed to eat after the 2 h blood draw. Adherence counselling was performed at each follow-up visit and adherence was assessed using pill counts, visual analogue scale and by self-report using 7 day recall.
Blood samples were collected in rapid serum vacutainers and the serum separated by centrifuging within 1 h of the blood draw. Serum concentrations of rifampicin, ethambutol and isoniazid were measured in the Translational laboratory of the Infectious Diseases Institute in Kampala using ultraviolet high-performance liquid chromatography (UV-HPLC) (available as Supplementary data at JAC Online).
Ethics
Ethics approval was received from the Joint Clinical and Research Centre Institutional Review Board, the Uganda National Council for Science and Technology (reference number HS1303) and the National Drug Authority. Written informed consent was obtained from all study participants prior to enrolment. This study was registered at Clinicaltrials.gov (NCT01782950).
Statistical methods
Participants’ baseline characteristics were described as medians with the IQR. Maximum concentrations (Cmax) of anti-TB drugs were calculated as the highest concentration among the three blood draws (1, 2 and 4 h). The maximum concentrations were established for each visit (weeks 2, 8 and 24). The Cmax of participants with and without hepatotoxicity and peripheral neuropathy were compared using Wilcoxon rank-sum and Kruskal–Wallis test. Time-updated Cox regression adjusting for age, sex, CD4 cell count and BMI was used to determine the association between serum anti-TB drug concentrations and the occurrence of hepatotoxicity and peripheral neuropathy. The Cox regression was time updated for serum concentrations. The last serum concentration before the occurrence of hepatotoxicity was used in the Cox regression model. Patients with peripheral neuropathy at baseline were excluded from the Cox regression analysis unless there was worsening of the grading of vibration sensation. Patients with elevated ALT at baseline were included in the analysis if ALT levels increased further from the baseline value.
Results
Between May 2013 and November 2015, 268 TB/HIV-coinfected patients were enrolled. Fifty-eight percent were male with a median age of 34 (IQR 29–40) years. Almost half (48.5%) of the participants had peripheral neuropathy prior to starting TB treatment, while 15.7% had a grade 1 and grade 2 elevation of ALT (Table 1). One patient had diabetes mellitus. We found 22% of the patients were already on ART before initiation of TB treatment; however, there was no association between baseline ART status and the occurrence of hepatotoxicity (HR 1.32; 95% CI 0.33–5.31; P = 0.692) or peripheral neuropathy (HR 1.11; 95% CI 0.70–1.75; P = 0.651).
Table 1.
Baseline characteristics of TB/HIV-coinfected participants with pharmacokinetic data
| Characteristics | (N=268) |
|---|---|
| Male gender, n (%) | 155 (57.8) |
| Age in years, median (IQR) | 33.9 (29–40) |
| BMI (kg/m2) | |
| median (IQR) | 19.2 (17.7–21.7) |
| BMI <18; n (%) | 74 (27.6) |
| WHO stage, n (%) | |
| III | 233 (86.9) |
| IV | 22 (8.2) |
| CD4 counts | |
| all participants (median, IQR) | 172 (47–334) |
| <200 cells/mm3, n (%) | 120 (44.8) |
| <50 cells/mm3, n (%) | 55 (20.5) |
| ART regimen at baseline, n (%) | |
| NNRTI plus 2 NRTIs | 56 (20.9) |
| PI plus 2 NRTIs | 3 (1.11) |
| Baseline symptoms, n (%) | |
| peripheral neuropathy | 188 (70.15) |
| ALT >40–119 U/L (grade 1) | 39 (14.6) |
| ALT >120 U/L (grade 2) | 3 (1.1) |
Hepatotoxicity
The median time to developing hepatotoxicity was 16 days (IQR 13–55) after initiation of anti-TB treatment and the proportions of participants with mild, moderate and severe elevation of ALT over time are as shown in Table 2. Excluding patients who had an elevated ALT at baseline, 94 (67%) of 254 patients with a measurement during follow-up developed hepatotoxicity: 84 (33%) mild, 7 (3%) moderate and 3 (1%) severe hepatotoxicity. Although the proportion of participants with mild elevations of ALT increased over time, the proportion of patients with moderate and severe hepatotoxicity remained low.
Table 2.
Proportion of patients with hepatotoxicity at different time points
| Proportion of participants with hepatotoxicity n (%) |
|||
|---|---|---|---|
| Week 2 (N=252) | Week 8 (N=227) | Week 24 (N=199) | |
| Grade of hepatotoxicity, n (%) | |||
| none | 205 (81.4) | 179 (78.6) | 150 (78.38) |
| mild, grade 1 | 33 (13.1) | 40 (17.6) | 39 (19.6) |
| moderate, grade 2 | 4 (1.6) | 1 (0.44) | 2 (1.01) |
| severe, grade 3 | 2 (0.79) | 1 (0.44) | 0 |
| Invalid results | 8 (3.17) | 6 (2.64) | 8 (4.02) |
Participants with no hepatotoxicity had a rifampicin median Cmax of 6.57 (IQR 4.83–9.41) μg/mL, while those with mild, moderate and severe hepatotoxicity had a median Cmax of 7.39 (IQR 5.10–10.20) μg/mL, 7.00 (IQR 6.05–10.95) μg/mL and 3.86 (IQR 2.81–14.24) μg/mL, respectively. These mean Cmax values were below the recommended lower limit for rifampicin (8 μg/mL). There was no difference in the median Cmax of rifampicin among those who had hepatotoxicity and those who did not (P = 0.332) (Figure 1). Five participants (1.8%) experienced treatment interruption due to hepatotoxicity; only two of these had a median Cmax of rifampicin above the normal threshold.
Figure 1.
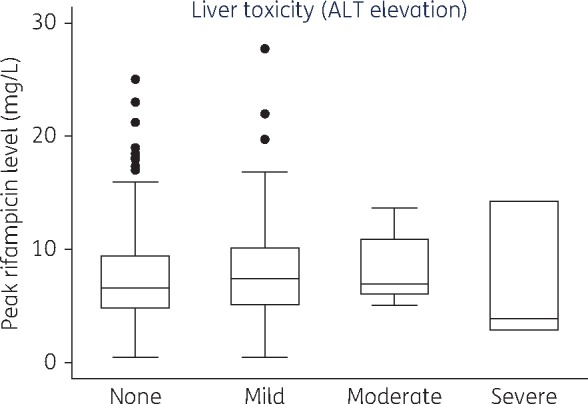
Association between rifampicin concentrations and grade of hepatotoxicity. Box plot showing rifampicin concentrations for each category of hepatotoxicity: the top of each box represents the 75th percentile (Q3), the bottom the 25th percentile (Q1), the horizontal line within each box represents the 50th percentile (median) rifampicin concentrations. The top whisker represents Q3 + (1.5×IQR) while the bottom represents Q1 – (1.5×IQR). The dots represent outliers.
We did not find any association between age, sex, BMI, CD4 cell count and rifampicin concentrations (Table 3). Figure 1 shows the maximum rifampicin concentrations among participants with different grades of hepatotoxicity.
Table 3.
Hepatotoxicity among TB/HIV-coinfected participants on TB treatment
| Unadjusted hazard ratio (HR) |
Adjusted hazard ratio (HR) |
|||||
|---|---|---|---|---|---|---|
| Characteristic | HR | 95% CI | P value | HR | 95% CI | P value |
| Age | 1.00 | 0.97–1.02 | 1.00 | 0.99 | 0.97–1.03 | 0.994 |
| BMI | 1.04 | 0.97–1.12 | 0.238 | 1.07 | 0.97–1.14 | 0.185 |
| Male sex | 0.97 | 0.59–1.61 | 0.926 | 1.01 | 0.65–1.95 | 0.673 |
| CD4 cell count | ||||||
| ≤250 cells/mm3 | 0.84 | 0.45–1.57 | 0.579 | 0.89 | 0.44–1.59 | 0.603 |
| >250 cells/mm3 | 0.66 | 0.38–1.21 | 0.178 | 0.51 | 0.35–1.18 | 0.045 |
| Rifampicin Cmax | 1.85 | 0.63–5.42 | 0.264 | 1.80 | 0.50–6.48 | 0.368 |
| Isoniazid Cmax | 1.06 | 0.37–3.06 | 0.911 | 0.65 | 0.18–2.29 | 0.499 |
There was also no association between the occurrence of hepatotoxicity and the Cmax of isoniazid (HR 0.65; 95% CI 0.18–2.29; P = 0.499).
Peripheral neuropathy
We found 188 (70.15%) patients had baseline peripheral neuropathy, 39 of whom had worsening symptoms during TB treatment. Peripheral neuropathy occurred after a median time of 28 days (IQR 14–58). Of the 79 (83.5%) patients who had no baseline peripheral neuropathy, 66 developed it during the course of TB treatment.
The proportion of participants with new or worsening peripheral neuropathy significantly decreased over time with 127 (58.26%), 84 (45.16%) and 43 (33.1%) of the participants experiencing toxicity at weeks 2, 8 and 24, respectively (P < 0.001).
Following Cox regression analysis, we did not find any significant association between the occurrence of new peripheral neuropathy and age, sex, BMI or CD4 count (Table 4). The median Cmax of isoniazid among participants with and without peripheral neuropathy were below the recommended lower limit (3 μg/mL); 2.34 (1.52–3.23) μg/mL and 2.21 (1.45–3.11) μg/mL, respectively. There was no association between the occurrence of peripheral neuropathy and isoniazid Cmax (HR 0.67; 95% CI 0.21–2.09; P = 0.49) (Table 4). Figure 2 shows the isoniazid concentrations stratified by the presence or absence of peripheral neuropathy. The dose of pyridoxine was increased up to 50 and 100 mg in 45.7% and 43.4% of the participants, respectively. None of the participants experienced treatment interruption due to peripheral neuropathy.
Table 4.
Peripheral neuropathy among patients with TB/HIV coinfection
| Unadjusted hazard ratio (HR) |
Adjusted hazard ratio (HR) |
|||||
|---|---|---|---|---|---|---|
| Characteristic | HR | 95% CI | P value | HR | 95% CI | P value |
| Age | 1.00 | 0.98–1.03 | 0.619 | 1.01 | 0.98–1.04 | 0.306 |
| BMI | 0.99 | 0.94–1.06 | 0.949 | 0.96 | 0.89–1.03 | 0.272 |
| Male sex | 0.70 | 0.47–1.05 | 0.090 | 0.57 | 0.33–0.96 | 0.033 |
| CD4 cell count | ||||||
| ≤250 cells/mm3 | 0.85 | 0.49–1.46 | 0.117 | 0.81 | 0.46–1.44 | 0.472 |
| >250 cells/mm3 | 0.90 | 0.54–1.52 | 0.698 | 0.91 | 0.53–1.57 | 0.748 |
| Isoniazid Cmax | 0.98 | 0.37–2.60 | 0.972 | 0.67 | 0.21–2.09 | 0.49 |
Figure 2.
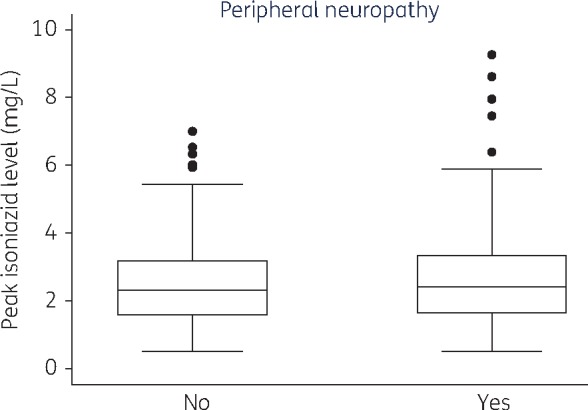
Association between isoniazid concentrations and presence of peripheral neuropathy. Box plot showing isoniazid concentrations for patients with and without peripheral neuropathy. Boxplot conventions are the same as in Figure 1.
Discussion
In this study among TB/HIV-coinfected individuals, we documented no correlation between rifampicin and isoniazid concentrations and common toxicities, in particular hepatotoxicity and peripheral neuropathy. Our findings were similar to findings by Jeong et al.6 in HIV-negative patients. In contrast, another study in HIV-negative patients by Satyraddi et al.8 found rifampicin concentrations on the seventh day of anti-TB drug treatment to be correlated with the onset of hepatotoxicity. This may be due to the difference in populations, time points where drug concentrations were measured or possibly because toxicities caused by anti-TB drugs may be due to hypersensitivity or idiosyncratic reactions,22 which may occur regardless of dose.
Several studies have described low concentrations of anti-TB drugs in patients with TB23,24 which may be attributed to factors such as malabsorption25 and drug–drug interactions.2 In view of the low concentrations of rifampicin in many populations, higher doses of rifampicin are being evaluated to improve treatment outcomes. There is some evidence that high doses of rifampicin are tolerable and not associated with a significant increase in hepatotoxicity;5 however, there is insufficient evidence of this among TB/HIV-coinfected populations.
We found a low prevalence (<2%) of moderate and severe hepatotoxicity unlike previous studies in predominantly HIV-infected participants where a higher prevalence of 12%–20%26,27 was found. This variation could be attributed to difference in study designs; some of these studies were retrospective, and differed in their study populations which included hospitalized patients. Less than 2% of our participants required rifampicin treatment interruption which is consistent with other studies.5,28 Similar to studies in HIV-infected populations,27 we observed hepatotoxicity occurring earlier (16 days) than reported in HIV-negative individuals6 where the median time between initiation of anti-TB treatment and onset of hepatotoxicity was 41 days.
A high proportion (30%–50%) of participants experienced new or worsening peripheral neuropathy even though isoniazid concentrations were similar in patients who developed new or worsening peripheral neuropathy and those who did not. HIV infection itself is a risk factor for peripheral neuropathy regardless of ART status particularly among those with a low CD4 cell count.12 In our study, the mean CD4 cell count was <200 cells/mm3 in 44.8% of the participants. We found, however, no association between CD4 cell count and peripheral neuropathy. The proportion of participants with peripheral neuropathy decreased over time. We believe that increasing the dose of pyridoxine, which occurred in over 80% of the participants, may have contributed to this. There was no treatment interruption even while the participants were on isoniazid, implying that isoniazid was generally well tolerated. Isoniazid-induced peripheral neuropathy is thought to be dose dependent; in addition, patients who are slow metabolizers of isoniazid have been found to have higher isoniazid concentrations and are more likely to develop peripheral neuropathy.29,30 In this TB/HIV-coinfected population, we found no association between isoniazid concentrations and the occurrence of peripheral neuropathy.
The strength of our study is the large sample size, combined with drug concentrations being measured at several time points over the course of TB treatment. We also recognize that our study has some limitations; our participants were on four different anti-TB drugs plus efavirenz, which may also cause hepatotoxicity, making it difficult to ascertain which drug caused the toxicities. There are also other causes of peripheral neuropathy which were difficult to assess, including exposure to neurotoxic agents. Due to the limited number of time points after drug ingestion at which drug concentrations were measured, we were unable to determine whether these toxicities are associated with AUC0–12 which is a better measure of drug exposure. Concentrations after 2 h are commonly used to estimate Cmax for isoniazid and rifampicin but this is an inaccurate estimate due to the variability of absorption (fast versus slow absorbers), and therefore blood samples after 1 and 4 h were also used in this study to obtain a better estimate.
In conclusion, we found no association between drug concentrations and rifampicin- or isoniazid-related toxicities, in particular hepatotoxicity and peripheral neuropathy, among TB/HIV-coinfected patients using the currently recommended doses.
Supplementary Material
Acknowledgements
We acknowledge the contributions of the staff and management of the Infectious Diseases Institute and University of Zurich.
Funding
This study was funded by the collaboration between the Infectious Diseases Institute Makerere University and the University of Zurich supported by Abbvie, Bristol Myers Squibb, Gilead Sciences, Janssen, Lunge Zürich, Merck, Shimadzu, Swiss HIV Cohort Study and ViiV Healthcare.
Support for writing this manuscript was provided by Fogarty International Center, National Institutes of Health (grant #D43TW009771). C. S.-W. receives PhD support from Medical Education for Equitable Services to All Ugandans, a Medical Education Partnership Initiative (grant #5R24TW008886) from the Office of Global AIDS Coordinator and the US Department of Health and Human Services, Health Resources and Services Administration and National Institutes of Health.
Transparency declarations
The authors have no conflict of interest to declare. The funders had no role in the study conceptualization, design or writing of this manuscript.
Author contributions
This study was conceptualized by J. F., N. C., A. K., B. C., M. L. and Y. C. M. C. S.-W. wrote this manuscript under the supervision of M. R. K., Y. C. M., B. C. and P. B.-K. A. vB., C. S.-W., A. B., D. M. and U. G. contributed to the data collection. A. U. S. and B. L. performed the data analysis. All authors read and approved the final version of this paper.
Supplementary data
Additional detail of the UV HPLC methods is available as Supplementary data at JAC Online (http://jac.oxfordjournals.org/).
References
- 1. WHO. Global Tuberculosis Report 2016 http://www.who.int/tb/publications/global_report/en/.
- 2. Arbex MA, Varella Mde C, Siqueira HR. et al. Antituberculosis drugs: drug interactions, adverse effects, and use in special situations. Part 1: first-line drugs. J Bras Pneumol 2010; 36: 626–40. [DOI] [PubMed] [Google Scholar]
- 3. Girling DJ. The hepatic toxicity of antituberculosis regimens containing isoniazid, rifampicin and pyrazinamide. Tubercle 1978; 59: 13–32. [DOI] [PubMed] [Google Scholar]
- 4. Dworkin MS, Adams MR, Cohn DL. et al. Factors that complicate the treatment of tuberculosis in HIV-infected patients. J Acquir Immune Defic Syndr 2005; 39: 464–70. [DOI] [PubMed] [Google Scholar]
- 5. Ruslami R, Nijland HM, Alisjahbana B. et al. Pharmacokinetics and tolerability of a higher rifampin dose versus the standard dose in pulmonary tuberculosis patients. Antimicrob Agents Chemother 2007; 51: 2546–51. [DOI] [PMC free article] [PubMed] [Google Scholar]
- 6. Jeong I, Park JS.. Drug-induced hepatotoxicity of anti-tuberculosis drugs and their serum levels. J Korean Med Sci 2015; 30: 167–72. [DOI] [PMC free article] [PubMed] [Google Scholar]
- 7. Steele MA, Burk RF, DesPrez RM.. Toxic hepatitis with isoniazid and rifampin. A meta-analysis. Chest 1991; 99: 465–71. [DOI] [PubMed] [Google Scholar]
- 8. Satyaraddi A, Velpandian T, Sharma SK. et al. Correlation of plasma anti-tuberculosis drug levels with subsequent development of hepatotoxicity. Int J Tuberc Lung Dis 2014; 18: 188–95. [DOI] [PubMed] [Google Scholar]
- 9. van der Watt JJ, Harrison TB, Benatar M. et al. Polyneuropathy, anti-tuberculosis treatment and the role of pyridoxine in the HIV/AIDS era: a systematic review. Int J Tuberc Lung Dis 2011; 15: 722–8. [DOI] [PubMed] [Google Scholar]
- 10. Breen RA, Miller RF, Gorsuch T. et al. Adverse events and treatment interruption in tuberculosis patients with and without HIV co-infection. Thorax 2006; 61: 791–4. [DOI] [PMC free article] [PubMed] [Google Scholar]
- 11. Marks DJ, Dheda K, Dawson R. et al. Adverse events to antituberculosis therapy: influence of HIV and antiretroviral drugs. Int J STD AIDS 2009; 20: 339–45. [DOI] [PubMed] [Google Scholar]
- 12. Schifitto G, McDermott MP, McArthur JC. et al. Incidence of and risk factors for HIV-associated distal sensory polyneuropathy. Neurology 2002; 58: 1764–8. [DOI] [PubMed] [Google Scholar]
- 13. Yee D, Valiquette C, Pelletier M. et al. Incidence of serious side effects from first-line antituberculosis drugs among patients treated for active tuberculosis. Am J Respir Crit Care Med 2003; 167: 1472–7. [DOI] [PubMed] [Google Scholar]
- 14. Gort A, Falguera M, Schoenenberger JA.. Rifampicin toxicity in HIV-infected patients: a study of its incidence and the risk factors. An Med Interna 1997; 14: 559–64. [PubMed] [Google Scholar]
- 15. Shang P, Xia Y, Liu F. et al. Incidence, clinical features and impact on anti-tuberculosis treatment of anti-tuberculosis drug induced liver injury @ATLI# in China. PLoS One 2011; 6: e21836.. [DOI] [PMC free article] [PubMed] [Google Scholar]
- 16. Krishnamurthy DV, Selkon JB, Ramachandran K. et al. Effect of pyridoxine on vitamin B6 concentrations and glutamic-oxaloacetic transaminase activity in whole blood of tuberculous patients receiving high-dosage isoniazid. Bull World Health Organ 1967; 36: 853–70. [PMC free article] [PubMed] [Google Scholar]
- 17. Alsultan A, Peloquin CA.. Therapeutic drug monitoring in the treatment of tuberculosis: an update. Drugs 2014; 74: 839–54. [DOI] [PubMed] [Google Scholar]
- 18. Burman WJ, Gallicano K, Peloquin C.. Comparative pharmacokinetics and pharmacodynamics of the rifamycin antibacterials. Clin Pharmacokinet 2001; 40: 327–41. [DOI] [PubMed] [Google Scholar]
- 19. WHO. Treatment of Tuberculosis: Guidelines for National Programmes, 4th edn. 2010.
- 20.DAIDS. Division of AIDS Table for Grading the Severity of Adult and Pediatric Adverse Events. Bethseda, MD, USA: DAIDS, 2004.
- 21. Cherry CL, Wesselingh SL, Lal L. et al. Evaluation of a clinical screening tool for HIV-associated sensory neuropathies. Neurology 2005; 65: 1778–81. [DOI] [PubMed] [Google Scholar]
- 22. Ramappa V, Aithal GP.. Hepatotoxicity related to anti-tuberculosis drugs: mechanisms and management. J Clin Exp Hepatol 2013; 3: 37–49. [DOI] [PMC free article] [PubMed] [Google Scholar]
- 23. Gengiah TN, Botha JH, Soowamber D. et al. Low rifampicin concentrations in tuberculosis patients with HIV infection. J Infect Dev Ctries 2014; 8: 987–93. [DOI] [PubMed] [Google Scholar]
- 24. Chideya S, Winston CA, Peloquin CA. et al. Isoniazid, rifampin, ethambutol, and pyrazinamide pharmacokinetics and treatment outcomes among a predominantly HIV-infected cohort of adults with tuberculosis from Botswana. Clin Infect Dis 2009; 48: 1685–94. [DOI] [PMC free article] [PubMed] [Google Scholar]
- 25. Peloquin CA, MacPhee AA, Berning SE.. Malabsorption of antimycobacterial medications. N Engl J Med 1993; 329: 1122–3. [DOI] [PubMed] [Google Scholar]
- 26. Schutz C, Ismail Z, Proxenos CJ. et al. Burden of antituberculosis and antiretroviral drug-induced liver injury at a secondary hospital in South Africa. S Afr Med J 2012; 102: 506–11. [DOI] [PMC free article] [PubMed] [Google Scholar]
- 27. Hassen Ali A, Belachew T, Yami A. et al. Anti-tuberculosis drug induced hepatotoxicity among TB/HIV co-infected patients at Jimma University Hospital, Ethiopia: nested case–control study. PLoS One 2013; 8: e64622.. [DOI] [PMC free article] [PubMed] [Google Scholar]
- 28. Long MW, Snider DE Jr, Farer LS.. US Public Health Service Cooperative trial of three rifampin-isoniazid regimens in treatment of pulmonary tuberculosis. Am Rev Resp Dis 1979; 119: 879–94. [DOI] [PubMed] [Google Scholar]
- 29. Devadatta S, Gangadharam PR, Andrews RH. et al. Peripheral neuritis due to isoniazid. Bull World Health Organ 1960; 23: 587–98. [PMC free article] [PubMed] [Google Scholar]
- 30. Preziosi P. Isoniazid: metabolic aspects and toxicological correlates. Curr Drug Metab 2007; 8: 839–51. [DOI] [PubMed] [Google Scholar]
Associated Data
This section collects any data citations, data availability statements, or supplementary materials included in this article.