Abstract
One of the key processes in living organisms is mass transport occurring from blood vessels to tissues for supplying tissues with oxygen, nutrients, drugs, immune cells, and - in the reverse direction - transport of waste products of cell metabolism to blood vessels. The mass exchange from blood vessels to tissue and vice versa occurs through blood vessel walls. This vital process has been investigated experimentally over centuries, and also in the last decades by the use of computational methods. Due to geometrical and functional complexity and heterogeneity of capillary systems, it is however not feasible to model in silico individual capillaries (including transport through the walls and coupling to tissue) within whole organ models. Hence, there is a need for simplified and robust computational models that address mass transport in capillary-tissue systems. We here introduce a smeared modeling concept for gradient-driven mass transport and formulate a new composite smeared finite element (CSFE). The transport from capillary system is first smeared to continuous mass sources within tissue, under the assumption of uniform concentration within capillaries. Here, the fundamental relation between capillary surface area and volumetric fraction is derived as the basis for modeling transport through capillary walls. Further, we formulate the CSFE which relies on the transformation of the one-dimensional (1D) constitutive relations (for transport within capillaries) into the continuum form expressed by Darcy’s and diffusion tensors. The introduced CSFE is composed of two volumetric parts - capillary and tissue domains, and has four nodal degrees of freedom (DOF): pressure and concentration for each of the two domains. The domains are coupled by connectivity elements at each node. The fictitious connectivity elements take into account the surface area of capillary walls which belongs to each node, as well as the wall material properties (permeability and partitioning). The overall FE model contains geometrical and material characteristics of the entire capillary-tissue system, with physiologically measurable parameters assigned to each FE node within the model. The smeared concept is implemented into our implicit-iterative FE scheme and into FE package PAK. The first three examples illustrate accuracy of the CSFE element, while the liver and pancreas models demonstrate robustness of the introduced methodology and its applicability to real physiological conditions.
Keywords: diffusion, convection, partitioning, biological tissue, capillary system, smeared model, composite smeared finite element
1. Introduction
Delivery of nutrients, oxygen, drugs, and immune cells to tissues in the body from the blood circulation happens through mass transport across blood vessel walls into tissues. This problem of mass transport through systemic circulation, and its applicability to drug delivery and nanomedicine, is studied in the field of transport oncophysics [1–3]. From a physics perspective, transport of particulates within fluids is determined by gradients. In particular, two processes dominate gradient-driven transport through blood circulation: convection, driven by a pressure gradient, and diffusion, driven by a concentration gradient. According to the physical and chemical properties of moieties and particles in circulation, one of the two may play a dominant role [4, 5]. The subject of our study is the gradient-driven transport as governed by the laws of physics. In this section we give a broad introduction of the characteristics of blood vessel/tissue systems in order to highlight complexity of transport within a biological system. We also emphasize the importance of developing simplified and robust computational approaches that adequately incorporate the main parameters of transport processes.
Blood represents the main fluid in living organisms, being the medium that transports oxygen and nutrients to cells. In the reverse direction, blood supports the function of the lymphatic system of clearing waste and other products of metabolism. In the blood vessel network, two parts are distinct: arterial - for transport toward the tissue, and venous – for transport in the reverse direction. The vessels contain blood which represents the fluid domain. Tissue is composed of cells and extracellular space and can be considered as a porous solid. Both cells and extracellular space are filled with biological fluid. The blood and tissue domains are separated by vessel walls.
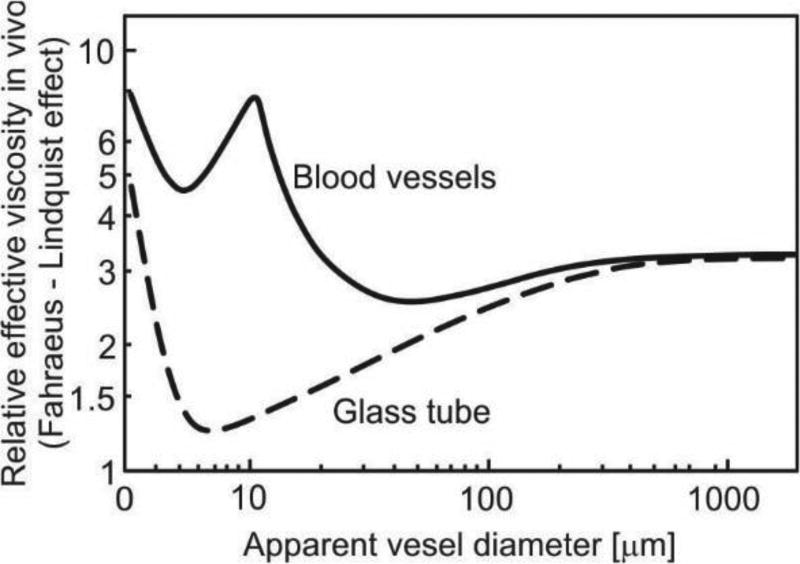
Transport of particles and molecules from the blood to tissue and from tissue back to blood is a complex process. We here refer to basic data about capillary vessels and models for flow within blood vessels and tissue. Regarding transport within vessels, some simplifications are necessary to develop models suitable for general applications. First, blood flow in large vessels may be taken as flow of a homogenous incompressible fluid with certain viscosity properties [6]. There, particle and molecule transport is governed by convection and diffusion within the fluid. In small vessels such as capillaries (diameter size of order of 10 micrometers for human [7]), the presence of cells, first of all red blood cells (RBCs), may affect transport [8]. However, in a simplified analysis, blood may still be considered as a homogenous fluid, where the effect of RBC is accounted for through viscosity [9, 10]. The dependence of the viscosity coefficient on the hematocrit (RBC volumetric content) and capillary diameter (known as the Fahraeus-Linquist effect) has been investigated numerically and in numerous experiments [11–13], Fig. 1.
Fig. 1.
Dependence of apparent relative viscosity (relative to blood plasma) on microvessel diameter; solid line is for blood vessels in vivo measurement on rat mesentery, dashed line is for glass tube. Figure is taken from [13].
Transport within tumors has additional complexities due to irregular blood vessel branching and variability of vessel diameters and lengths [14, 15]. Experimental investigations of flow within tumor vasculature showed that blood flow depends on several parameters such geometric resistance [16] (a measure of network irregularities), viscous resistance [17], and RBC mechanical properties [18]. A summary of basic characteristics for blood flow within tumor vasculature is presented in [19], whereas in [20] are given data about capillary wall transport parameters: vascular permeability, hydraulic conductivity, and reflection coefficient.
Transport within tissue has also been the subject of extensive study over the past decades (e.g. within brain tissue [21]). A porous medium is a good representation of organ tissue, which is composed of dispersed cells embedded in the extracellular matrix where nutrients or drugs can penetrate to reach cells within the tissue. Transport within the extravascular space is governed by both convection and diffusion. According to experimental in vitro and in vivo data [22], tissue glycosaminoglycan content and drug molecular weight are important parameters which determine whether extravascular transport is governed by diffusion or convection. A review of models used for convection and diffusion (including also heat transfer) is presented in [23], while diffusivity of dextran molecules in tumor interstitium is experimentally evaluated in [24, 25].
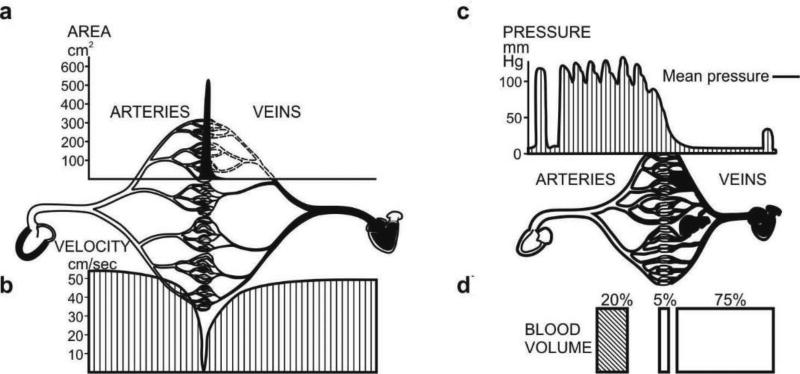
The overall transport from blood to tissue and vice-versa is conditioned by the blood vessel properties. These properties include hydraulic and diffusive components. In order to gain insight into the [blood vessel]-[vessel wall]-[tissue] system, Fig. 2 shows cross-sectional area, velocity, pressure and blood volume distributions in the blood vessel system of a dog [26]. It can be seen that there are differences of order of magnitude in the distribution of cross-sectional area, blood velocities, pressure and volumetric fraction, in the three main domains of the cardiovascular system (arteries, veins and capillaries). These physical characteristics are fundamental for transport within the cardiovascular system. When studying transport through vessel walls, the striking fact is that practically the entire blood vessel wall surface area belongs to capillaries. This follows form Fig. 2a: for a straight circular vessel, the wall surface area is proportional to the cross-sectional area, with coefficient of proportionality of 4/d (d being the vessel diameter) [26]. Therefore, in studying supply of nutrients or drugs to cells within tissues, it is essential to achieve the desired transport through capillary walls, as they constitute a major biological barrier to gradient-driven transport. This aspect of mass transport will be further addressed in detail later in the text.
Fig. 2.
Characteristics of cardiovascular system of a 13kg dog. a) Cross-sectional area of blood vessel for arteries, veins and capillaries; b) Velocity distribution; c) Pressure distribution; d) Blood volume in arteries, veins and capillaries. Figure taken from [26].
Regarding computational methods and models for blood flow within networks of vessels, the most commonly used is the “network” method [27], where the network is represented by blood vessel segments with common edges (nodes). Pressure change along segments is governed by the Hagen-Poiseuille law [28], while pressure is equal for all segments at the common node, and the total flux at interior nodes is equal to zero. Particle diffusion is modeled according to Fick’s law within moving fluid in pipe conditions. A short review of the basic equations is given in Section 2.1.
For mass transport within tissue as a porous continuum filled with fluid, the governing laws are the Darcy velocity-pressure relationship for convection and Fick’s law for diffusion [29]. For tissue as an inhomogeneous composite medium, the equivalent material parameters for modeling need to be determined experimentally or numerically. Some of the numerical procedures will be outlined further in the text.
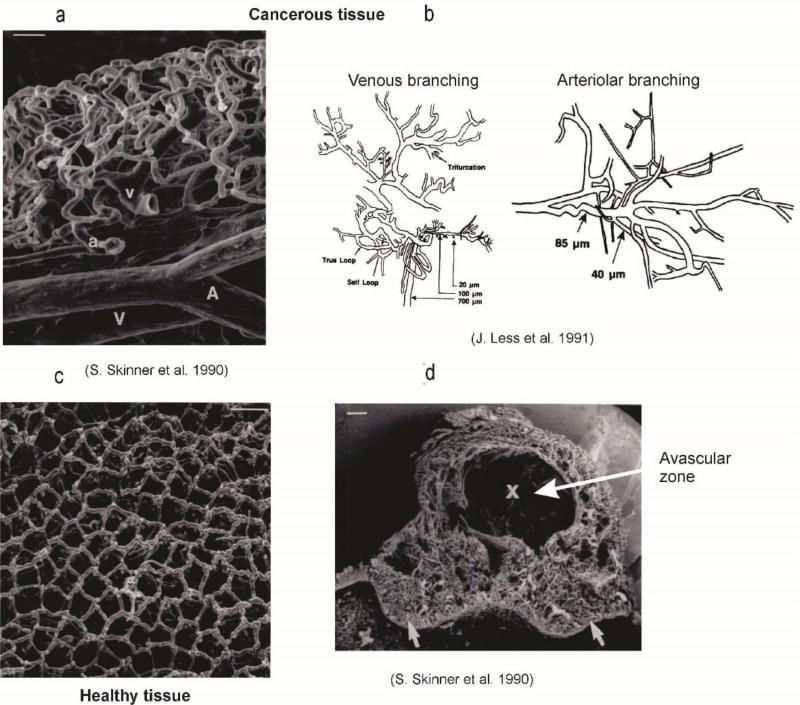
Finally, in this overview of the basic data relevant for the gradient-driven transport within vasculature and tissue, Figure 3 illustrates the complexity of capillary beds [14, 30]. It is obvious that, only for small regions, is it feasible to include each capillary in a computational model. The number of capillaries is enormous (total number of capillaries in the body is ~ billions [31]), and their morphology is complex and variable over space and samples.
Fig. 3.
Capillary bed geometry for cancerous tissue, according to [30] and [32].
We here introduce a smeared modeling approach for large domains which can effectively be used for transport in the capillary system and tissue. In Section 2 are summarized the basic concepts and equations for finite element (FE) modeling of capillary-tissue system. These equations are used in Section 3, where the smeared modeling concept for capillary network and further composite smeared finite element are introduced. Subsequently, Section 4 presents numerical results where accuracy of smeared modeling is investigated. Later, smeared models are applied to simulate and investigate transport within liver and pancreas. Section 5 is devoted to a summary of the developed methodology and concluding remarks on the smeared models applicability.
2. Basic equations for modeling transport in blood vessels and tissue
Here, we summarize the methodology which will be further used as the basis for the development of the smeared models. This methodology relies mainly on our previous publications.
2.1 Large vessels
When considering blood as a homogenous viscous incompressible fluid, the flow in large vessels can be described by the Navier-Stokes equations of balance of linear momentum, and by incompressibility equation as the mass balance equation. These equations can be further transformed into FE balance equations [29]. But, for practical applications in modeling a blood vessel system coupled with tissue, a simplification from 3D to 1D flow can be adopted. Then the pipe Hagen-Poiseuille law can be used and the corresponding one-dimensional FE equations of balance can be derived [28], [33]. For a current time step of size Δt and iteration i, and in case of deformable vessel walls, these equations can be written as
| (1) |
where the matrix components (corresponding to iteration (i−1)) are:
| (2) |
Here, and are coefficients depending on material properties of fluid and solid wall, pipe cross-sectional diameter and thickness, and the current fluid flux and velocity within the element; kp is the pipe conductance coefficient[28]; the cross-sectional area is A and the element length is L; P is vector of nodal pressures, Q is the nodal flux vector which includes external and flux from other elements, and NI are the interpolation functions. In case of rigid walls, equation (1) reduces to a linear incremental form,
| (3) |
The matrix components are
| (4) |
where
| (5) |
and d and μ are the pipe internal diameter and viscosity coefficient, respectively. Therefore, for given boundary conditions, the above equations provide solutions for nodal pressures (and consequently for fluxes and velocities). With the assumption that deformation of pipe does not affect the flow, except thorough change of the radius due to pressure, equation (3) can be used for deformable pipe wall, but with change of the radius according to the relation [28]:
| (6) |
where R0 is the initial radius of the cross-section, δ is the wall thickness (taken to be constant), E is Young’s modulus, ν is Poisson’s ratio, and p is fluid pressure. This relation is applicable when wall thickness is small with respect to the radius (the wall can be considered as a cylindrical thin membrane), when axial deformation is negligible (physiologically verified condition for blood vessels) and the wall material is elastic. Equations (1) and (3) are applicable to pipe network in 2D and 3D space, with any branching within the network, and are computationally efficient since the nodal unknowns are the pressures only [28].
One-dimensional particle convective-diffusion transport is governed by the balance equation
| (7) |
where c is concentration, v is fluid velocity, and q is a source term. Diffusion coefficient Dp may be constant or may be concentration-dependent. The corresponding FE balance equation is
| (8) |
where C is the nodal concentration vector, is the external flux, and matrices and the source vector (evaluated at end of time step) are:
| (9) |
Note that the fluid velocity follows from solving fluid transport equations (1) or (3).
2.2 Tissue modeling
Convective and diffusive transport within tissue, which is considered as a porous continuum, can be described by incremental-iterative FE systems of equations, which rely on Darcy’s and Fick’s laws. The final balance equations for fluid flow can be written in the form (3) in terms of the fluid pressure, where the matrix Kp is
| (10) |
and kDi are the Darcy coefficients.
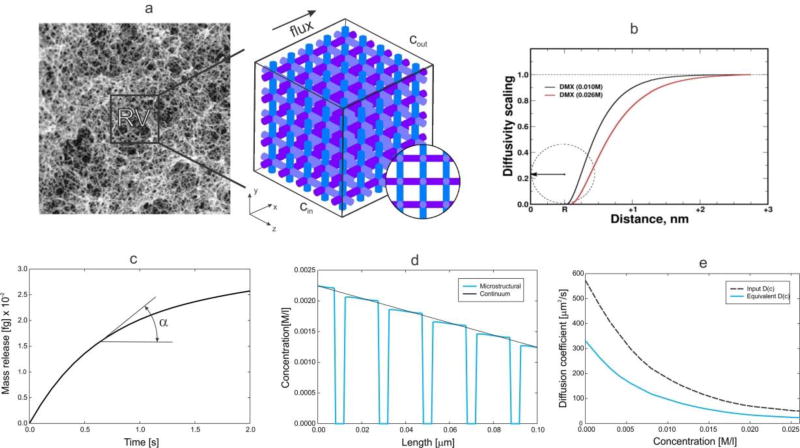
When complex composition of tissue is considered with cells and extracellular space, the equivalent Darcy coefficients can be obtained numerically by our developed homogenization procedure for mass transport [34]. Then, a reference domain can be selected and a detailed FE model generated (as in Fig. 4), so that the equivalent Darcy coefficient k̅Dx in a direction x can be expressed as
| (11) |
where Qx is the flux through the model surface A, Pin and Pout are the inlet and the outlet pressures, and Lx is the model (reference volume RV) length. It was shown that the equivalent Darcy coefficient does not depend on the model size and values of the inlet and outlet pressures and that it, therefore, represents the material parameter for the given tissue microstructural composition.
Fig. 4.
Evaluation of equivalent diffusion coefficient for tissue by numerical homogenization. (a) Extracellular fibrous space of skin [39] and simplified model of reference volume (RV) used for computational model; (b) Scaling function for doxorubicin molecule interacting with tissue; (c) Mass release curve used as the constitutive curve for diffusive transport; (d) Concentration distribution along a line (aligned with the flux direction) of the RV at a time t=0.1s, for the detailed (true) and equivalent model; (e) Diffusion coefficient for free diffusion in the liquid (Dbulk) and equivalent diffusion coefficient in terms of concentration.
Diffusive transport in tissue can be described by using the Fick law as for 1D, and mass balance equation. The balance equation (7) now is [29]
| (12) |
where vi are the velocity components and Di are diffusion coefficients for the coordinate directions. The balance FE equations have the form (8), with the matrices:
| (13) |
In case of diffusive transport through complex porous media, we have introduced mass release curves as the constitutive curves for diffusion [34, 35]. These curves can be determined experimentally or numerically. For a given gradient, the diffusion coefficient for a direction xi can be determined from the curve, as
| (14) |
where m(t) is mass per unit area of surface with normal xi, and dc/dxi = tanα is the tangent to the curve (Fig. 4(c)). The role of the mass release curves in modeling diffusion within porous media with any microstructural geometry, and with including physico-chemical interaction between transported particles (molecules) and surface of the microstructure, has been employed in [36] [37] [38] [34]; while in [35] this role has been investigated in detail. The example shown in Fig. 4 demonstrates practical calculation of the equivalent diffusion coefficient according to [35] in case of a complex microstructure, nonlinear diffusion coefficient for free diffusion within the extracellular space, and surface interactions according to the scaling functions in Fig. 4 (b) [36].
2.3 Transport through capillary walls
In the transport from fluid to solid domain, i.e. from blood vessels to tissue (and in the reverse direction), it is necessary to properly model transport through blood vessel walls. To achieve that, connectivity or fictitious elements were introduced in [33]. A schematic of the connectivity elements is shown in Fig. 5. Pipe is modeled by 1D, and continuum by 2D or 3D finite elements. The connectivity 1D element has two nodes at the same spatial position, A – pipe node, and B – continuum node.
Fig. 5.
Schematics of the connection (fictitious) elements between pipe (blood vessel) and continuum (tissue). (a) Capillary with plasma domain and porous wall, and surrounding tissue; (b) Pipe node A belongs to pipe and B belongs to tissue, while occupying the same spatial position.
The balance equation for convective (hydraulic-fluid) flow for the fictitious element has the form (3),
| (15) |
where
| (16) |
Here, kh is the hydraulic permeability coefficient, and Ap is the surface area of the pipe internal surface belonging to the connectivity element node (in case of a straight pipe as shown in Fig. 4, Ap = Lπd where L is the length of pipe element - assuming the same element lengths on both sides of the node, and d is pipe internal diameter).
Considering the diffusive transport through the wall, a 1D approximation for radial diffusion can be used, since the vessel wall is small with respect to the vessel radius. Then, we use equation (7) and obtain the FE balance equation of the form (8), where, with linear interpolation along the element, the matrices are:
| (17) |
Here, Dwall is the diffusive wall transport coefficient, h is the wall thickness; and P1 and P2 are pressures in the pipe and tissue, respectively. Note that the Dwall represents the overall transport coefficient of the wall (with pores, fenestrations, etc.); it can be related to the diffusion coefficient of the wall porous material coefficient Dmaterial as Dwall = h Dmaterial. Also, if the thickness is small with respect to the pipe diameter, as it is the case for capillaries, the transient terms can be neglected, and therefore the matrix Mc discarded.
Partitioning, as a frequent measure of hydrophobicity in case of molecule redistribution between water and oil phases, can be included in the connectivity element, according to the FE formulation in [35]. Then, the corresponding factorization of the matrices (17) by the partitioning coefficient has to be implemented, enabling simulations of mass distribution against classical Fickian gradients; such situations are quite common in drug and cell transport.
3. Formulation of the smeared finite element
Generally, smeared procedures have been applied for crack distribution within materials in fracture mechanics studies, or for material properties of complex materials (e.g. [40, 41]). Following that smeared approach, we adopt here that the basic requirement of the smeared concept for modeling transport within the capillary-tissue system, is that the transport characteristics of the system should appropriately be preserved in the smeared model. A specific case is considered first, where it is assumed that concentration within capillaries is uniform and changes over time. Subsequently, we present a formulation of a composed smeared finite element (CSFE) for general cases of fluid and particle transport.
3.1 Smeared model for a uniform concentration within capillaries
Here, we assume that concentration within capillaries is uniform and given as the systemic concentration Csys(t) function of time. This assumption can be taken as a reasonable approximation when considering a small tissue domain, e.g. a tumor, because convection within capillaries is much faster process than the convection-diffusion within tissue.
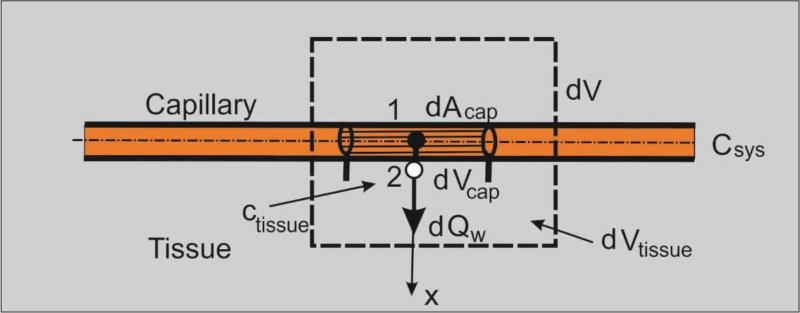
Let us consider diffusion through a capillary wall (neglecting convection through the wall, which in reality is small) as schematically shown in Fig. 6. First, the elementary area of the surface of the internal wall dAcap can be related to the elementary volume dVcap and further to the elementary total volume dV, as follows:
| (18) |
where rAV is the capillary area-to volume ratio (called further surface ratio), and rV is the capillary volumetric ratio within tissue, or capillary density; the volume of tissue is (1−rv)dV. Note that in case of a straight capillary, the surface ratio is
| (19) |
where dcap is the capillary internal diameter; in case of complex geometries rAV can be different. We emphasize that the capillary density is the ratio between the volume occupied by the fluid (blood) and total volume. The above ratios are parameters of the capillary bed. The expression (18) can be considered as the most fundamental in our smeared models, where the discrete wall surface is smeared over volume of the continuum.
Fig. 6.
Diffusion from capillary to tissue through elementary capillary wall surface dAcap which corresponds to the capillary volume dVcap and total volume dV; dVtissue is the volume occupied by tissue.
Next, we adopt that the mass concentration is linearly distributed through the wall thickness (between points 1 and 2 in Fig. 6), which is acceptable for thin capillary walls; this is in accordance with equations (7) and (8). Then, the flux through the wall at point 2, corresponding to the elementary surface dAcap, can be expressed as
| (20) |
where
| (21) |
and Csys, , Ctissue, are the systemic (capillary) and tissue concentrations at the end and start of time step, respectively. As mentioned in Section 2, for small thickness (which is the case of capillary walls), the terms corresponding to transient effects (the matrix M) can be neglected. Note that the elementary flux is expressed in terms of the elementary volume of the continuum dV.
As a result, we have now the tissue continuum within which capillaries are distributed and are producing the source of the mass according to (20). Therefore, the nodal fluxes of a continuum finite element are
| (22) |
where terms within the parenthesis (…) follow from (20) and (21), and NI are the continuum interpolation functions of the element with the volume V. When evaluating the integral (22), concentration Ctissue is the current concentration within tissue at an integration point. Note that the factor (1−rV) is used since the volume of tissue is reduced due to presence of capillaries.
In case when partitioning phenomenon is present at the wall surfaces, the elementary mass flux can be expressed as
| (23) |
where P1 and P2 are the partitioning coefficients at the internal and external capillary wall surfaces.
Instead of using source terms at FE integration points, fictitious elements can be assigned at each continuum node. Then, the balance equation for the fictitious element at continuum node I can be written as
| (24) |
where
| (25) |
and CI and are concentrations at node I at end and start of time step, respectively. Also, P1 and P2 are partitioning coefficients as in (23); D(wall)I is the wall diffusion coefficient, hI is the wall thickness at node I; and AcapI is the wall surface area belonging to the node I, which is
| (26) |
with (rV)I, (rAV)I and VI being the volumetric ratio, the area coefficient and the volume of the continuum which belongs to the node, respectively. The volume VI can be numerically evaluated as
| (27) |
where summation includes all elements containing the node I. Note that using eq. (24) we have included transport from capillaries to the tissue via addition of the equation (24) to the system of equations without increasing number of equations of the system. We found that convergence was improved by applying the concept of these fictitious elements instead of continuously distributed source terms.
In summary, it can be concluded that diffusive transport between capillaries and tissue can be performed by discretizing the continuum (tissue) only. The parameters of the model, assigned to each continuum node I include geometrical data (the volumetric ratio of capillaries (rV)I, the surface ratio (rAV)I, the wall thickness hI) and material data of capillaries consisting of wall diffusion coefficient (Dwall)I and partition coefficients P1I and P2I at the capillary surfaces. This way of specifying the modal data offers a possibility of modeling heterogeneous properties of the domain, which is important for practical applications. Accuracy of this smeared model will be demonstrated in the next section (Example 1).
3.2 Composite Smeared Finite Element (CSFE)
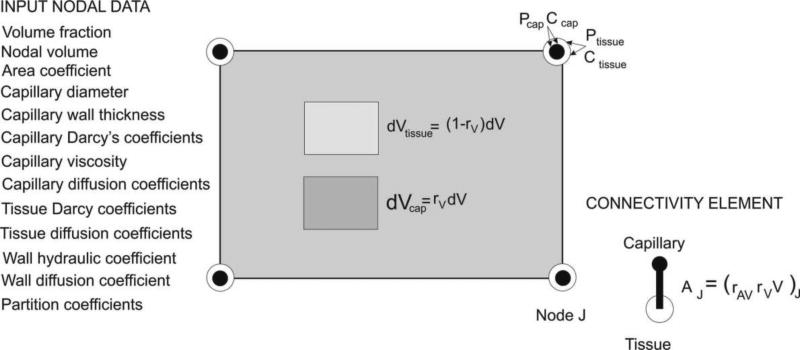
As in the above case, we have two domains – capillary and tissue, but now a general case is considered when pressure (and velocity) and concentration within capillaries are not uniform. The elementary volumes occupied by the domains within the finite element at a considered (integration) point are: rVdV for the capillary and (1−rV)dV for the tissue domain. There are four physical fields within the element: pressure and concentration in capillaries, and pressure and concentration within tissue; these fields are mutually dependent. Schematics of a finite element with elementary volumes and nodal variables are show in Fig. 7.
Fig. 7.
Continuum composite smeared finite element (CSFE). Input nodal data (left); elementary volumes within the element and nodal variables – pressures and concentrations in capillary and tissue domains; and connectivity element (right).
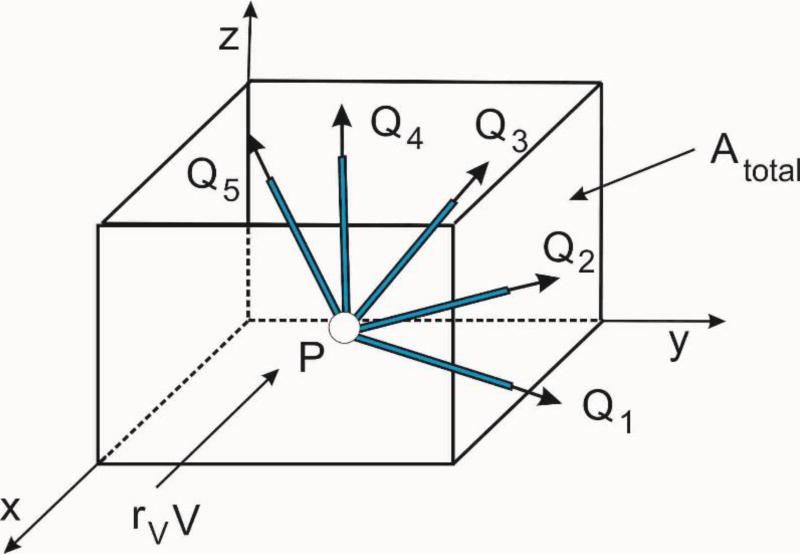
Consider first the pressure field within capillaries. The first step is to transform the Hagen-Poiseuille 1D constitutive relationship into the Darcy law of the continuum. To achieve this, we consider fluxes at a branching point P of capillaries (pipes), Fig. 8. Then, the flux in the pipe K due to pressure gradients in the coordinate directions, ∂p/∂xi, is
| (28) |
kpK is the pipe conductance coefficient according to (5), dK is the pipe diameter ℓKj is the directional cosine of the pipe axis with respect to the coordinate axis j; and the components of the flux QKi are
| (29) |
Fig. 8.
Fluxes through capillaries (pipes) at a branching point
We further can calculate the total fluxes coming from all pipes within the considered volume, and find the flux per unit area, so that the smeared continuum coefficients of the Darcy tensor can be expressed as
| (30) |
where
| (31) |
is the total cross-sectional internal area of capillaries. Note that the area Atot corresponds to the fluid volume occupied by capillaries which is equal to rVV. Also, we note that the pipes do not need to have the branching point within the considered volume – they are pipes within an elementary volume surrounding a point P of the continuum. This Darcy tensor represents the constitutive tensor for fluid flow within the continuum finite element according to the Dracy law, and the standard isoparametric formulation described in Section 2 is applicable. Boundary conditions for the smeared capillary domain continuum are those applicable for the capillaries. Also, in practical implementation we assign the Darcy tensor coefficients to nodal points of the FE mesh and interpolate them to integration points during time steps of the FE solution process.
Following the above derivation of the Darcy tensor, the 1D convective-diffusive transport within capillary network can be “smeared” to the continuum volume rVV, but now using the 1D pipe Fick’s law,
| (32) |
where DpipeK is diffusion coefficient within the pipe K, and xK is coordinate along the pipe axis. In analogy with (30), we have now the coefficients of the diffusion tensor Dij as
| (33) |
Here, also, boundary conditions for the diffusion within capillaries are to be satisfied for the capillary smeared domain. In case of the convective-diffusion transport within the capillary domain, fluid velocities can be determined according to the pressure gradients and Darcy’s coefficients (30), and then included into the governing continuum balance equations (presented in Section 2).
In the tissue domain, there is no change in the governing equations for the fluid flow and convective-diffusive transport of particles with respect the above summarized in Section 2, except that the volume of the continuum is now (1−rv)V.
Connection between the capillary and tissue domains is achieved through the connectivity (fictitious) finite elements generated at each node. The cross-sectional area of the connectivity element at a node J is schematically shown in Fig. 7 and is calculated according to eq. (26). The introduced connectivity element does not require additional nodes or additional nodal variables. Partitioning of the from (23) can be included at each node, so that the flux through the capillary wall between the capillary and tissue domain for a node J can be expressed as
| (34) |
The incremental form for the balance equation of the fictitious element follows from this expression for flux and has the form (24).
The above introduced finite element can be considered as a composite continuum element (termed as composite smeared finite element, CSFE): it contains two domains – capillary and tissue, and connectivity element. It is also important that in this composite finite element, capillary bed characteristics are included (geometrical and material parameters) as in Section 3.1. To emphasize the generality of the formulation we have listed input parameters at the nodes of these composite elements in Fig. 7. This finite element has been built in our general-purpose FE package PAK [42] for 2D and 3D conditions.
Finally, the continuum elements with smeared capillary network can be connected to the pipe elements of large vessels using the connectivity elements as in Section 2. Here, connectivity elements contain pipe nodal pressures and concentrations on one side (nodes 1), and capillary domain pressures and concentrations on the other side (nodes 2).
The presented general smeared finite element CSFE can be used to model large tissue domains (such as an entire tumor or body organ) containing smeared capillary bed representation. Steady and unsteady conditions can be modeled, with appropriate boundary and initial conditions. These tissue domains can also be connected to large (pipe) vessels to have a complete solution for large transport problems. When the overall solution is obtained, detailed models of subdomains can be considered.
4. Examples
In the first three examples we investigate accuracy of the smeared models with respect to models - here called true models - which contain 1D elements only, or are coupled with continuum. The last two examples illustrate applicability of the smeared models to transport within two organs, liver and pancreas.
4.1 Circular domain with given concentration within capillaries
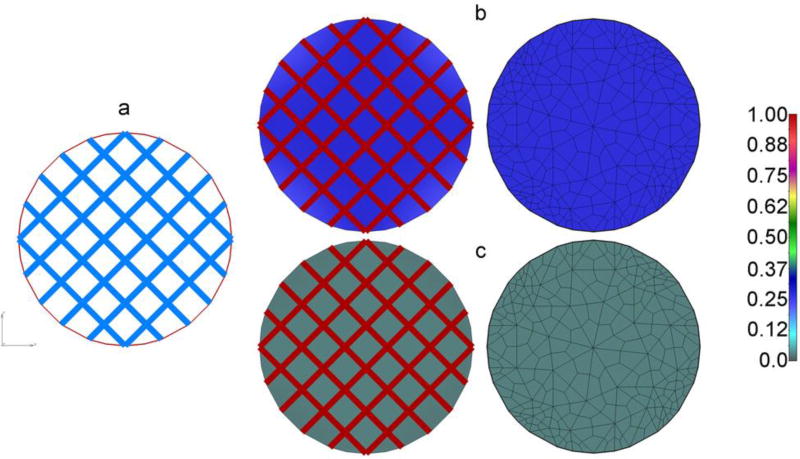
In this example we implement the smeared model described in Section 3.1, where concentration within capillaries are considered known (prescribed). A circular 2D continuum domain with regular capillary mesh is shown in Fig. 9a. The domain is isolated at the boundary, and the concentration in capillaries is a constant, while the initial concentration in continuum (tissue) is equal to zero. Data used are as follows:
| Diameter of tissue domain: | 140 µm |
| Concentration in capillaries, constant: | 1 M |
| Capillary diameter: 4 µm, | Capillary wall thickness: 0.4 µm |
| Diffusion coefficient of wall: | Dwall = 10 µm2/s |
| Diffusion coefficient in tissue | Dtissue = 1000 µm2/s |
| Volumetric fraction of capillaries | rV =29.854 % |
| Time steps: | 20 × 0.05s |
Fig. 9.
Diffusion from capillary net into isolated circular tissue domain. (a) Geometry of capillary network and circular continuum; (b) Concentration field in capillaries and tissue calculated by the true model (left) and the smeared model (right, FE mesh shown), at time t=0.1s; no partitioning; (c) Concentration field as in b), in case of partitioning at the bloodcapillary wall, P=10 - concentration in tissue notable smaller than in b) due to partitioning.
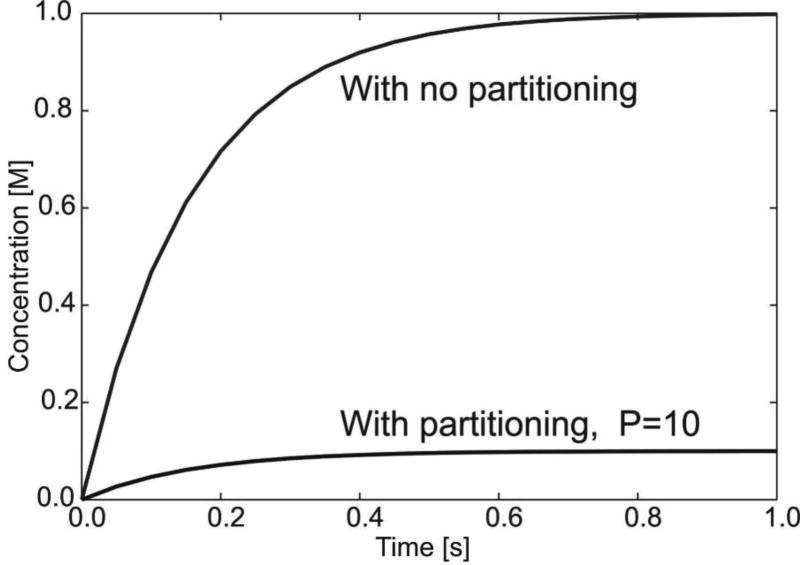
Mass is transported due to diffusion through capillary walls and is modeled according to equations (20) and (23). Concentration fields at time t=0.1s are shown in Figs. 9b,c for true and smeared models; concentration field is uniform due to uniformity of the capillary network and boundary conditions. It can be seen that concentration in tissue is practically the same for true and smeared models. Change of concentration within tissue over time is shown in Fig. 10, in case without partitioning and with partitioning at the blood-capillary wall surface (partitioning coefficient P=10). The concentration in tissue ultimately reaches the value in capillaries - when there is no partitioning; while in case of partitioning, the ultimate concentration in tissue is equal to Ccapillary/P.
Fig. 10.
Change of concentration in tissue for circular domain, true and smeared models. The ultimate concentration in tissue is ten times smaller (P=10) with partitioning.
4.2 Uniform 3D capillary mesh
In this example we consider convective-diffusive transport within a cube with uniform capillary mesh. The mesh is composed of capillaries aligned with coordinate axes and in the diagonal direction. The aim of this example is to verify applicability of the expressions for the Darcy coefficients (30) and for diffusion tensor (33), as well the accuracy of the introduced CSFE. Two basic, physiologically realistic, conditions are considered: a) transport due to pressure and concentration differences at the domain boundaries, or b) transport from the boundary toward the domain interior.
a) Transport from capillaries with pressure and concentration gradients to the isolated tissue
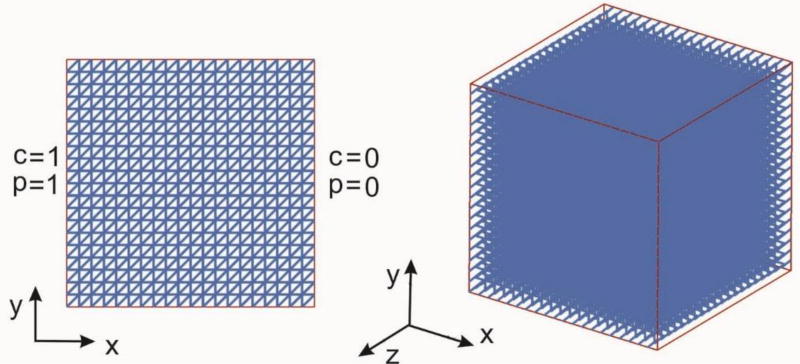
A cube domain (10×10×10 mm) with capillaries and tissue is shown in Fig. 11, with boundary conditions which include constant capillary pressures and concentrations at the surfaces with normals in x-direction, while the tissue has impermeable walls at the boundary. Diagonal capillaries lie in the x,y plane. The following data are used:
| Volume fraction, | rV = Vcapillary/Vtotal = 0.131708 | |
| Capillary diameter | dcapillary = 0.10 mm, Wall thickness | δcapillary = 0.1mm |
| Diffusion coefficient in capillaries (1D pipe elements) | Dcapillary = 1000 mm2/s | |
| Diffusion coefficient in pipe wall | Dwall = 0.05 mm2/s | |
| Diffusion coefficient in tissue | Dtissue = 0.1 mm2/s | |
| Hydraulic coefficient for the capillary wall | kh = 0.05 mm2/ (Pa s) | |
| Time steps: 20 × 0.1 s | ||
Fig. 11.
Geometry and boundary conditions of the cube tissue domain with capillary net
Boundary conditions for the true model include: pressures Pin=1 and Pout=0, concentrations Cin=1 and Cout=0 at the capillary nodes; while tissue boundary is with the flux equal to zero for fluid and for diffusion. In case of the smeared model, the capillary boundary conditions are imposed for the capillary domain (“degrees of freedom” 1 and 3 at the FE nodes, see Fig. 7), while the tissue domain is isolated as in the true model. Therefore, we have fluid flow and convective-diffusive mass transport within capillaries, walls and tissue.
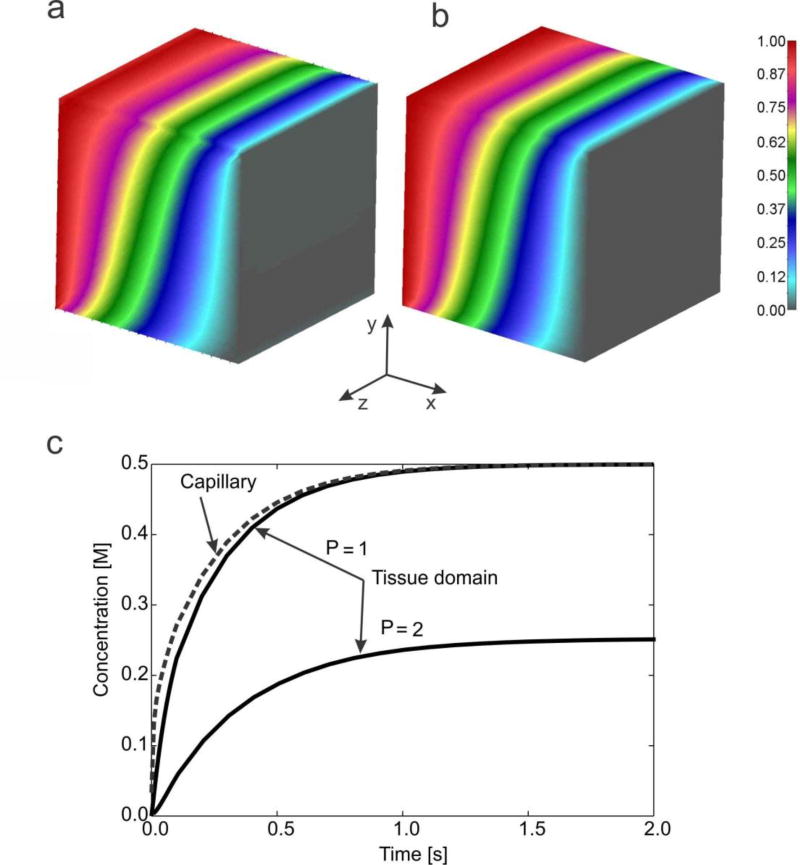
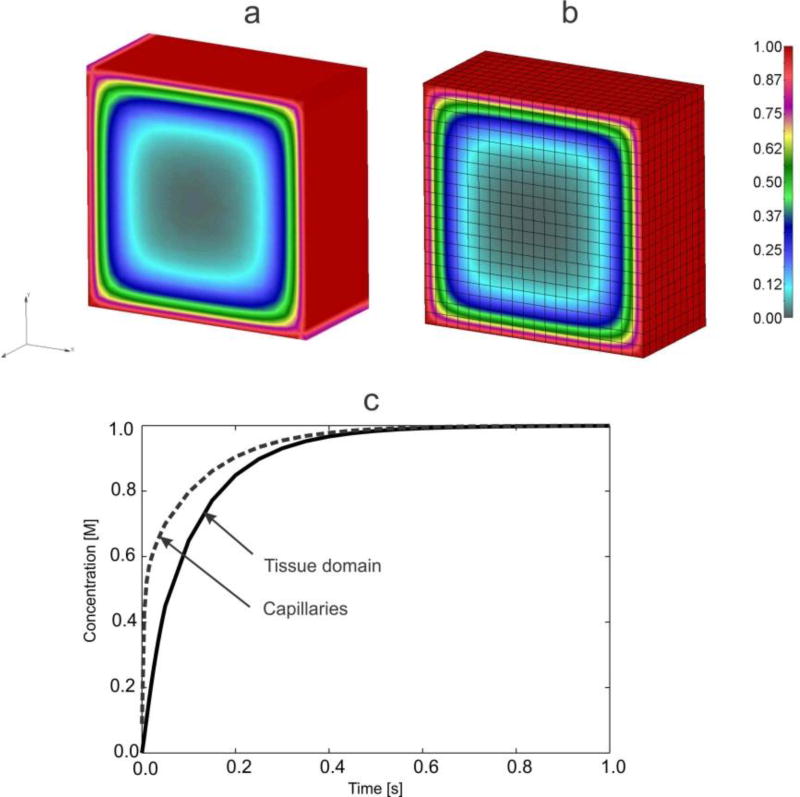
The concentration field within the tissue obtained by using the true model (capillaries as 1D elements, connectivity elements between 1D elements and 3D FEs for tissue) and the smeared model - with the 3D CSFEs - are shown in Fig. 12a,b. It can be seen that the concentration fields are practically the same, oblique with respect to the x-axis. The mean concentration evolution within capillaries (or in capillary domain for smeared model) and within tissue is shown in Fig. 12c; solutions are the same for true and smeared model. It can be seen that evolution curve for tissue is displaced to the right with respect to that of capillaries due to the resistance to transport through the capillary walls; the resistance is larger in case of partitioning, here expressed by partitioning coefficient P=2.
Fig. 12.
Solutions for concentrations in 3D model. Concentration field within tissue for t=2s: (a) true model, (b) smeared model; (c) Mean concentration evolution within capillaries (or in capillary domain) and tissue, true and smeared model; solutions for the case without and with hydrophobicity, expressed by partitioning coefficient P=1 and P=2, respectively.
b) Transport from the boundary
Here, constant concentration C=1 is imposed at all external surfaces, with material parameters the same as in case a).
As in Fig. 12c, there is a delay in mass transport in the tissue with respect to capillaries.
4.3 Capillary bed model
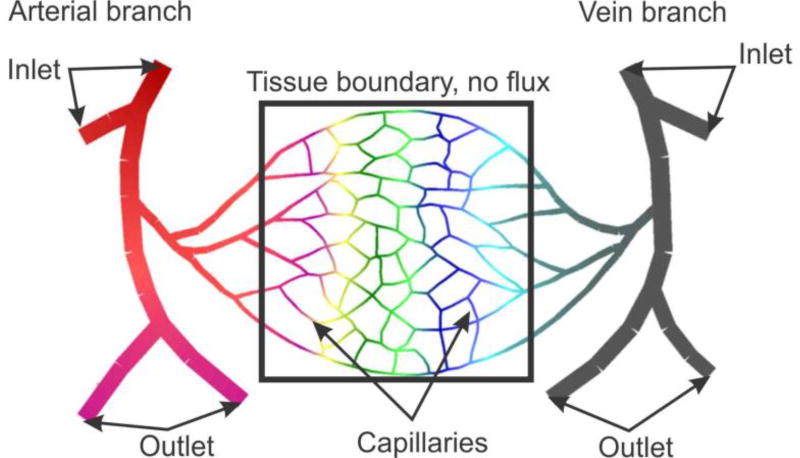
The goal of this example is to demonstrate applicability of the smeared model to a simplified capillary bed, schematically shown in Fig. 14. The model consists of larger arterial and vein vessels (arteriole and venule) and capillary network. We have selected a tissue domain which is considered isolated, with no fluxes through boundaries. The following data are used:
| Domain parameters: | ||
| Dimension of domain: 420 × 420 µm | ||
| Volume fraction: 0.11 | ||
| Capillary average diameter: 4 µm; average thickness: 0.4 µm | ||
| Diameters of arteriola/venula: 26 – 30 µm; diameters of capillaries out of domain: 6 – 16 µm | ||
| Diffusion coefficient in tissue: | 1000 µm2/s | |
| Diffusion coefficient within blood vessels: | 10000 µm2/s | |
| Diffusion coefficient of capillary wall: | 0.1 µm2/s | |
| Hydraulic coefficient: | 0.001 µm/(mmHg s) | |
| Viscosity coefficient | 7.5 ×10⁻⁶ mmHg s | |
| Darcy coefficient for tissue | 0.001 µm2/(mmHg s) | |
| Prescribed values: | ||
| Concentrations: | C = 1 M at arteriole inlet and outlet; C = 0 M at inlet and outlet of venule | |
| Pressures: | P=25mmHg at arteriole inlet; P=24mm Hg at the venule inlet | |
| Velocities: | v=5mm/s at arteriole outlet; v=0.1mm/s at venule outlet | |
| Time steps: | 20 × 50 s | |
Fig. 14.
A simplified model of capillary bed. Geometry of capillaries and tissue domain.
Boundary conditions for fluid and mass transport are imposed at the inlet and outlet blood vessels. The true model consists of 1D pipe elements for all blood vessels, 2D elements for tissue continuum, and connectivity elements between capillaries and tissue within the tissue domain. The smeared model includes 1D elements for blood vessels outside the tissue domain, and composite smeared elements for the bounded domain; common nodes of the CSFE elements at the boundary (capillary “degrees of freedom” 1 and 3) and blood vessels have the same pressures and concentrations, while the capillary domain is considered isolated, as it is the tissue domain. Darcy and diffusion tensor coefficients are calculated at the cross-sectional points and at the middle of capillaries and then the values are mapped to the continuum mesh of the smeared model.
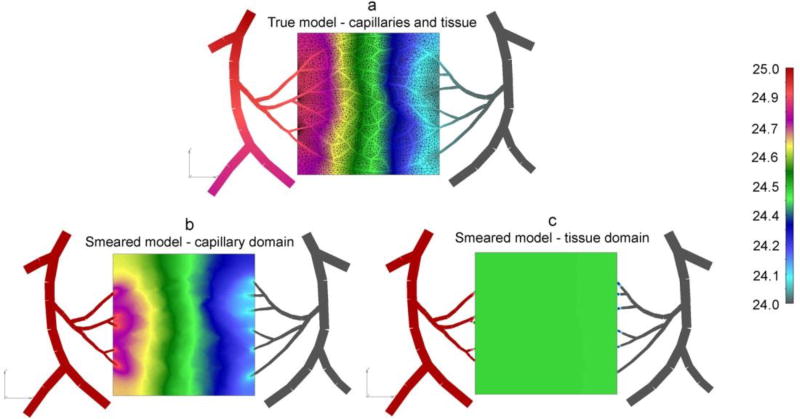
Fig. 15 shows pressure fields for the true model and for smeared model. It can be seen that pressure distribution within capillaries and within capillary domain (Figs. 15a and 15b) is similar, while solution for smeared model tissue domain shows an average, almost uniform field (Fig. 15c) when compared the true solution.
Fig. 15.
Pressure field for capillary bed (pressure in Pa). (a) True model, pressure within blood vessels and tissue; (b) Smeared model, with pressures within capillary domain; (c) Smeared model, with pressures within tissue domain
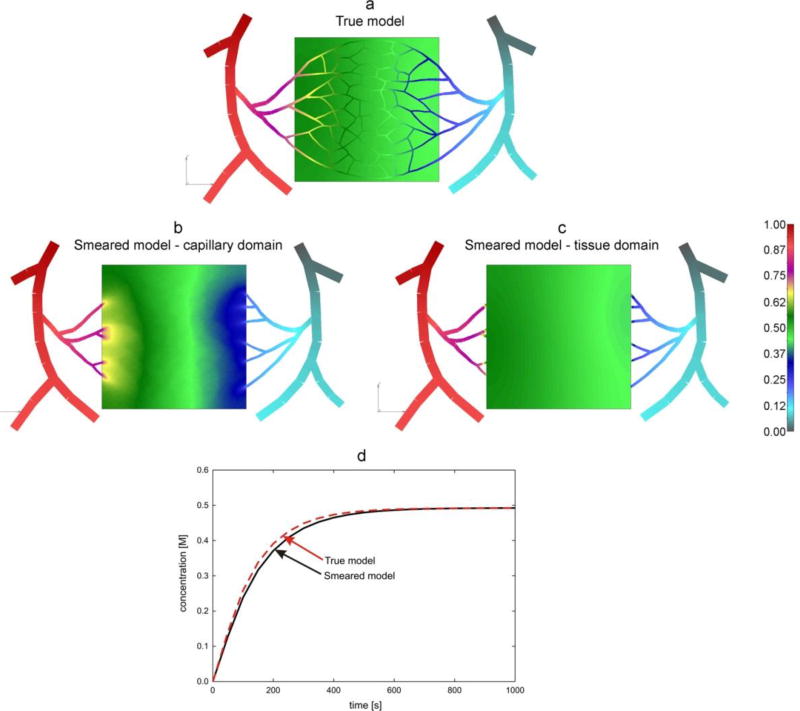
Solutions for concentrations are shown in Fig. 16. It can be seen that smeared model gives a reasonable agreement when compared concentration fields in capillaries and capillary domain (Figs. 16a and 16b) and within tissue (Figs. 16a and 16c). Also, the mean concentration evolution within tissue (Fig. 16d) is in a good agreement when calculated by using true and smeared models. Some differences are expected due to the conditions at the boundary between blood vessels and tissue domain (transport is conditioned through just few points: connected directly to capillaries – true model, and to continuum in case of smeared model). Also, the capillary network is very inhomogeneous and occupies part of the selected continuum domain. Although it is not tested here, inhomogeneous distribution of capillary densities is feasible without any change to our FE model.
Fig. 16.
Concentrations in capillary bed. Concentration fields at time t = 1000s (last step of simulation): (a) true model, distribution within blood vessels and tissue; smeared model: capillary domain (b), and tissue domain (c); (d) mean concentration evolution within capillary and tissue domains.
4.4 Liver model
In this example, gradient-driven transport is studied in the liver, for its fundamental role as a biological barrier in nanomedicine. In fact, the liver is one of the organs that play a major role in uptake of nanoparticles, thus significantly reducing nanoparticles reach of their final destination [43–45]. This is particularly critical for tumor treatments, where nanoparticles have shown great potential [3, 46].
Geometry of liver and blood vessel network is generated at R&D Center for Bioengineering BIOIRC from micro-CT scan of a mouse liver, obtained following a previously published procedure [47]. Briefly, blood was washed out from the vasculature via ex-vivo transcardial perfusion first with Heparine sodium salt [AAA1619803, Alfa Aesar] in 0.9% NaCl [72101, Ricca Chemical Company], then with the contrast agent Microfil [MV-120, Flow Tech Inc.]. After perfusion, Microfil was allowed to solidify for a few hours before moving the liver into 4% Paraformaldehyde for preservation. Micro computed tomography (micro-CT) was then used to scan the vascular structure by the Preclinical Imaging Core at the Houston Methodist Research Institute. The geometry of the model can be seen in Fig. 17a. The model consists of 1D pipe FEs for larger vessels (7736 elements), 3D composite smeared elements (39640 elements), and connectivity elements (726 elements) for connecting large vessels with continuum nodes (capillary domain DOF) of smeared FEs. Number of nodes is 54042. Data for this example are:
| Prescribed conditions in larger vessels (at input/output nodes of 1D pipe elements mesh) | |
| Inlet Pressure | 3999.7 Pa (30 mmHg) |
| Outlet Pressure | 1333.2 Pa (10 mmHg) |
| Inlet Concentration | Bolus - C(t) (Fig. 19 dashed line) |
| Outlet Concentration | 0 molar |
| Characteristics of fluid/diffusion flow through blood vessels (large vessels and capillaries) | |
| Viscosity | 10−3 Pa s |
| Diffusion coefficient | 1000 mm2/s |
| Characteristics of blood vessel walls: | |
| Hydraulic permeability coefficient | 10−12 mm / (Pa s) |
| Diffusion coefficient | 0.1 mm2 /s |
| Thickness | 10% of vessel diameter |
| Characteristics of tissue | |
| Diffusion coefficient | 0.1 mm2/s |
| Darcy coefficient | 10−12 mm2 /(Pa s) |
| Smeared model: | |
| Average capillary diameter | 0.025 mm |
| Capillary wall thickness | 0.0025 mm |
| Volume fraction | 10% |
| Diffusion coefficient of capillary wall: | 10−6 mm2 / s |
| Hydraulic permeability of capillary wall: | 10−12 mm / (Pa s) |
| Time steps: | 40 × 10 s |
Fig. 17.
Liver model, concentration at time t = 40s. (a) Geometry and concentration within large vessels; (b) capillary domain; (c) tissue domain
Fig. 19.
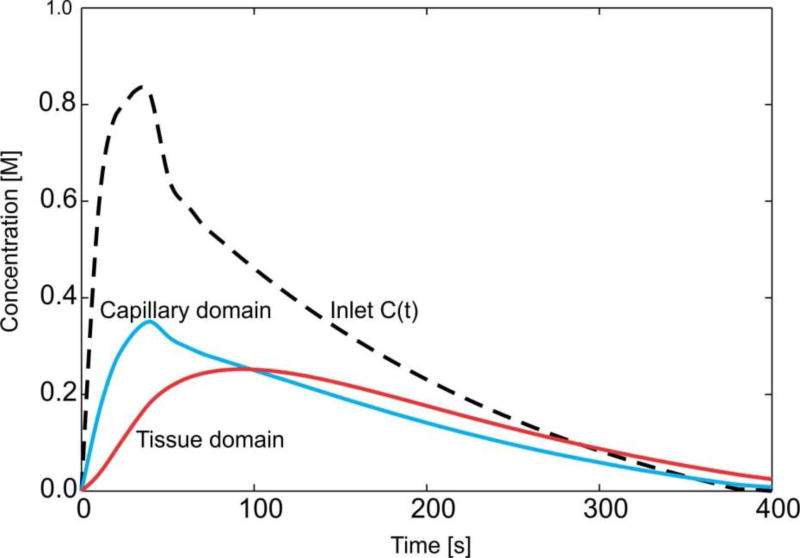
Mean concentration evolution for capillaries and tissue of the liver.
The concentration field within large vessels, within capillaries (capillary domain), and tissue domain is shown in Fig. 17 at the end of first time step. It is noticeable that concentrations have the largest values in blood vessels (practically the same due to convection and large diffusion coefficient in fluid), followed by capillaries and then tissue. Concentration fields in a vertical plane, for three time steps, are shown in Fig. 18, with the same characteristics regarding the mass transport delay between capillary and tissue domains as in Fig. 17.
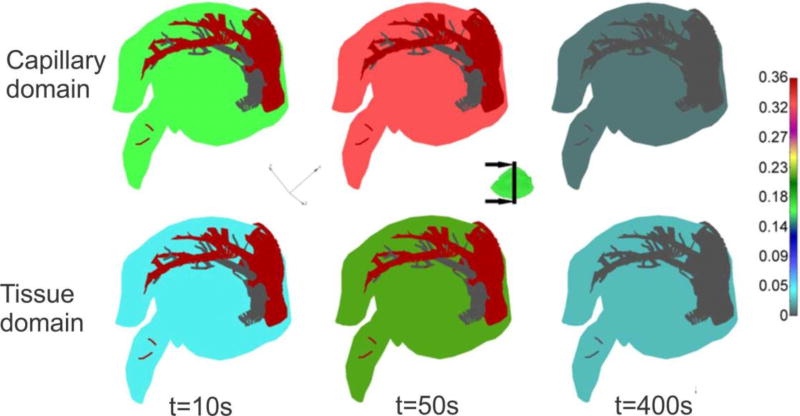
Fig. 18.
Concentration field within vertical plane for capillary and tissue domains, for three time steps.
Evolution of the mean concentration within capillaries (capillary domain) and tissue is shown in graphs of Fig. 18. It is interesting to note that the model gives insight into the process of transport of particles and molecules within the organ. In the first period, when the entering mass is increasing, concentration within capillaries and tissue is increasing. The maximum concentration within capillaries has a delay with respect to the maximum of C(t). Further, transport continues from capillaries to tissue, as long as the concentration within capillaries is larger than in tissue. When concentration in the tissue becomes larger then concentration within capillaries, transport reverses, going from tissue to capillaries. This process corresponds to clearance of molecules or particles from the organ. Ultimately, transport occurs from capillaries to large vessels, when concentration in capillaries becomes larger than in large vessels. The mean concentration within tissue reaches the maximum with a delay with respect to capillary maximum, after which the clearance process starts toward the capillaries.
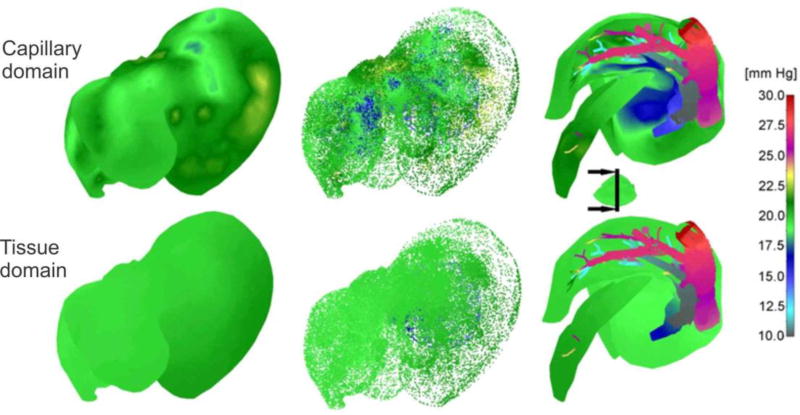
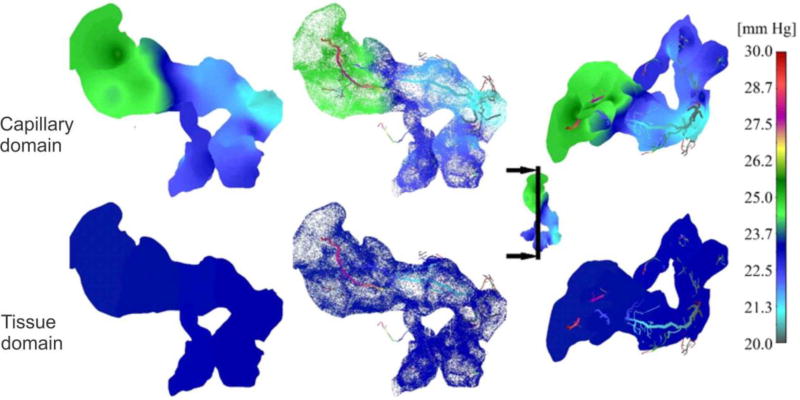
Finally, to gain insight into pressure distribution, Fig. 20 shows pressure field, for the outer surface of 3D smeared elements, a dotted representation of large vessels and continuum, and cross-section. As in the case of concentrations, there is a reduction in pressures – from large vessels to capillaries and to tissue.
Fig. 20.
Pressure field in liver. From the left to the right: outer surface of 3D smeared elements, dotted representation of pressure in large vessels and continuum, and pressure in a vertical cross-section.
4.5 Pancreas model
With a 2 year survival rate of only 10%, pancreatic cancer is one of the deadliest cancers in the US [48]. Its usually late diagnosis, rapid advancement, and frequent recurrence contribute to a generally poor prognosis and low rate of therapeutic success. Furthermore, the majority of patients with pancreatic cancer are normally treated with systemic chemotherapy [49], but the development of chemoresistance results in an overall low response rate [50–52]. For this reason, the understanding of drug transport in pancreas is of great interest to discover potential strategies for enhancing therapeutic efficacy of conventional drugs or chemotherapeutics. This model was also selected since the geometry, blood vessel size and capillary volumetric fraction are different from other tissues; and with the aim to help in the insight into drug delivery for pancreatic cancer. Material characteristics are taken to be the same as for the liver model, as well as the entering concentration bolus. The model is generated at R&D Center BIOIRC from CT imaging data recorded at MD Anderson Cancer Institute, Houston under an approved Institutional Review Board protocol (PA14-0646). Geometry of the model is shown in Fig. 21(a). As in the case of the previous example, the model consists of 1D pipe FEs for larger vessels (1602 elements), 3D composite smeared elements (104884 elements), and connectivity elements (312 elements) for connecting large vessels with continuum nodes (capillary domain DOF) of smeared FEs. Number of nodes is 127783. Data for this example are:
| Prescribed conditions in larger vessels (at input/output nodes of 1D pipe elements mesh) | |
| Inlet Pressure | 3999.7 Pa (30 mmHg) |
| Outlet Pressure | 2666.4 Pa (10 mmHg) |
| Inlet Concentration (as for liver model) | Bolus - C(t) (Fig. 23 dashed line) |
| Outlet Concentration | 0 molar |
| Smeared model: | |
| Average capillary diameter | 0.005 mm |
| Capillary wall thickness | 0.0005 mm |
| Volume fraction | 2% |
| Time steps: | 40 × 10 s |
Other material characteristics are the same as for the liver model.
Fig. 21.
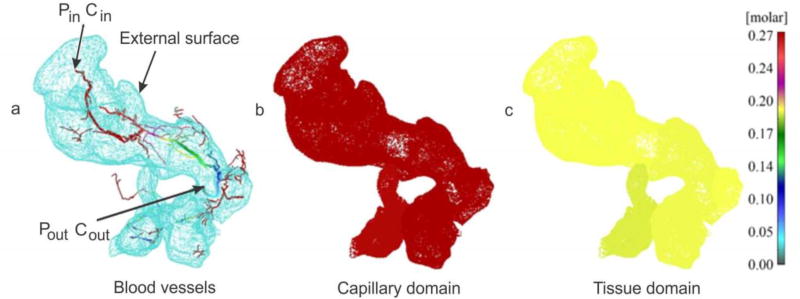
Pancreas model, concentration at time t = 40s. (a) Geometry and concentration within large vessels; (b) capillary domain; (c) tissue domain
Fig. 23.
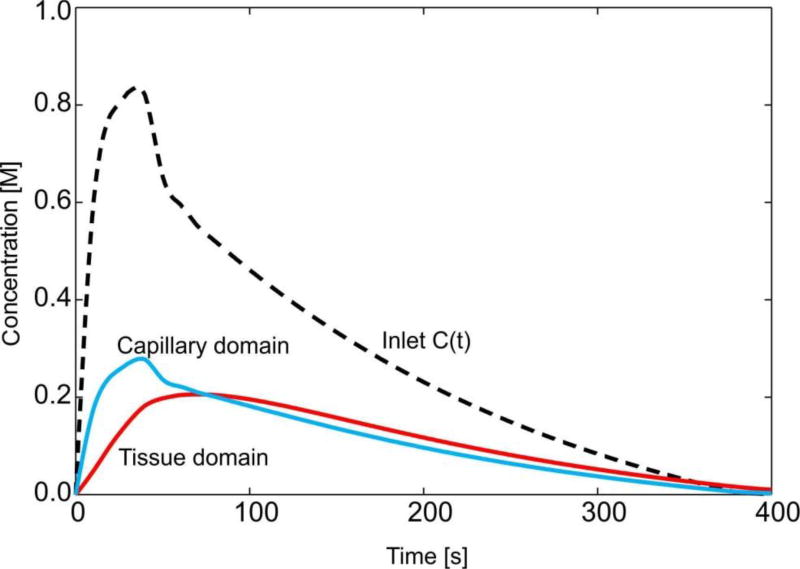
Pancreas model: change of mean concentration in capillaries and tissue with time
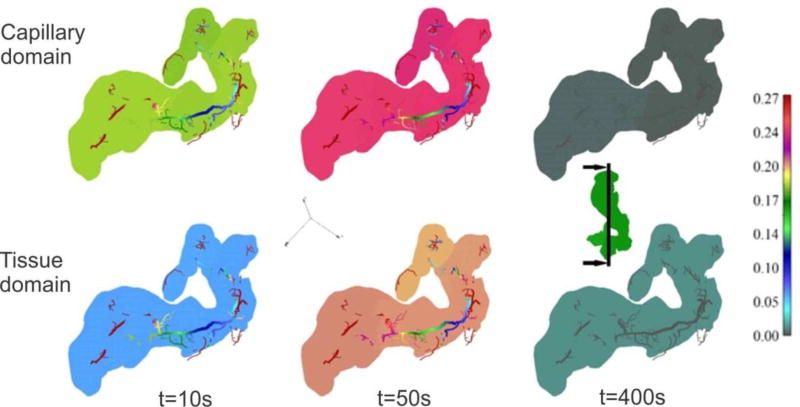
Figure 21 shows concentration fields at the end of the first time step (t=40s), for large vessels, within capillary and tissue domain. Due to a smaller capillary volumetric fraction, now the difference between concentration in capillaries and in tissue is larger than for the liver (Fig. 17). Concentration fields in a vertical plane, for three time steps, are shown in Fig. 22, with the same characteristics as in the liver model (Fig. 18), but now more pronounced.
Fig. 22.
Pancreas model. Concentration field within vertical plane for capillary and tissue domains, for three time steps.
Change of the mean concentration in capillaries (capillary domain) and in tissue is shown in Fig. 23. The curves representing mean concentrations have the same character as in case of liver (Fig. 19), but now, due to smaller volumetric fraction of capillaries (2% with respect to 10% for liver), the curves are closer. The transport process also has the same character as in the liver.
Pressure field in pancreas is shown in Fig. 24, indicating a pronounced pressure gradient in capillaries due to the organ shape (when compared to the liver).
Fig. 24.
Pressure field in pancreas. From the left to the right: outer surface of 3D smeared elements, dotted representation of pressure in large vessels and continuum, and pressure in a vertical cross-section.
5. Summary and conclusions
This study introduces a smeared modeling concept which simplifies numerical modeling of mass transport (convection and diffusion) within capillary network and tissues. It is first assumed that the concentration within capillaries is uniform and can change over time. Then, transport through capillary walls, considered as discrete physical objects within the continuum, is transformed (smeared) to a distributed continuum mass sources within tissue. The basis of this transformation is the relation between the surface of the capillary wall and the volume of the continuum. Further, the corresponding continuum FE formulation includes physical parameters of the capillary-tissue system, such as: capillary volumetric fraction, diffusion coefficient through the capillary wall and partitioning (hydrophobicity) at the wall surface.
Following the basic development within the described special conditions, a new continuum composed smeared finite element (CSFE) is introduced. This smeared finite element approach relies on the following three basic steps in the element formulation. In the first step, a transformation of the fluid flow and convection-diffusion 1D constitutive relations to the continuum constitutive relations is performed. This is achieved by a straightforward derivation of the Darcy and diffusion tensor for general 3D conditions, starting from the Hagen-Poiseuille relation for flow in pipes and 1D Fick’s law for diffusion within pipes. In the second step, two domains of the finite element are introduced: capillary and tissue domain. The first domain occupies the space corresponding to the volume of capillaries, and the remaining volume represents the tissue domain. Each domain has its own “degrees of freedom” – pressure and concentration, hence the FE nodes have 4 DOFs. In the capillary domain, fluid flow is described using the continuum pressure gradient-driven formulation with the Darcy smeared tensor, while the convective-diffusive transport includes the Darcy velocities and Fick’s diffusion with the smeared diffusion tensor. Transport within the tissue domain relies on the standard formulation for porous media, with appropriate Darcy and diffusion coefficients. Boundary conditions for the smeared element refer to each DOF. Finally, in the third step, the connectivity (fictitious) 1D finite elements are introduced at each element node to couple the two domains. The connectivity elements contain the transport properties of the capillary walls (diffusivity and partitioning) and geometrical characteristics of the capillary network.
The formulated smeared methodology is tested with respect to accuracy on characteristic simple examples, while robustness and applicability to the real physiological conditions is illustrated on two whole organ examples (liver and pancreas). The later two models are generated using the geometrical structure of capillaries as imaged with ex-vivo micro computed tomography (micro-CT) scans of organs perfused with a contrast agent.
The smeared model introduced here offers a superior methodology to simulate in silico the transport of molecules and particles used in biomedical applications in order to improve drug delivery of therapeutics. While this approach is based on gradient-driven transports (convection and diffusion) making it ideal to study biodistribution of nanotherapeutics and molecules in complex capillary systems of organs, the incorporation of the partitioning phenomenon inside CSFE enables the simulations and studies of immune and other cells transport. In the latter case, partitioning can phenomenologically model cell accumulation in tumor tissues against cell concentration gradients. The introduced smeared modeling can also be used for simulating the accumulation of drugs in specific tissues domains governed by molecular hydrophobicity (partitioning) or drug binding. Another strength of the CSFE element is that it relies on the use of measurable parameters, such as capillary density and other characteristics of capillaries and tissues. It was validated that CSFE can be employed to adequately model realistic physiological conditions and thus can be further applied to a wide range of biomedical investigations. Although the CSFE model was validated on complex biological systems, it can be directly applied to study transport in other complex non-biological systems, such as, for example, soils.
Fig. 13.
Transport from the boundaries to the region. Concentration at time t=1s, mid-plane z=5mm, in case of true model (a) and smeared model (b); (c) Evolution of mean concentration in capillaries (capillary domain) and in tissue-solutions are the same for true and smeared model.
Highlights.
We introduce a new smeared concept for modeling mass transport in blood vessels networks and tissue.
A relation which connects the blood vessel internal surface and volumetric ratio of capillary network is derived as a one of the basic expressions in the smeared approach.
The derived relation further enables to smeared diffusive transport from capillary system to tissue - as mass source distributed within continuum finite model. Here, it is assumed that concentration within capillaries is uniform and variable with time.
The pipe 1D Hagen-Poisseulle law is transformed into continuum Darcy law with the corresponding Darcy tensor. In the analogous way the pipe 1D diffusion constitutive relation is transformed into continuum diffusion tensor. These transformations are the basic relations for introducing smeared continuum finite element.
A composite smeared finite element (CSFE) is formulated. The element has two domains – capillary (which occupies capillary volume) and tissue domain, each having its DOFs – pressure and concentration. The physical fields within the domains are connected at element nodes by the connectivity (fictitious) 1D elements; these elements include geometric and material characteristics of capillary walls, as hydraulic conductivity, diffusivity and partitioning.
The introduced CSFE provides a robust and easy modeling of particle/drug convective-diffusive transport within complex capillary-tissue systems and enables in silico simulations of large domains like entire tumors or organs. The models rely on measurable parameters as capillary volumetric density, capillary diameters, wall diffusivity, partitioning at the wall surface.
Selected examples illustrate accuracy of the introduced smeared model and of the CSFE element, and also applicability to two large systems (liver and pancreas).
Acknowledgments
Dr. Ferrari acknowledges the support from NCI U54 CA210181 and The Ernest Cockrell Jr. Presidential Distinguished Chair at Houston Methodist Research Institute.
The authors acknowledge support from Ministry of Education and Science of Serbia, grants OI 174028 and III 41007, and City of Kragujevac.
Footnotes
Publisher's Disclaimer: This is a PDF file of an unedited manuscript that has been accepted for publication. As a service to our customers we are providing this early version of the manuscript. The manuscript will undergo copyediting, typesetting, and review of the resulting proof before it is published in its final citable form. Please note that during the production process errors may be discovered which could affect the content, and all legal disclaimers that apply to the journal pertain.
References
- 1.Ferrari M. Frontiers in cancer nanomedicine: directing mass transport through biological barriers. Trends Biotechnol. 2010;28:181–188. doi: 10.1016/j.tibtech.2009.12.007. [DOI] [PMC free article] [PubMed] [Google Scholar]
- 2.Koay EJ, Ferrari M. Transport Oncophysics in silico, in vitro, and in vivo. Preface. Phys Biol. 2014;11:060201. doi: 10.1088/1478-3975/11/6/060201. [DOI] [PubMed] [Google Scholar]
- 3.Blanco E, Shen H, Ferrari M. Principles of nanoparticle design for overcoming biological barriers to drug delivery. Nat Biotechnol. 2015;33:941–951. doi: 10.1038/nbt.3330. [DOI] [PMC free article] [PubMed] [Google Scholar]
- 4.Reulen HJ, Graham R, Spatz M, Klatzo I. Role of pressure gradients and bulk flow in dynamics of vasogenic brain edema. J Neurosurg. 1977;46:24–35. doi: 10.3171/jns.1977.46.1.0024. [DOI] [PubMed] [Google Scholar]
- 5.Popel AS, Pittman RN. The microcirculation physiome. In: Bronzino J, editor. Handbook of Biomedical Engineering. CRC Press; Boca Raton, FL: [Google Scholar]
- 6.Shi Y, Lawford P, Hose R. Review of zero-D and 1-D models of blood flow in the cardiovascular system. Biomed Eng Online. 2011;10:33. doi: 10.1186/1475-925X-10-33. [DOI] [PMC free article] [PubMed] [Google Scholar]
- 7.Mathura KR, Vollebregt KC, Boer K, De Graaff JC, Ubbink DT, Ince C. Comparison of OPS imaging and conventional capillary microscopy to study the human microcirculation. J Appl Physiol (1985) 2001;91:74–78. doi: 10.1152/jappl.2001.91.1.74. [DOI] [PubMed] [Google Scholar]
- 8.D'Apolito R, Tomaiuolo G, Taraballi F, Minardi S, Kirui D, Liu X, Cevenini A, Palomba R, Ferrari M, Salvatore F, Tasciotti E, Guido S. Red blood cells affect the margination of microparticles in synthetic microcapillaries and intravital microcirculation as a function of their size and shape. J Control Release. 2015;217:263–272. doi: 10.1016/j.jconrel.2015.09.013. [DOI] [PubMed] [Google Scholar]
- 9.Sevick EM, Jain RK. Viscous resistance to blood flow in solid tumors: effect of hematocrit on intratumor blood viscosity. Cancer Res. 1989;49:3513–3519. [PubMed] [Google Scholar]
- 10.Cinar Y, Demir G, Pac M, Cinar AB. Effect of hematocrit on blood pressure via hyperviscosity. Am J Hypertens. 1999;12:739–743. doi: 10.1016/s0895-7061(99)00011-4. [DOI] [PubMed] [Google Scholar]
- 11.Pries AR, Secomb TW. Microvascular blood viscosity in vivo and the endothelial surface layer. Am. J. Physiol. Heart Crc. Physiol. 2005;289:2657–2664. doi: 10.1152/ajpheart.00297.2005. [DOI] [PubMed] [Google Scholar]
- 12.Pries AR, Secomb TW, Gaehtgens P, Gross JF. Blood flow in microvascular networks. Experiments and simulation. Circulation Research. 1990;67:826–834. doi: 10.1161/01.res.67.4.826. [DOI] [PubMed] [Google Scholar]
- 13.Pries AR, Secomb TW. Microvascular blood viscosity and endothelial surface layer. Am. J. Physiol. Heart Crc. Physiol. 2005;289:2657–2664. doi: 10.1152/ajpheart.00297.2005. [DOI] [PubMed] [Google Scholar]
- 14.Less JR, Skalak TC, Sevick EM, Jain RK. Microvascular architecture in a mammary carcinoma: branching patterns and vessel dimensions. Cancer Res. 1991;51:265–273. [PubMed] [Google Scholar]
- 15.Roberts WG, Palade GE. Neovasculature induced by vascular endothelial growth factor is fenestrated. Cancer Res. 1997;57:765–772. [PubMed] [Google Scholar]
- 16.Sevick EM, Jain RK. Geometric resistance to blood flow in solid tumors perfused ex vivo:Effects of tumor size and perfusion pressure. Cancer Research. 1989;49:3506–3512. [PubMed] [Google Scholar]
- 17.Sevick EM, Jain RK. Viscous resistance to blood flow in solid tumors: Effect of hematocrit on intratumor blood viscosity. Cancer Research. 1989;49:3513–3519. [PubMed] [Google Scholar]
- 18.Sevick EM, Jain RK. Effect of red blood cell rigidity on tumor blood flow: Increase in viscous resistance during hyperglycemia. Cancer Research 51. 1991;51:2727–2730. [PubMed] [Google Scholar]
- 19.Jain R. Determinants of tumor blood flow: A review. Cancer research. 1988;48:2641–2658. [PubMed] [Google Scholar]
- 20.Jain R. Transport of molecules across tumor vasculature. Cancer and Metastasis Reviews. 1987;6:559–593. doi: 10.1007/BF00047468. [DOI] [PubMed] [Google Scholar]
- 21.Nicholson C. Diffusion and related transport mechanisms in brain tissue. Rep. Prog. Phys. 2001;64:815–884. [Google Scholar]
- 22.Swabb EA, Wei J, Cullino PM. Diffusion and convection in normal and neoplastic tissues. Cancer Research. 1974;34:2814–2822. [PubMed] [Google Scholar]
- 23.Khaled A-RA, Vafai K. The role of porous media in modeling flow and heat transfer in biological tissues. Int. J. Heat and Mass Transfer. 2003;46:4989–5003. [Google Scholar]
- 24.Nugent LJ, Jain RK. Extravascular diffusion in normal and neoplastic tissues. Cancer Research. 1984;44:238–244. [PubMed] [Google Scholar]
- 25.Gerlowski LE, Jain RK. Microvascular permeability of normal and neoplastic tissues. Microvascular Research. 1986;31:288–305. doi: 10.1016/0026-2862(86)90018-x. [DOI] [PubMed] [Google Scholar]
- 26.Rushmer RF. In: Cardiovacular Dynamics. 4. Saunders WB, editor. Philadelphia: 1976. [Google Scholar]
- 27.Lipowsky HH, Zweifach BW. Network analysis of microcirculation of cat mesentery. Microvascular Research. 1974;7:73–83. doi: 10.1016/0026-2862(74)90038-7. [DOI] [PubMed] [Google Scholar]
- 28.Kojic M, Milosevic M, Simic V, Ferrari M. A 1D pipe finite element with rigid and deformable walls. J. Serbian Soc. Comp. Mechanics. 2014;8:38–53. [Google Scholar]
- 29.Kojic M, Filipovic N, Stojanovic B, Kojic N. Examples and Software. John Wiley and Sons; Chichester, England: 2008. Computer Modeling in Bioengineering - Theoretical Background. [Google Scholar]
- 30.Skinner SA, Tutton PJM, O'Brien PE. Microvascular architecture of experimental colon tumors in the rat. Cancer Research. 1990;50:2411–2417. [PubMed] [Google Scholar]
- 31.Freitas R. Nanomedicine, Volume I: Basic Capabilities. Landes Bioscience; Georgetown, TX, USA: 1999. [Google Scholar]
- 32.Less JR, Skalak TC, Sevick EM, Jain RK. Microvascular architecture in a mammary carcinoma: Branching patterns and vessel Dimensions. Cancer Research. 1991;51:265–273. [PubMed] [Google Scholar]
- 33.Kojic M, Milosevic M, Kojic N, Starosolski Z, Ghaghada K, Serda R, Annapragada A, Ferrari M, Ziemys A. A multi-scale FE model for convective-diffusive drug transport within tumor and large vascular networks. Comput. Methods Appl. Mech. Engrg. 2015;294:100–122. [Google Scholar]
- 34.Kojic M, Milosevic M, Kojic N, Kim K, Ferrari M, Ziemys A. A multiscale MD–FE model of diffusion in composite media with internal surface interaction based on numerical homogenization procedure. Comput. Methods Appl. Mech. Engrg. 2014;269:123–138. doi: 10.1016/j.cma.2013.11.010. [DOI] [PMC free article] [PubMed] [Google Scholar]
- 35.Kojic M, Milosevic M, Kojic N, Koay EJ, Fleming JB, Ferrari M, Ziemys A. Mass release curves as the constitutive curves for modeling diffusive transport within biological tissue. Computers in Biology and Medicine. 2016 doi: 10.1016/j.compbiomed.2016.06.026. [DOI] [PMC free article] [PubMed] [Google Scholar]
- 36.Ziemys A, Kojic M, Milosevic M, Kojic N, Hussain F, Ferrari M, Grattoni A. Hierarchical modeling of diffusive transport through nanochannels by coupling molecular dynamics with finite element method. J. Comp. Physics. 2011;230:5722–5731. [Google Scholar]
- 37.Kojic M, Milosevic M, Kojic N, Ferrari M, Ziemys A. On diffusion in nanospace. J. Serbian Soc. Comp. Mechanics. 2011;5:84–109. [Google Scholar]
- 38.Ziemys A, Kojic M, Milosevic M, Ferrari M. Interfacial effects on nanoconfined diffusive mass transport regimes. Phys. Review Letters. 2012;108 doi: 10.1103/PhysRevLett.108.236102. [DOI] [PMC free article] [PubMed] [Google Scholar]
- 39.Ma PX, Zhang R. Synthetic nano-scale fibrous extracellular matrix. J. Biomed. Mater. Res. 1998;46:60–72. doi: 10.1002/(sici)1097-4636(199907)46:1<60::aid-jbm7>3.0.co;2-h. [DOI] [PubMed] [Google Scholar]
- 40.Rots JG, Blaauwendraad J. Crack models for concrete: Discrete or smeared? Fixed, multidirectional or rotating? HERON Journal. 1989;34 [Google Scholar]
- 41.Ehlers W, Markert B. A linear viscoelastic biphasic model for soft tissues based on the theory of porous media. J. Biomechanical Engineering. 2001;123:418–424. doi: 10.1115/1.1388292. [DOI] [PubMed] [Google Scholar]
- 42.Kojic M, Slavkovic R, Zivkovic M, Grujovic N, Filipovic N. PAK - Finite Element Program for Linear and Nonlinear Analysis. Univ Kragujevac and R&D Center for Bioengineering; Kragujevac, Serbia: 2010. [Google Scholar]
- 43.Gustafson HH, Holt-Casper D, Grainger DW, Ghandehari H. Nanoparticle Uptake: The Phagocyte Problem. Nano Today. 2015;10:487–510. doi: 10.1016/j.nantod.2015.06.006. [DOI] [PMC free article] [PubMed] [Google Scholar]
- 44.Zhang YN, Poon W, Tavares AJ, McGilvray ID, Chan WC. Nanoparticle-liver interactions: Cellular uptake and hepatobiliary elimination. J Control Release. 2016;240:332–348. doi: 10.1016/j.jconrel.2016.01.020. [DOI] [PubMed] [Google Scholar]
- 45.Tsoi KM, MacParland SA, Ma XZ, Spetzler VN, Echeverri J, Ouyang B, Fadel SM, Sykes EA, Goldaracena N, Kaths JM, Conneely JB, Alman BA, Selzner M, Ostrowski MA, Adeyi OA, Zilman A, McGilvray ID, Chan WC. Mechanism of hard-nanomaterial clearance by the liver. Nat Mater. 2016;15:1212–1221. doi: 10.1038/nmat4718. [DOI] [PMC free article] [PubMed] [Google Scholar]
- 46.Jain RK, Stylianopoulos T. Delivering nanomedicine to solid tumors. Nat Rev Clin Oncol. 2010;7:653–664. doi: 10.1038/nrclinonc.2010.139. [DOI] [PMC free article] [PubMed] [Google Scholar]
- 47.Zagorchev L, Oses P, Zhuang ZW, Moodie K, Mulligan-Kehoe MJ, Simons M, Couffinhal T. Micro computed tomography for vascular exploration. J Angiogenes Res. 2010;2:7. doi: 10.1186/2040-2384-2-7. [DOI] [PMC free article] [PubMed] [Google Scholar]
- 48.Niederhuber JE, Brennan MF, Menck HR. The National Cancer Data Base report on pancreatic cancer. Cancer. 1995;76:1671–1677. doi: 10.1002/1097-0142(19951101)76:9<1671::aid-cncr2820760926>3.0.co;2-r. [DOI] [PubMed] [Google Scholar]
- 49.McKenna S, Eatock M. The medical management of pancreatic cancer: a review. Oncologist. 2003;8:149–160. doi: 10.1634/theoncologist.8-2-149. [DOI] [PubMed] [Google Scholar]
- 50.Berger AK, Abel U, Komander C, Harig S, Jager D, Springfeld C. Chemotherapy for advanced pancreatic adenocarcinoma in elderly patients (>/=70 years of age): a retrospective cohort study at the National Center for Tumor Diseases Heidelberg. Pancreatology. 2014;14:211–215. doi: 10.1016/j.pan.2014.03.004. [DOI] [PubMed] [Google Scholar]
- 51.Cao H, Le D, Yang LX. Current status in chemotherapy for advanced pancreatic adenocarcinoma. Anticancer Res. 2013;33:1785–1791. [PubMed] [Google Scholar]
- 52.Kollmannsberger C, Peters HD, Fink U. Chemotherapy in advanced pancreatic adenocarcinoma. Cancer Treat Rev. 1998;24:133–156. doi: 10.1016/s0305-7372(98)90079-2. [DOI] [PubMed] [Google Scholar]


