Abstract
In granular flow operations, often particles are nonspherical. This has inspired a vast amount of research in understanding the behavior of these particles. Various models are being developed to study the hydrodynamics involving nonspherical particles. Experiments however are often limited to obtain data on the translational motion only. This paper focusses on the unique capability of Magnetic Particle Tracking to track the orientation of a marker in a full 3‐D cylindrical fluidized bed. Stainless steel particles with the same volume and different aspect ratios are fluidized at a range of superficial gas velocities. Spherical and rod‐like particles show distinctly different fluidization behavior. Also, the distribution of angles for rod‐like particles changes with position in the fluidized bed as well as with the superficial velocity. Magnetic Particle Tracking shows its unique capability to study both spatial distribution and orientation of the particles allowing more in‐depth validation of Discrete Particle Models. © 2017 The Authors AIChE Journal published by Wiley Periodicals, Inc. on behalf of American Institute of Chemical Engineers AIChE J, 63: 5335–5342, 2017
Keywords: noninvasive experimental techniques, granular flow, nonspherical particles, rotation, translation
Introduction
The various applications of fluidized beds in chemical and process industries have resulted in a vast amount of research and literature to understand the complex hydrodynamics. Because of the sheer size of industrial fluidized beds, research has long been restricted to small lab scale experimental studies. These experiments1 often are restricted to pseudo 2‐D systems for visual access,2, 3 or the use of probes that disturb local flow phenomena or expensive 3‐D particle tracking4, 5 or tomographic techniques.6
Since the 1990's however the use of computer simulations have extended the capabilities of research beyond the lab scale. The Discrete Particle Model (DPM) has gained a lot of interest due to its capability to represent the key features of particulate flows more accurately. As such, the amount of research has grown explosively, as exemplified by the review articles of Zhu et al.7 and Deen et al.8 So far most of the research focused on spherical particles, for which the interaction forces, that is, drag and contact forces, are relatively well defined.
As roughly a decade the focus has slowly shifted to study nonspherical particles. Especially, the number of papers on Discrete Element Modeling (DEM) has grown exponentially.9 The collision detection for particles of arbitrary shape and size poses a big challenge. To avoid increasing complexity even further, most of the research has focused on granular flow only, without gas or liquid interactions. When introducing a fluid, particle‐fluid interactions such as drag10 and the different lift forces have to be incorporated,11 all of which strongly depend on the relative orientation, local packing structure and mutual alignment.
Experimental validation of these models is important to enhance our understanding of the key parameters for the developed models. The number of techniques that are capable of measuring rotation or orientation of particles however is limited. A multipositron emission particle tracking (multi‐PEPT) method was used to study the rotation of 12 mm cube particles.12 Zhang et al.13, 14 have used a combination of Infrared imaging and a microwave heater to study a single cylindrical tracer in a fluidized bed. particle tracking velocimetry (PTV) is quite often used to study the rotation and orientation of particles.15, 16, 17 Vollmari et al.18, 19 reported a quite elaborate study on nonspherical particles, studying the pressure drop and orientation of different shapes of particles.
Recently, a novel magnetic particle tracking (MPT) technique was developed as a safer and less expensive particle tracking technique. MPT uses a single tracer particle that has a dipole, which allows for detection of the particle position and orientation. It has already been used to study granular flow in a rotating drum,20 a fluid dynamically downscaled fluidized bed,21 spouted beds22 and fluidized beds.23, 24 In Buist et al.,25 we have already shown and compared the rotation behavior of spheres in a pseudo 2‐D fluidized bed, using MPT and DPM. In this study, we will show the strength of the MPT to study orientation and rotation of nonspherical particles in a cylindrical fluidized bed.
The outline of this work is as follows; first the Magnetic Particle Tracking technique is shortly introduced. Subsequently, the setup and particles are discussed. Finally results on the translation, rotation, and orientation of the different types of particles in a gas fluidized bed are discussed.
Magnetic particle tracking
Magnetic Particle Tracking is a technique that tracks the magnetic field of a single magnetic tracer. The magnetic field strength is measured with the use of Anisotropic Magnetic Resonance (AMR) sensors. The technique and its performance has been thoroughly discussed in our previous work; Buist et al.24, 25 By positioning multiple AMR sensors around the domain of interest the magnetic field of the marker can be reconstructed, which is given by
| (1) |
is the vector between the particle and sensor position, μm the magnetic moment of the marker, the orientation unit vector of the magnet, which may be characterized through its spherical coordinate system with angles and θ. Figure 1 gives a schematic representation of this technique. The theoretical magnetic field strength at the sensor position and orientation is given by multiplication of Eq. (1) with the orientation vector of the sensor
| (2) |
Figure 1.
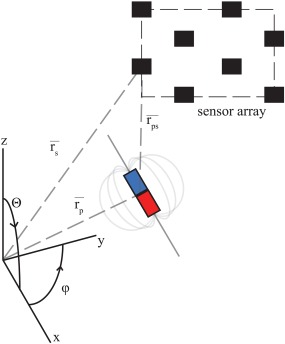
Schematic representation of the principle behind magnetic particle tracking.
The magnetic field measured by the sensors is determined by the relative distance between the tracer and the sensors. As well as the orientations of both the sensor and the particle. [Color figure can be viewed at wileyonlinelibrary.com]
Minimization of the difference of the theoretical field strength with the sensor data (Sm) gives the most probable position and orientation. This is done by minimization of the average probability function over all N sensors
| (3) |
Sequential Quadratic Programming is used to solve the associated minimization problem, which allows for enforcement of constraints on the solution for the marker position
| (4) |
where the value 0.13 corresponds to the inner radius of the sensor array. The orientation is determined by the unit vector, with the following constraints, given in the SQP method
| (5) |
Setup
The particles that have been used in this work all have the same volume and density and are equivalent to 3 mm diameter spheres. Rods with three different aspect ratios have been used, of which the longest two were made by cutting stainless steel 316 welding rods to the desired length. All particles were treated in a tumbler to grind off the sharp edges resulting from the cuts. The smallest aspect ratio rods were manufactured by machine turning 303 stainless steel. The spheres are grinding balls made of stainless steel 304. Because the spheres and smallest aspect ratio rods can be magnetizeable, they were annealed to remove any remaining magnetic properties. The properties of the particles are given in Table 1. Calculation of the minimum fluidization velocity has been performed by determining the pressure drop over the bed as a function of the superficial gas velocity. It must be noted that even though a minimum fluidization velocity for the long rods has been specified, this is actually the onset of channel formation. Figure 2 shows a picture of the spheres and the long aspect ratio rods after annealing. The magnets used in the MPT have the same dimensions as the fluidized bed particles, but are made of Neodymium N50 and have a magnetic moment of 0.014 Am2 with its principle axis aligned along the rod length, the density is roughly 7400 kg∕m3 vs. 8000 kg∕m3 for the stainless‐steel bed material. With this small density difference the magnet is assumed to move with the main flow of the bulk material.
Table 1.
Particle Properties
| Name | Dimensions [mm] | SAE Grade | L/D | Sphericity | umf [m/s] |
|---|---|---|---|---|---|
| Sphere | 3.00 ± 0.01 | 304 | 1 | 1.00 | 2.80 |
| Small rods | 2.00 ± 0.02 x 4.50 ± 0.02 | 303 | 2.25 | 0.82 | 2.47 |
| Medium rods | 1.60 ± 0.02 x 7.0 ± 0.5 | 316 | 4.38 | 0.72 | 2.36 |
| Long rods | 1.20 ± 0.02 x 12 ± 0.5 | 316 | 10 | 0.58 | 2.55 |
Figure 2.

Snapshot of the spheres and long rods, after annealing.
The cylindrical fluidized bed is shown in Figure 3 and the main properties are given in Table 2. The cylindrical fluidized bed consists of a 174 mm internal diameter Perspex tube. The distributor plate is a drilled brass plate with an open structure of 20%. The distributor is made of aluminium. All parts are selected to be nonmagnetizeable. The sensor array is a MagTrack system by Matesy with 72 sensors operating at a sampling frequency of 1000 Hz, the particle position and orientation is sampled at 50 Hz. The entire setup is placed inside a Helmholtz coil which is tuned to generate a magnetic field that exactly counteracts the earth's magnetic field.
Figure 3.
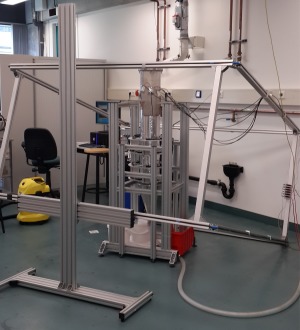
Overview of the 3‐D fluidized setup including the sensor array and Helmholtz coil.
[Color figure can be viewed at wileyonlinelibrary.com]
Table 2.
Properties of the 3‐D–Fluidized Bed[TQ2]
| Internal Diameter | 174 mm |
| Height | 1 m |
| Scaffold | Aluminium |
| Tube | Perspex |
| Distributor plate | |
| Material | Brass |
| Thickness | 3 mm |
| Pore size | 0.9 mm |
| Open area | 20% |
| Mass flow controller | |
| Type | Bronckhorst |
| Max flow rate | 500 m3∕h |
| Max superficial velocity | 5.8 m/s |
Results
For the results of the MPT measurements the spheres and the small and intermediate rods are used. Long aspect ratio rods would not fluidize. Instead, only formation of channels was found, caused by interlocking of the long rods. Five different settings for the gas velocity were chosen with increments of 0.5 m/s above u mf. An initial bed packing with an aspect ratio H/D of 0.75 is used, corresponding to a bed height of roughly 0.13 m. Each experiment is run for 3 h.
Subsequently, we will focus on azimuthally averaged profiles, meaning that we will investigate properties as a function of the radial and vertical position. The occupancy in a grid cell located at a radial position r labeled by i and vertical position h labeled by j is calculated from
and then corrected for the volume of the cell, because the volume of the cell scales with the radial position. The grid size is 1 cm in the radius by 1 cm in height, there are 36 grids along the azimuth. all cells with less than 20 samples have been set to 0. Figure 4 shows the cumulative occupancy along the azimuth for the intermediate rods at the highest gas flow rate. A more or less even distribution of particles is found along the radius of the bed, extending to roughly 20 cm above the distributor plate and gradually decaying toward the freeboard. A similar profile was obtained for the spheres and thus not shown here. The bed expansion is roughly a factor 1.5 for the rods and 1.25 for the spheres.
Figure 4.
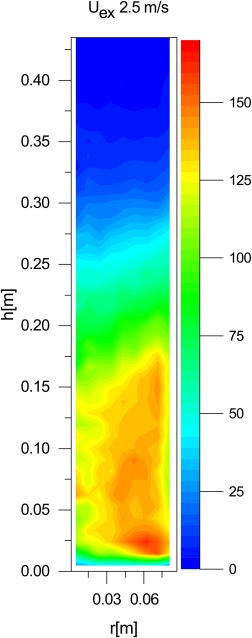
Azimuthal profile of the occupancy in the cylindrical fluidized bed at 2.5 m/s above umf, for the intermediate rods.
[Color figure can be viewed at wileyonlinelibrary.com]
Linear velocity distribution
Figures 5 and 6 show the profiles of the vertical velocity for the two types of particles at 1 and 2.5 m/s above u mf. It is remarkable to note that the circulation patterns for the rods in Figure 6 are inverted. At 1 m/s above u mf the rods move upward near the wall and downward near the centre of the fluidized bed, while at 2.5 m/s above u mf the rods move upward near the centre of the bed and downward near the wall. At 2.5 m/s above u mf a double circulation pattern is obtained. This inversed flow profile was also discussed in the work of Kunii and Levenspiel.26 For shallow beds and at low excess gas velocity down flow of solids in the centre was found, which disappeared at higher superficial gas flow rates. The double circulation pattern for spherical particles was also found in Two‐Fluid simulations of Verma et al.27 and experiments of Laverman et al.4
Figure 5.
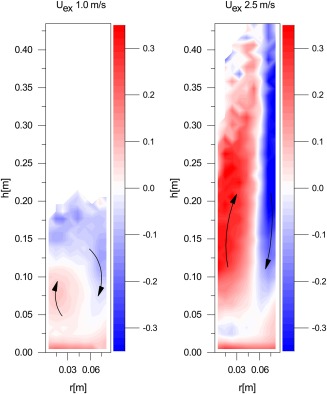
Azimuthally averaged vertical velocity (m/s) profiles for the spheres in a cylindrical fluidized bed at 1 and 2.5 m/s above umf, respectively.
Arrows indicate main direction of flow. [Color figure can be viewed at wileyonlinelibrary.com]
Figure 6.
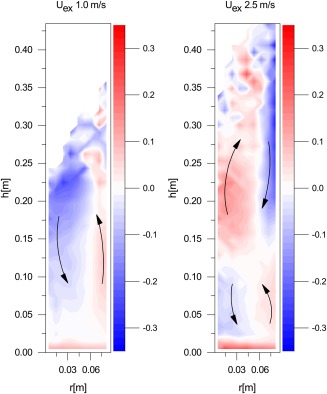
Azimuthally averaged vertical velocity (m/s) profiles for the intermediate rods in a cylindrical fluidized bed at 1 and 2.5 m/s above umf, respectively.
Arrows indicate main direction of flow. [Color figure can be viewed at wileyonlinelibrary.com]
The spheres in Figure 5 show an upward velocity near the centre and a downward velocity near the wall for both 1.0 and 2.5 m/s above umf. The absolute velocities for the circulation patterns are higher and the double circulation pattern at 2.5 m/s is less pronounced, but in agreement with the work of Laverman et al.4
Figure 7 shows the height averaged vertical velocity component, where an occupancy weighted average was evaluated. The averaged velocity profiles of the rods are very close to zero. At low velocities above u mf an inverted profile is seen with upward flow near the wall and downward flow near the centre. At higher velocities, a transition to the “normal” circulation pattern is found. However, because of a strong double circulation pattern the absolute magnitude of the averaged velocities is small. For spheres a strong pattern is only seen for 1.5 m/s above u mf and higher. This is possibly related to the transition from a “normal” to an inverted flow profile.
Figure 7.
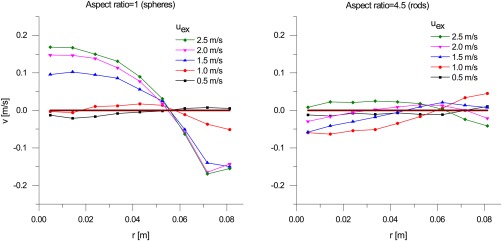
Height‐averaged vertical velocity component along the radial positions, at different excess gas velocity for the spheres and the intermediate rods.
[Color figure can be viewed at wileyonlinelibrary.com]
Rotational velocity distribution
Figure 8 shows the azimuthally averaged distribution of the magnitude of the rotational velocity for the spherical and cylindrical particles fluidized at 2.5 m/s excess gas velocity. Here, we have probed the angular velocity magnitude for rotations around two axes perpendicular to the magnetic dipole orientation , that is, we ignored the spin around . The overall magnitude of this rotational velocity is in the range of 1 to 2 rot/s which is somewhat lower than observed in a pseudo 2‐D setup as in our previous work,25 this is related to the large contributions of the wall on the rotational velocity. This is confirmed by the slightly higher rotational velocity near the bottom and the walls for both spherical and cylindrical particles. It is however remarkable to see that the spheres tend to rotate faster in the bulk than in the freeboard, that is, rotation is governed by particle–particle or particle‐wall interactions. Conversely, the cylinders tend to rotate more in the freeboard region and have a distinctly lower averaged rotational velocity in the bulk, that is, the rotation of cylinders in the bulk seems hampered by the particle–particle interactions through either interlocking of the mass or mutual alignment of the particles.
Figure 8.
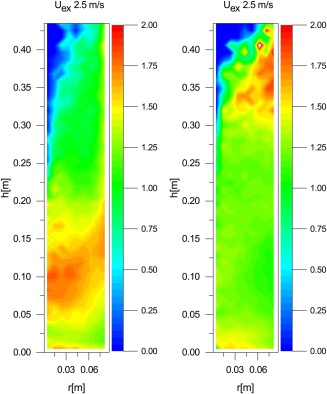
Azimuthally averaged rotational velocity magnitude (rot/s), for the spherical particles (left) and the cylindrical particles (right), fluidized at uex=2.5 m/s.
[Color figure can be viewed at wileyonlinelibrary.com]
Angular distribution
The distribution of the orientation angles of the spheres is very similar to the ideal randomly profile for a sphere and is therefore not shown here. The distribution for the rods is far more interesting however. The polar angle θ ranges from 0 to 180, as shown in Figure 1, with 0 and 180 being upright and 90 being flat. Because the angles take into account the direction of the two poles, and the system feels no effect of the earth's magnetic field, the profiles should be symmetric along 90°. To emphasize this symmetry, we consider the inclination angle Θ, defined as 90–θ, and take its absolute value in the evaluation of averages. Figure 9 shows the averaged absolute inclination angle at different locations in the bed at an excess velocity of 1 m/s. Near the bottom, particles have an averaged angle closer to 0 indicating a horizontal position, that is, aligned with the bottom. Near the walls, the averaged angle is larger than 32.6° indicating a preference for a vertical alignment, and thus an alignment with the wall. In the centre of the bed, the averaged angle is somewhere in between but also smaller than 32.6°, so a slight preference for a horizontal alignment is seen. Where the orientation is averaged along the height the preferred alignment with the wall and the preferred angle of the bulk and bottom is shown even more clearly. The red line at 32.6° indicates the expected averaged angle for a random orientation distribution (behavior of spheres).
Figure 9.
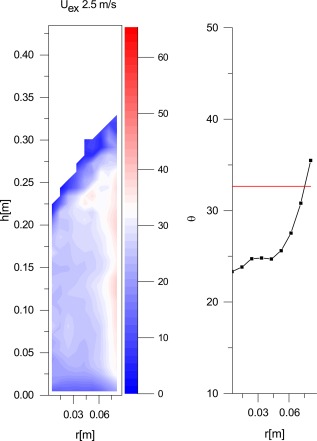
Azimuthally averaged inclination angle Θ (left) and height averaged inclination angle (right) at uex 1 m/s. Note that θ = 0 is defined as a particle oriented in the horizontal plane.
[Color figure can be viewed at wileyonlinelibrary.com]
The histogram of the inclination angles (before taking the absolute value) for the different excess gas velocities is given in Figure 10 and shows another interesting phenomenon. At low excess gas velocities, the rods show a preference to lie flat while at higher gas velocities the rods show a preference for an upright position. It might be that at lower gas velocities a larger part of the bed is mostly at rest or gently fluidizing with most of the rods lying flat. At higher velocities, the bed behaves more chaotic and the particles want to align with the wall and/or with the direction of the flow.
Figure 10.
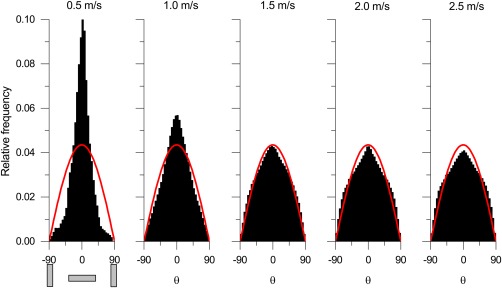
Distribution of the inclination angle for the intermediate rods at different excess gas velocities.
The red lines indicate the random distribution for a sphere.25 Orientations of 0 and ±90° are indicated below the first figure. [Color figure can be viewed at wileyonlinelibrary.com]
Conclusions
Magnetic Particle Tracking is a very powerful technique to study both particle translation and rotation in a full 3‐D cylindrical fluidized bed. With this technique new reference data has been generated for validation of CFD‐DEM models.28 It is expected that the effects of drag,10 hydrodynamic torque11 and particle–particle and particle‐wall interactions will largely effect the appropriateness of these models,25 which can now be validated with this technique. The fluidization and orientational behavior of spheres and rods equal in volume but with a respective aspect ratio of 1 and 4.5 were studied. The particles show a tendency to evenly distribute in the fluidized bed with an inverted circulation pattern at low excess gas velocities and a regular circulation pattern at higher velocities. The transition between the normal and inverted circulation pattern seems to occur later for rod‐like particles.
The rotational velocity of the particles is in the order of 1–2 rotations per second, which is slightly lower than the behavior in the pseudo 2‐D system. The spheres tend to rotate more pronounced in the dense zone, governed by the particle–particle interactions, while the cylinders rotate mostly in the freeboard, unhindered by the presence of other particles.
The orientation of the particles was also tracked. The distribution of the inclination angles of the spheres was unaffected by alignment with the geometry of the system, just as in our previous work.25 The distribution of inclination angles for the rods however was distinctly different, with a tendency to align with the bed bottom and wall. Also, an effect of the superficial gas velocity on the orientation distribution was found. At higher gas velocities, the particles tend to align more vertically, while at lower gas velocities the particles tend to align horizontally.
Notations
Roman symbols
- d
diameter, cm
- e
orientation unit vector
- r
position vector, m
- x, y, z
position, m
- u
velocity, m/s
- N
Number of
- L
length, m
- O
Occupancy
- P
probability
- W
width of the bed in pixels
- H
magnetic field, A/mHeight, m
- S
Sensor signal, A/m
Greek symbols
- μ
magnetic moment, Am 2
azimuthal angle, °
- σ
standard deviation, °
- Θ
inclination angle, °
- θ
inclination angle, °
Abbreviations and subscripts
- MPT
Magnetic Particle Tracking
- DPM
Discrete Particle Model
- PTV
Particle Tracking Velocimetry
- PEPT
Positron Emission Particle Tracking
- mf
minimum fluidization
- ex
excess
- i,j
counter
- p
particle
- s
sensor
- t
theory
- c
cells
Acknowledgments
This research was funded by the European Research Council, under the Advanced Investigator Grant Scheme, contract no. 247298 (Multiscale Flows), and the Consolidator Grant Scheme, contract no. 615906 (NonSphereFlow). This contribution was identified by Kuochen Tsai (Shell) as the Best Presentation in the session “Circulating fluidized bed and measurement techniques in fluid‐particle systems (03B03)” of the 2016 AIChE Annual Meeting in San Francisco."
References
- 1. Chaouki J, Larachi F, Dudukovic MP. Non‐Invasive Monitoring of Multiphase Flows. Amsterdam: Elsevier, 1997. [Google Scholar]
- 2. de Jong JF, Odu SO, Van Buijtenen MS, Deen NG, Van Sint Annaland M, Kuipers JAM. Development and validation of a novel digital image analysis method for fluidized bed particle image velocimetry. Powder Technol. 2012;190:193–202. [Google Scholar]
- 3. Van Buijtenen MS, Börner M, Deen NG, Heinrich S, Antonyuk S, Kuipers JAM. An experimental study of the effect of collision properties on spout fluidized bed dynamics. Powder Technol. 2011;206(1):139–148. [Google Scholar]
- 4. Laverman JA, Fan X, Ingram A, van Sint Annaland M, Parker DJ, Seville JPK, Kuipers JAM. Experimental study on the influence of bed material on the scaling of solids circulation patterns in 3d bubbling gas–solid fluidized beds of glass and polyethylene using positron emission particle tracking. Powder Technol. 2012;224:297–305. [Google Scholar]
- 5. Larachi F, Chaouki J, Kennedy G. 3‐d mapping of solids flow fields in multiphase reactors with rpt. AIChE J. 1995;41(2):439–443. [Google Scholar]
- 6. Newton D, Fiorentino M, Smith GB. The application of x‐ray imaging to the developments of fluidized bed processes. Powder Technol. 2001;120(1):70–75. [Google Scholar]
- 7. Zhu HP, Zhou ZY, Yang RY, Yu AB. Discrete particle simulation of particulate systems: theoretical developments. Chem Eng Sci. 2007;62(13):3378–3396. [Google Scholar]
- 8. Deen N, Van Sint Annaland M, Van der Hoef M, Kuipers JAM. Review of discrete particle modeling of fluidized beds. Chem Eng Sci. 2007;62(1):28–44. [Google Scholar]
- 9. Lu G, Third JR, Müller CR. Discrete element models for non‐spherical particle systems: from theoretical developments to applications. Chem Eng Sci. 2015;127:425–465. [Google Scholar]
- 10. Hölzer A, Sommerfeld M. New simple correlation formula for the drag coefficient of non‐spherical particles. Powder Technol. 2008;184(3):361–365. [Google Scholar]
- 11. Zastawny M, Mallouppas G, Zhao F, Van Wachem B. Derivation of drag and lift force and torque coefficients for non‐spherical particles in flows. Int J Multiphase Flow. 2012;39:227–239. [Google Scholar]
- 12. Yang Z, Fan X, Bakalis S, Parker D, Fryer P. A method for characterising solids translational and rotational motions using multiple‐positron emission particle tracking (multiple‐pept). Int J Multiphase Flow. 2008;34(12):1152–1160. [Google Scholar]
- 13. Zhang Y, Zhong W, Jin B. Experimental investigation on the translational and rotational motion of biomass particle in a spout‐fluid bed. Int J Chem Reactor Eng. 2013;11(1):453–468. [Google Scholar]
- 14. Zhong W, Zhang Y, Jin B. Novel method to study the particle circulation in a flat‐bottom spout‐fluid bed. Energy Fuels. 2010;24(9):5131–5138. [Google Scholar]
- 15. Wu X, Wang Q, Luo Z, Fang M, Cen K. Rotation speed measurement of moving particles in a CFB riser. Particuology. 2009;7(4):238–244. [Google Scholar]
- 16. Cai J, Li Q, Yuan Z. Orientation of cylindrical particles in gas–solid circulating fluidized bed. Particuology. 2012;10(1):89–96. [Google Scholar]
- 17. Zitoun KB, Sastry SK, Guezennec Y. Investigation of three dimensional interstitial velocity, solids motion, and orientation in solid–liquid flow using particle tracking velocimetry. Int J Multiphase Flow. 2001;27(8):1397–1414. [Google Scholar]
- 18. Vollmari K, Jasevičius R, Kruggel‐Emden H. Experimental and numerical study of fluidization and pressure drop of spherical and non‐spherical particles in a model scale fluidized bed. Powder Technology. 2015a;291:506–521. [Google Scholar]
- 19. Vollmari K, Oschmann T, Wirtz S, Kruggel‐Emden H. Pressure drop investigations in packings of arbitrary shaped particles. Powder Technol. 2015b;271:109–124. [Google Scholar]
- 20. Neuwirth J, Antonyuk S, Heinrich S, Jacob M. CFD‐DEM study and direct measurement of the granular flow in a rotor granulator. Chem Eng Sci. 2013;86:151–163. [Google Scholar]
- 21. Sette E, Pallarès D, Johnsson F, Ahrentorp F, Ericsson A, Johansson C. Magnetic tracer‐particle tracking in a fluid dynamically down‐scaled bubbling fluidized bed. Fuel Process Technol. 2015;138:368–377. [Google Scholar]
- 22. Mohs G, Gryczka O, Heinrich S, Mörl L. Magnetic monitoring of a single particle in a prismatic spouted bed. Chem Eng Sci. 2009;64(23):4811–4825. [Google Scholar]
- 23. Halow J, Holsopple K, Crawshaw B, Daw S, Finney C. Observed mixing behavior of single particles in a bubbling fluidized bed of higher‐density particles. Ind Eng Chem Res. 2012;51(44):14566–14576. [Google Scholar]
- 24. Buist KA, Gaag AC, Deen NG, Kuipers JAM. Improved magnetic particle tracking technique in dense gas fluidized beds. AIChE J. 2014;60(9):3133–3142. [Google Scholar]
- 25. Buist KA, van Erdewijk TW, Deen NG, Kuipers JAM. Determination and comparison of rotational velocity in a pseudo 2‐d fluidized bed using magnetic particle tracking and discrete particle modeling. AIChE J. 2015;61(10):3198–3207. [Google Scholar]
- 26. Kunii D, Levenspiel O. Fluidization Engineering, 2nd ed. Boston: Butterworth‐Heinemann, 1991. [Google Scholar]
- 27. Verma V, Deen NG, Padding JT, Kuipers JAM. Two‐fluid modeling of three‐dimensional cylindrical gas–solid fluidized beds using the kinetic theory of granular flow. Chem Eng Sci. 2013;102:227–245. [Google Scholar]
- 28. Mema I, Mahajan VV, Fitzgerald BW, Kuipers JAM, Padding JT. Effect of lift force on dense gas‐solid fluidized beds of non‐spherical particles. Proceedings of the 12th International Conference on CFD in Oil & Gas, Metallurgical and Process Industries, Trondheim, 2017:71–79.


