

Abstract
Plasma membrane (PM) localization of Ras proteins is crucial for transmitting signals upon mitogen stimulation. Post-translational lipid modification of Ras proteins plays an important role in their recruitment to the PM. Electrostatic interactions between negatively charged PM phospholipids and basic amino acids found in K-Ras4B (K-Ras) but not in H-Ras are important for permanent K-Ras localization to the PM. Here, we investigated how acute depletion of negatively charged PM polyphosphoinositides (PPIns) from the PM alters the intracellular distribution and activity of K- and H-Ras proteins. PPIns depletion from the PM was achieved either by agonist-induced activation of phospholipase C β or with a rapamycin-inducible system in which various phosphatidylinositol phosphatases were recruited to the PM. Redistribution of the two Ras proteins was monitored with confocal microscopy or with a recently developed bioluminescence resonance energy transfer-based approach involving fusion of the Ras C-terminal targeting sequences or the entire Ras proteins to Venus fluorescent protein. We found that PM PPIns depletion caused rapid translocation of K-Ras but not H-Ras from the PM to the Golgi. PM depletion of either phosphatidylinositol 4-phosphate (PtdIns4P) or PtdIns(4,5)P2 but not PtdIns(3,4,5)P3 was sufficient to evoke K-Ras translocation. This effect was diminished by deltarasin, an inhibitor of the Ras–phosphodiesterase interaction, or by simultaneous depletion of the Golgi PtdIns4P. The PPIns depletion decreased incorporation of [3H]leucine in K-Ras–expressing cells, suggesting that Golgi-localized K-Ras is not as signaling-competent as its PM-bound form. We conclude that PPIns in the PM are important regulators of K-Ras–mediated signals.
Keywords: bioluminescence resonance energy transfer (BRET), G protein-coupled receptor (GPCR), Golgi, GTPase Kras (KRAS), phosphoinositide
Introduction
The interaction of intracellular signaling proteins with the hydrophobic membranes of eukaryotic cells is critical for the signaling competence of these proteins. In the case of the peripheral PM3 proteins, such interaction with the PM can occur via different mechanisms. Proteins that contain an amphipathic α-helix or hydrophobic loops can directly penetrate into the inner surface of the membrane. Others, however, do not contain enough clustered hydrophobic amino acids to maintain a stable membrane interaction. In this case, other mechanisms are necessary to attach the protein to the PM. Many signaling proteins undergo post-translational lipid modifications, attaching a myristoyl, palmitoyl, or prenyl group on specific amino acid residues. These modifications provide the lipophilicity of the proteins ensuring proper PM localization (1).
Ras protein mutations are one of the most common causes in cancer and hence have attracted a lot of attention. These small globular proteins are molecular switches that change conformation upon GTP binding relative to their GDP-bound forms (2, 3). Their C termini contain their localization signal providing for membrane attachment due to post-translational modifications. Numerous oncogenic mutations of Ras proteins have been identified, many of which affect GTP binding of these proteins, but naturally occurring mutations in the C-terminal anchoring domains have not been reported yet, showing the uniquely significant role of this conserved essential segment in Ras protein functions (4). H-Ras proteins undergo two lipid modifications: in addition to their C-terminal prenylation, they are also palmitoylated in their C-terminal tails (5). In contrast, K-Ras proteins contain only the prenyl modification, and their PM anchoring is highly dependent on a polybasic amino acid sequence as a “second signal” located in their C-terminal tails (6). Previous studies have shown that changing the positively charged amino acids to neutral amino acids by site-directed mutagenesis can fully abolish the PM localization of the K-Ras protein. Such mutated K-Ras proteins show nonspecific endomembrane localization similar to that of proteins that have only a prenyl or myristoyl group as targeting signals (7–9).
At cytoplasmic pH, the cytosolic face of the PM is enriched in two types of anionic phospholipids. Phosphatidylserine (PS) is the most abundant anionic phospholipid, amounting to 3–10% of the total phospholipid pool of the cells (10) found in the inner leaflet of the PM. The other is the various polyphosphoinositides (PPIns) that account for less than 1% of total anionic phospholipids (11). Although PS is found in a relative high amount in the PM, providing the bulk negativity for the inner leaflet of the membrane (12), its precise role in controlling cellular processes is vastly underexplored. In contrast, the impact of the PPIns in the regulation of a variety of cellular processes is well-established. Of the three PPIns, phosphatidylinositol 4-phosphate (PtdIns4P) and phosphatidylinositol 4,5-bisphosphate (PtdIns(4,5)P2) equally share the majority role, whereas phosphatidylinositol 3,4,5-trisphosphate (PtdIns(3,4,5)P3) is present only in a very small amount even in stimulated cells. Although these lipids have substantial roles in the regulation of ion channels, cell motility, and vesicular trafficking and they also represent molecular clues for targeting signaling proteins to membranes (13–15), their contribution to the regulation of some important pathways is not fully explored.
In this study, we investigated how the rapid depletion of PM PPIns can regulate the intracellular distribution of lipid-anchored PM proteins, namely the K- and H-Ras proteins. Using a bioluminescence resonance energy transfer (BRET)-based method suitable to monitor the movement of PM-bound proteins after they are released from the PM, we show the translocation of K-Ras or its isolated targeting sequence to either the endoplasmic reticulum (ER) or Golgi upon rapid PM PPIns depletion. The method is highly sensitive, can be easily quantified, and therefore allows the comparison of the involvement of the various PPIns in the PM localization of the Ras proteins. This analysis also reveals that PM PPIns depletion significantly attenuates the proliferation of the cells expressing constitutively active K- but not H-Ras mutants, which highlights the different functional role of the PPIns-dependent PM anchoring in K-Ras and H-Ras signaling.
Results
Energy transfer-based monitoring of the intracellular movement of peripheral proteins bound to the cytoplasmic surface of the PM
We designed several constructs to target the Venus protein to the inner leaflet of the PM using targeting signal sequences either added to the N or C termini of the fluorescent protein (Fig. 1A). These included the N-terminal 14 amino acids of Lyn kinase, which has a single palmitoyl and single myristoyl modification (Lyn(1–14)-Venus), the N-terminal 10 amino acids of Lck kinase, which has a double palmitoyl and a single myristoyl residue (Lck(1–10)-Venus), and the N-terminal 15 amino acids of c-Src kinase, which contains only a single myristoyl (c-Src(1–15)-Venus). As for C-terminal signal sequences, we used the C-terminal 22 residues of K-Ras modified by prenylation (Venus-K-Ras-CAAX) or the C-terminal 22 amino acid signal sequence of H-Ras, which possesses double palmitoylation and prenylation (Venus-H-Ras-CAAX). Notably, in addition to the lipid modification, the targeting sequences of c-Src and K-Ras also contained a number of positively charged amino acids. As expected and shown previously by various reports (14, 16, 17), transient expression of all of these constructs in HEK 293T cells labeled the PM (Fig. 1A). Importantly, most of the constructs also displayed a small but consistent endomembrane localization, the amount of which was minimal relative to the total amount of the proteins.
Figure 1.

Constructs and molecular approach used in the study. A, N- or C-terminal target sequences of various proteins were used to generate PM-localized Venus proteins. The top panel shows the targeted Venus proteins in a schematic drawing. The table demonstrates the sequences and the type of lipid modifications of the applied targeting signals. The amino acids are highlighted in the sequences where the distinct modifications occur. Palmitoylation (blue) occurs on cysteine residues without a preference of placement, myristoylation (green) always occurs on the N-terminal glycine residues after the first methionine, and prenylation (brown) occurs on the C-terminal half of the proteins within the CAAX domain. Polybasic cluster regions are highlighted in red in the c-Src(1–15) and K-Ras-CAAX constructs. * and ** represent the number of the indicated modifications, which are occurring on the dedicated residues in the targeting sequence. Confocal images reveal the intracellular localization of the PM-targeted Venus proteins transiently expressed in HEK 293T cells. B, schematic illustration of the proposed BRET measurements used to follow the intracellular trafficking of the PM-bound Venus constructs after their release from the PM. C, localization sequences or full-length proteins were used to target the luciferase enzyme to the cytoplasmic surface of various endomembrane (EM) compartments (Golgi, trans-Golgi compartment; mito, mitochondrion; EE, early endosome). To verify their proper endomembrane localization with confocal microscopy, HEK 293T cells were transiently transfected with constructs in which luciferase was replaced by Cerulean.
Recently we developed a BRET-based method monitoring the proximity of luciferase-tagged PM receptors and the Venus protein targeted to the surface of various intracellular organelles. This method was successfully used to follow the intracellular trafficking route of G protein–coupled receptors from the PM to different intracellular compartments (18, 19). To investigate the dynamic changes of the membrane localization of peripheral membrane proteins that bind the PM and follow their intracellular fates, we utilized the same approach with some modifications. The most important modification was that now we targeted the luciferase enzyme itself to the cytoplasmic surface of the different intracellular organelles to serve as donor and used the Venus protein tagged with the various PM-targeting sequences (see above) as the acceptor (Fig. 1B).
Moreover, we used an improved version of Renilla luciferase and fused it to well-characterized resident protein sequences defining various organelles. These included targeting sequences of TGN38 (N-terminal target of the full-length protein) for Golgi, TOM70 (N-terminal amino acids 1–30) for mitochondria, Sac1 (C-terminal amino acids 521–58) for ER, and EEA1 (amino acids 1253–1411 that correspond to its FYVE (Fab1/YOTB/Vac1/EEA1) domain) for early endosomes (Fig. 1C). To validate proper localization, luciferase enzyme was replaced by Cerulean in all of the constructs, and the constructs were expressed in HEK 293T cells to confirm their proper localization (Fig. 1C).
Acute manipulation of PM PPIns pools
To achieve the PM PPIns depletion, a previously described rapamycin-induced heterodimerization system was used (20). In most of the experiments, the FKBP-fused version of the bifunctional phosphatase pseudojanin (PJ) containing a 4- and a 5-phosphatase domain (15). FRB was targeted to the PM using the targeting sequence of the Lck protein (Fig. 2A). When the role of PtdIns(3,4,5)P3 was studied, a low (100 nm) concentration of wortmannin was used to inhibit class I PtdIns 3-kinase activity.
Figure 2.

PM PPIns depletion achieved via rapamycin-induced recruiting of the bifunctional PPIns phosphatase PJ or by using the PI3K inhibitor wortmannin. A, schematic representation of the PM PPIns depletion system. After rapamycin treatment, the cytoplasmic, FKBP-fused bifunctional phosphatase PJ binds to the PM-anchored FRB. The recruitment of PJ is expected to cause a rapid degradation of the PM PPIns, resulting in low levels of polyphosphorylated forms (PtdIns4P, PtdIns(4,5)P2, and PtdIns(3,4,5)P3) and concomitant elevation of PtdIns. Wortmannin (100 nm) inhibits PI3K activity and therefore is suitable to prevent the phosphorylation of PtdIns(4,5)P2 to PtdIns(3,4,5)P3. B, monitoring of the PM PPIns levels using fluorescently tagged specific lipid-binding domains as lipid sensors. The confocal images were collected from transiently transfected HEK 293T cells expressing the proteins of the lipid depletion system (PM-FRB and mRFP-FKBP-PJ) and the specific lipid sensors, SidM-2xP4M tagged with Cerulean (left) and the PLCδ1-PH domain tagged with Venus (middle) recognizing PM PtdIns4P and PtdIns(4,5)P2, respectively. After rapamycin (300 nm) treatment, the cytoplasmic bifunctional phosphatase PJ is recruited to the PM, whereas the lipid-binding domains are released from the PM, indicating effective PM PPIns depletion. The images were collected before and after the addition of rapamycin (300 nm; 5 min). Note that the SidM-2xP4M domain recognized PtdIns4P pools throughout the cells; therefore it became mostly Golgi-localized after depleting PM PtdIns4P pools. Cells are representatives of at least 10 measurements carried out in three independent experiments. C, monitoring of the PPIns levels using recently developed specific BRET-based biosensors capable of measuring PM lipid levels (24). The measurements were carried out on transiently transfected HEK 293T cells expressing the proteins of the depletion system (PM-FRB and mRFP-FKBP-PJ) and the various biosensors, L10-Venus-T2A-Luc-SidM-2xP4 for PM PtdIns4P, L10-Venus-T2A-PLCδ1-PH-Luc for PM PtdIns(4,5)P2, and L10-Venus-T2A-Btk-PH-Luc for PM PtdIns(3,4,5)P3 measurements. Wm was applied at a concentration of 100 nm at which it inhibits PI3K but not PI4Ks. The lipid depletion system was activated by 300 nm rapamycin. BRET ratio values were normalized (nBRET) by considering the resting ratio as 100% and the complete lack of energy transfer as 0% (see details of the calculation under “Experimental procedures”). Data are means of three independent experiments. Error bars represent S.E.
Effects of these manipulations on PM PPIns levels were validated using specific biosensors based on the following lipid-binding domains: SidM-2xP4M as the PtdIns4P sensor (21), PLCδ1-PH as the PtdIns(4,5)P2 sensor (22), and Btk-PH as the PtdIns(3,4,5)P3 sensor (23). As shown on Fig. 2B by confocal microscopy in HEK 293T cells, rapamycin-induced PJ recruitment resulted in the decrease in both PtdIns4P and PtdIns(4,5)P2 levels. This was confirmed by using the more quantitative BRET-based biosensors (24). Recruitment of PJ enzymes of various activities with 300 nm rapamycin resulted in a rapid decrease of the PM PtdIns4P, PtdIns(4,5)P2, and PtdIns(3,4,5)P3 (Fig. 2C, red curves). Wortmannin pretreatment did not affect the PM PtdIns4P or PtdIns(4,5)P2 but induced maximal depletion of PM PtdIns(3,4,5)P3. Notably, wortmannin treatment reduced PM PtdIns(3,4,5)P3 to a lower level than the rapamycin-induced depletion of its precursor, PtdIns(4,5)P2, indicating that the removal of the PtdIns(3,4,5)P3 precursor may not have been complete and that the inhibition of the PI3K enzyme is more effective under these conditions. Although these results were mostly confirmatory of previous similar studies, they were important for proper evaluation of the subsequent experiments.
PM PPIns depletion evokes the redistribution of the polybasic peripheral proteins from the PM to the Golgi
Hammond et al. (15) found that peripheral proteins containing positively charged amino acids are released from the PM after combined PtdIns4P and PtdIns(4,5)P2 depletion. To investigate this phenomenon in further details using the various PM-targeted Venus constructs, we initially performed confocal measurements. As shown on Fig. 3A, depletion of PM PtdIns4P, PtdIns(4,5)P2, and PtdIns(3,4,5)P3 levels by the addition of rapamycin clearly reduced the PM localization of Venus-K-Ras-CAAX, whereas the localization of the other PM-targeted Venus constructs (Lyn(1–14)-Venus, Lck(1–10)-Venus, and Venus-H-Ras-CAAX) remained unchanged (Fig. 3A). In the case of c-Src(1–15)-Venus, the reduction of PM localization is not so clear, but there is a tendency of the fluorescent signal to show an endomembrane pattern upon rapamycin treatment (Fig. 3A).
Figure 3.

Effect of PM PPIns depletion on the rearrangement of various PM-targeted Venus proteins. A, monitoring of the translocation of various PM-targeted Venus constructs in transiently transfected HEK 293T cells also expressing the proteins of the lipid depletion system (PM-FRB and mRFP-FKBP-PJ). Confocal images were taken before and after the rapamycin treatment (300 nm; 5 min). Cells are representatives of at least 10 measurements carried out in three independent experiments. B–D, BRET measurements to examine the interaction between various PM-targeted Venus proteins and Luc-ER (B), between K-Ras-CAAX-tagged Venus and early endosome-targeted (Luc-EE), mitochondrion-targeted (Mito-Luc), and Golgi-Luc luciferase constructs (C), and between H-Ras-CAAX-tagged Venus and Golgi-Luc (D). The measurements were carried out on transiently transfected HEK 293T cells also expressing the proteins of the depletion system (PM-FRB-mRFP and mRFP-FKBP-PJ). The lipid depletion system was activated by 300 nm rapamycin. BRET ratio values are expressed as the difference between rapamycin-treated and vehicle (DMSO)-treated cells. Data are means of three independent experiments. Error bars represent S.E. Statistical analysis was performed using t test to compare the mean of the last three data points before and after the stimulation. *, p < 0.05; ***, p < 0.001; ns, non-significant. a.u., arbitrary units.
To obtain more information about the fate of the proteins after their release from the PM, we next performed BRET measurement between the proteins and various intracellular organelles. First, we used HEK 293T cells coexpressing endoplasmic reticulum-targeted luciferase construct (Luc-ER), the components of the lipid depletion system, and the PM-targeted Venus proteins. Because the ER has a large surface, we reasoned that proteins released from the PM would generate a signal with the ER-targeted luciferase. As shown in Fig. 3B, upon PM PPIns depletion, we did detect increased energy transfer in cells expressing the Venus-K-Ras-CAAX or c-Src(1–15)-Venus constructs (2.73 × 10⁻² ± 0.723 × 10⁻², p < 0.001 and 1.61 × 10⁻² ± 0.284 × 10⁻², p = 0.027, respectively). There was no significant change, however, in the case of the other PM targeting sequences.
Next, we investigated whether these two targeting motifs can generate energy transfer with luciferase targeted to the surface of other organelles. As shown in Fig. 3C, releasing Venus-K-Ras-CAAX from the PM generated a significant increase in the BRET signal in the Golgi (9.0 × 10⁻² ± 0.256 × 10⁻², p = 0.001) but not in early endosomes. In the case of the mitochondria, we detected a very small but still significant increase (0.712 × 10⁻² ± 0.15 × 10⁻², p = 0.026). c-Src(1–15)-tagged Venus resulted in a similar change (data not shown). Importantly, we did not detect any interaction between trans-Golgi-targeted luciferase (Golgi-Luc) and Venus-H-Ras-CAAX after PM PPIns depletion (Fig. 3D).
As an important control experiment, we determined that PM PPIns depletion did affect the localization of the organelle-targeted luciferases. As shown in supplemental Fig. S1, confocal microscopy did not reveal any detectable change in the localization of the constructs (here luciferase was replaced by Cerulean).
Translocation of Venus-K-Ras-CAAX from the PM to the Golgi happens through the cytoplasm and depends on the Golgi PtdIns4P level
Previous studies have shown that rather than using vesicle trafficking the K-Ras proteins move between intracellular membranes through binding to “solubilizing factors,” such as Galectin-3 and PDEδ, to prevent random attachment to the endomembranes (6, 25). Structural analysis showed that these transport proteins provide a hydrophobic groove suitable to accommodate the hydrophobic farnesyl group on the K-Ras protein, thereby increasing its water solubility (26–28). To test how this process affects the translocation of the protein from the PM to the Golgi, we pretreated cells with deltarasin, a compound that competes with Ras binding by mimicking the structure of farnesyl groups (26). Deltarasin treatment significantly reduced (from 7.47 × 10⁻² ± 0.218 × 10⁻² to 3.29 × 10⁻² ± 0.692 × 10⁻², p = 0.005) the appearance of Venus-K-Ras-CAAX at the Golgi upon PM PPIns depletion (Fig. 4A). Confocal images in Fig. 4B also show that in deltarasin-pretreated COS-7 cells a reduced amount of Venus-K-Ras-CAAX reached the Golgi upon rapamycin treatment. Instead, Venus-K-Ras-CAAX remained bound to intracellular vesicular structures. Notably, deltarasin treatment alone significantly reduced K-Ras-CAAX–Golgi interaction (−1.94 × 10⁻² ± 0.374 × 10⁻², p = 0.039), suggesting that even in resting cells (without PM PPIns depletion) there is a rapid cycling of K-Ras-CAAX-tagged proteins between the Golgi and the PM (supplemental Fig. S2A).
Figure 4.

Investigation of the travel route of the K-Ras-CAAX-tagged Venus protein to the Golgi and evaluation of the significance of the PtdIns4P content of this membrane in the translocation process. A, interaction between the Venus-K-Ras-CAAX and Golgi-Luc proteins by BRET was measured in HEK 293T cells also expressing the proteins of the depletion system (PM-FRB-mRFP and mRFP-FKBP-PJ). Lipid depletion was activated by 300 nm rapamycin. Deltarasin pretreatment (10 μm; 10 min) was used to competitively inhibit the binding of the Venus-K-Ras-CAAX proteins to their solubilizing factor molecule PDEδ, which promotes their trafficking. BRET ratio values are expressed as the difference between rapamycin-treated and vehicle (DMSO)-treated cells in the case of both the untreated and deltarasin-pretreated cells. Data are means of three independent experiments. Error bars represent S.E. Statistical analysis was performed using t test (*, p < 0.05; **, p < 0.01). B, intracellular distribution of Venus-K-Ras-CAAX was examined by confocal microscopy in COS-7 cells also expressing the proteins of the lipid depletion system (PM-FRB and mRFP-FKBP-PJ). The images were collected before and 5 min after the addition of 300 nm rapamycin. Cells are representatives of at least 10 measurements carried out in three independent experiments. C, intracellular distribution of Venus-K-Ras-CAAX was examined by confocal microscopy in COS-7 cells also expressing the proteins of the lipid depletion system (PM-FRB and mRFP-FKBP-PJ). Deltarasin treatment of the cells (10 μm; 5 min) was followed by the activation of the lipid depletion system by adding rapamycin (300 nm; 5 min). Note the increased number of intracellular vesicles instead of the Golgi localization of Venus-K-Ras-CAAX. Cells are representatives of at least six measurements carried out in three independent experiments. D, the effect of PM permeabilization was examined in HeLa cells transiently expressing Venus-K-Ras-CAAX or Venus-H-Ras-CAAX. HeLa cells were kept in an intracellular solution during the measurement. Permeabilization was achieved by adding digitonin (25 μg/ml; 5 min). Note the appearance of the fluorescent signal on the membrane of non-transfected cells in the case of Venus-K-Ras-CAAX but not in the case of Venus-H-Ras-CAAX. Cells are representatives of at least six measurements carried out in two independent experiments. E, the effect of the combined PM and Golgi PPIns depletion on the BRET signal was measured between the Venus-K-Ras-CAAX and Golgi-Luc proteins (upper graph). In addition to these proteins, HEK 293T cells also expressed the proteins of the PM lipid depletion system (PM-FRB-mRFP and mRFP-FKBP-PJ). To achieve a combined depletion of PtdIns4P also in the Golgi compartment (PM + Golgi PPIns depletion), cells were also transfected with TGN38-FRB-mRFP as an additional anchor of PJ on the surface of Golgi (see inset). As a control, TGN38-mRFP was used instead of TGN38-FRB-mRFP. BRET ratio values are expressed as the difference between rapamycin-treated and vehicle (DMSO)-treated cells. In parallel, on the same plate, PM PtdIns(4,5)P2 levels were also measured. For this, cells expressed Venus- and luciferase-tagged PLCδ1-PH instead of Venus-K-Ras-CAAX and Golgi-Luc proteins. BRET ratio values were normalized (nBRET) by considering the resting ratio as 100% and the complete lack of energy transfer as 0% (see details of the calculation under “Experimental procedures). Data are means of three independent experiments. Error bars represent S.E. Statistical analysis was performed using t test (*, p < 0.05; **, p < 0.01; ns, non-significant). a.u., arbitrary units.
To confirm that Venus-K-Ras-CAAX can exist in the cytoplasm, not in a membrane-bound but in a free, solubilized form, we carried out a simple experiment. Cells that expressed Venus-K-Ras-CAAX were treated with the permeabilization agent digitonin, allowing the release of small cytoplasmic proteins from the cell. As shown in Fig. 4D, upon permeabilization, Venus-K-Ras-CAAX also appeared in the membrane of the other non-transfected cells of the culture, supporting the hypothesis of membrane-independent cytoplasmic trafficking. This phenomenon was not observed when H-Ras-CAAX was used instead of K-Ras-CAAX (Fig. 4D).
To examine whether it is the Golgi PtdIns4P that recruits the Venus-K-Ras-CAAX during its Golgi translocation, we performed BRET measurements in which, in addition to depletion of PM PPIns, the PtdIns4P pool of the Golgi was also reduced. To do this, we cotransfected HEK 293T cells with plasmids that targeted FRB to both the PM and the Golgi for the rapamycin-dependent PJ translocation to both compartments (Fig. 4D). As shown in Fig. 4D, upper plot, concomitant Golgi PtdIns4P depletion resulted in a significantly lower (from 3.99 × 10⁻² ± 0.422 × 10⁻² to 1.81 × 10⁻² ± 0.0704 × 10⁻², p = 0.007) translocation of the K-Ras-CAAX-tagged Venus compared with PPIns depletion only at the PM. Control measurements of PM PtdIns(4,5)P2 were carried out to show that the decrease of the Golgi translocation of Venus-K-Ras-CAAX was not due to lesser PM phospholipid depletion (Fig. 4E, lower plot).
PM binding of Venus-K-Ras-CAAX depends on electrostatic interactions rather than binding to specific lipids
As shown in Fig. 2, rapamycin-induced PJ recruitment led to acute depletion of PtdIns4P, PtdIns(4,5)P2, and PtdIns(3,4,5)P3 in the PM. To investigate whether any of these lipids has a specific role in keeping the K-Ras-CAAX-tagged Venus in the PM, we depleted these PPIns individually.
As shown in Fig. 5A, the robust PtdIns(3,4,5)P3 depletion in the PM achieved by wortmannin (Wm) treatment (see Fig. 2C) did not cause Venus-K-Ras-CAAX to appear in the Golgi compartment nor did it affect the Golgi translocation response following PJ recruitment to the PM. This suggests that PM PtdIns(3,4,5)P3 plays a negligible role in the stabilization of the Venus-K-Ras-CAAX protein at the PM.
Figure 5.
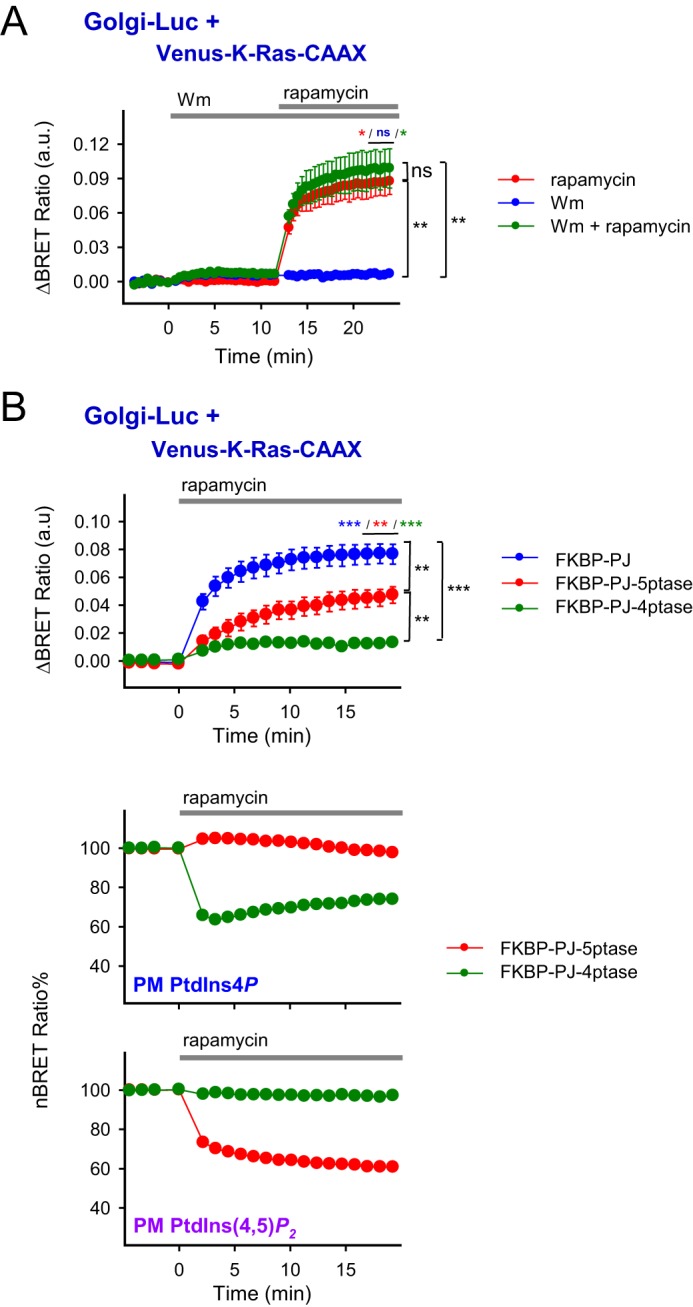
Effect of the isolated depletion of various types of PPIns on the K-Ras-CAAX translocation. A, to examine the effect of PM PtdIns(3,4,5)P3 on K-Ras-CAAX translocation to the Golgi, BRET measurements were carried out on transiently transfected HEK 293T cells expressing the required proteins (PM-FRB-mRFP and mRFP-FKBP-PJ) of the depletion system and the Venus-K-Ras-CAAX and Golgi-Luc proteins. PM PPIns was evoked by adding rapamycin (300 nm) and/or the PI3K inhibitor wortmannin (100 nm). The difference of the BRET ratios was calculated between the stimulated and vehicle (DMSO)-treated cells. Data are means of three independent experiments. Error bars represent S.E. Statistical analysis was performed using t test in the case of the individual curves, and one-way ANOVA was used to examine the differences between the distinct treatments (*, p < 0.05; **, p < 0.01; ns, non-significant). B, effect of the solely PM PtdIns4P (green) or PtdIns(4,5)P2 (red) depletion compared with the joint (blue) depletion on the Venus-K-Ras-CAAX translocation to the Golgi achieved via recruiting distinct-specificity phosphatases (FKBP-PJ for PtdIns4P and PtdIns(4,5)P2, FKBP-PJ-Sac1 for PtdIns4P, and FKBP-PJ-5ptase for PtdIns(4,5)P2 depletion) to the PM-anchored FRB protein (PM-FRB-mRFP) by 300 nm rapamycin treatment. The experiments were carried out on transiently transfected HEK 293T cells. PM PPIns levels were also monitored simultaneously with translocation experiments using the same specific BRET-based biosensors presented in Fig. 2C. The lipid changes were only plotted in the case of FKBP-5ptase (red) or FKBP-4ptase (green). (The results of the joint depletion on the lipid pools were previously demonstrated in Fig. 2C.) The difference of the BRET ratios was calculated between rapamycin (300 nm)- and vehicle (DMSO)-treated cells. BRET ratio values were normalized (nBRET) by considering the resting ratio as 100% and the complete lack of energy transfer as 0% (see details of the calculation under “Experimental procedures”). Data are means of four independent experiments. Error bars represent S.E. Statistical analysis was performed using t test in the case of the individual curves, and one-way ANOVA was used to examine the differences between the different conditions (**, p < 0.01; ***, p < 0.001). a.u., arbitrary units.
Next, we depleted PM PtdIns4P and PtdIns(4,5)P2 separately to examine the contribution of these lipids individually to the PM localization of K-Ras. For this, we used PJ enzyme inactivated in either its 5-phosphatase (FKBP-PJ-4ptase) or 4-phosphatase (FKBP-PJ-5ptase) activity (15). As shown in Fig. 5B, FKBP-PJ-5ptase recruitment, which reduced only the PM PtdIns(4,5)P2 level (with a slight increase in PM PtdIns4P), caused an ∼40% reduction (from 7.67 × 10⁻² ± 0.71 × 10⁻² to 4.58 × 10⁻² ± 1.21 × 10⁻², p = 0.00287) of Venus-K-Ras-CAAX translocation to the Golgi when compared with the effect of FKBP-PJ. Recruitment of the FKBP-PJ-4ptase, which reduced only PM PtdIns4P, was less effective (85% reduction) but still caused a significant increase (1.25 × 10⁻² ± 0.041 × 10⁻², p = 0.003) of K-Ras-CAAX Golgi appearance (Fig. 5B).
The effect of PM PPIns depletion on the intracellular trafficking of full-length K- and H-Ras proteins
In the previous experiments, we examined the isolated targeting sequences of the Ras proteins. To study the behavior of the full-length Ras proteins, we created N-terminally Venus-tagged versions of the full-length K- and H-Ras proteins and investigated their movements under conditions of PPIns manipulations. In these experiments, the constitutively active form, G12V, of both Ras proteins was used. As shown in Fig. 6, the full-length proteins showed the same changes in response to PPIns depletion as their isolated targeting sequences examined by both confocal microscopy (Fig. 6A) and BRET (Fig. 6, B and C) in HEK 293T cells (1.34 × 10⁻² ± 0.275 × 10⁻², p = 0.049 and 3.56 × 10⁻² ± 0.567 × 10⁻², p = 0.02, respectively). Wild-type or dominant-negative forms of the Ras proteins behaved the same way, indicating that the translocation process is independent of the activity state of these proteins (supplemental Fig. S3).
Figure 6.
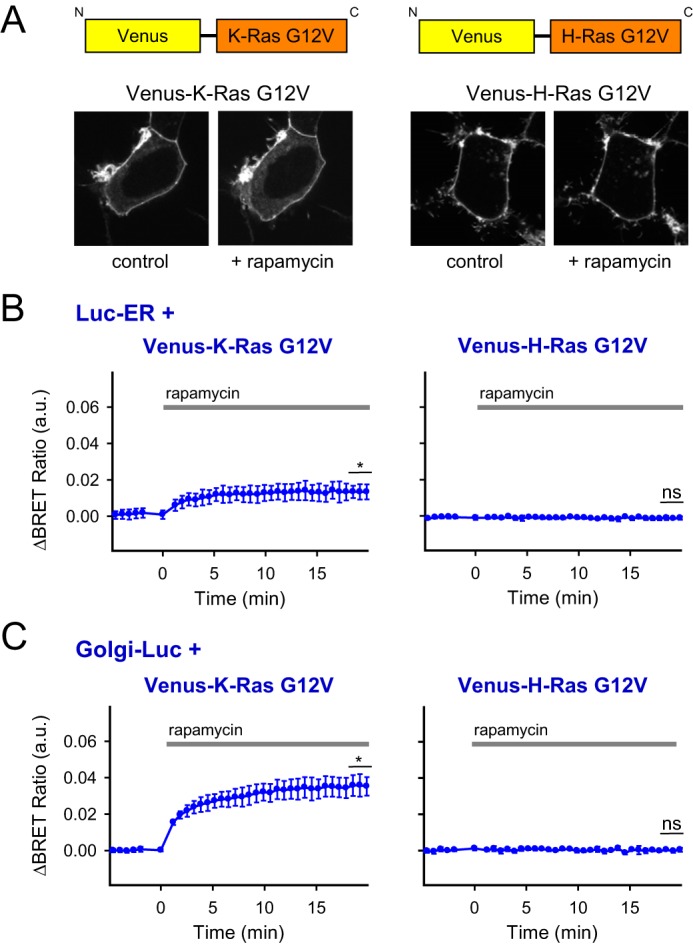
Investigation of the localization of the constitutively active full-length forms of fluorescently tagged K- and H-Ras constructs after PM PPIns depletion. A, schematic representation of the full-length K- and H-Ras-G12V constructs tagged with Venus fluorescent protein at the N terminus. Confocal images show transiently transfected HEK 293T cells expressing the Venus-tagged K- (left panel) or H-Ras-G12V (right panel) constructs and the proteins of the PPIns depletion system (PM-FRB and mRFP-FKBP-PJ; not visible). The images were collected before (left) and 5 min after the activation of the PM PPIns depletion system with 300 nm rapamycin (right). Cells are representatives of at least 10 measurements carried out in three independent experiments. B and C, effect of the PM PPIns depletion on the K-Ras-G12V or H-Ras-G12V interaction with the ER and Golgi membranes. BRET was measured between Venus-tagged full-length Ras constructs and the same ER- or Golgi-targeted luciferase protein as in the measurement in Fig. 3C (ER-Luc in B and Golgi-Luc in C). The measurements were carried out on transiently transfected HEK 293T cells expressing the indicated constructs for the BRET measurements and the proteins of the depletion system (PM-FRB-mRFP and mRFP-FKBP-PJ). BRET ratios were calculated between rapamycin (300 nm)- and vehicle (DMSO)-treated cells. Data are means of three independent experiments. Error bars represent S.E. Statistical analysis was performed using t test (*, p < 0.05; ns, non-significant). a.u., arbitrary units.
K-Ras moves to the Golgi during Gq-coupled or EGF receptor activation
After testing Ras distribution using the artificial PPIns manipulations, we wanted to determine how PPIns changes that occur during more physiological conditions, namely during Gq-coupled receptor activation, affect the intracellular distribution of the K-Ras protein. For this, M3 muscarinic receptors (M3Rs) were expressed in HEK 293T cells together with either Venus-K-Ras-CAAX or Venus-K-Ras-G12V construct and the Golgi-Luc protein to examine K-Ras translocation to the Golgi membrane by BRET measurements. The M3R agonist carbachol was used to stimulate PLC activation. Distribution of the Venus-K-Ras-CAAX construct was also examined with confocal microscopy using transiently transfected COS-7 cells. As shown in Fig. 7A, carbachol treatment caused a moderate transient elevation in the Golgi appearance of either Venus-K-Ras-CAAX or the full Venus-K-Ras-G12V protein (1.28 × 10⁻² ± 0.0521 × 10⁻², p = 0.013 and 0.759 × 10⁻² ± 0.106 × 10⁻², p = 0.005, respectively) that was more pronounced with the Venus-K-Ras-CAAX construct. Pretreatment of the cells with A1, an inhibitor of the type III PI4Kα kinase (PI4KA), which prevents PtdIns4P and PtdIns(4,5)P2 resynthesis, resulted in a more sustained effect. Similar changes were observed in COS-7 cells using confocal microscopy (Fig. 7B). Notably, A1 treatment increased K-Ras-CAAX–Golgi interaction (1.56 × 10⁻² ± 0.167 × 10⁻², p = 0.049), suggesting that even in resting cells PM PtdIns4P depletion alone can evoke translocation of K-Ras-CAAX to the Golgi (supplemental Fig. S2B).
Figure 7.

Localization of the Venus-K-Ras-CAAX and Venus-K-Ras-G12V constructs after PM PPIns depletion achieved via Gq-coupled seven-TM receptor activation. A, BRET measurements represent the interaction between the Venus-K-Ras-CAAX or Venus-K-Ras-G12V constructs and Golgi-Luc after treating the cells with carbachol (10 μm) (blue plot). The specific inhibitor against PI4KA (responsible for PM PtdIns4P resynthesis) was also applied (A1 compound at 10 nm concentration; 10-min pretreatment; red plot) in these experiments. The experiments were carried out on transiently transfected HEK 293T cells expressing the wild-type muscarinic M3 receptor to achieve sufficient PM PPIns depletion after carbachol treatment. The difference of the BRET ratios was calculated between carbachol (10 μm)-treated and untreated cells. The data are means of three independent experiments. Error bars represent S.E. Statistical analysis was performed using t test. Because of the different kinetic changes of the measurements without any pretreatment, t test was also performed on the mean values of the three data points at the peak change (∼1 min after stimulation) (*, p < 0.05; **, p < 0.01; ns, non-significant). B, parallel confocal images from cells expressing the Venus-K-Ras-CAAX construct show the same experiments presented in A, top. To evaluate the changes on the Golgi, transiently transfected COS-7 cells were used, aiming for better insight into this region of the cells. Images on the left show the control period, images in the middle were collected 1 min after carbachol (10 μm) treatment, and images on the right represent the cells after 5 min of muscarinic receptor activation. Arrows indicate the position of the Golgi. The cells expressed the wild-type muscarinic M3 receptor to achieve sufficient PM PPIns depletion after carbachol treatment (not visible). Cells are representatives of at least 10 measurements carried out in three independent experiments. C, BRET measurements represent the interaction between the Venus-K-Ras-CAAX construct and Golgi-Luc after treating the cells with EGF (100 ng/ml) (blue plot). Specific inhibitors against PI4KA (A1 compound at 10 nm concentration; 10-min pretreatment; red plot) and PI3K (Wm at 100 nm concentration; 10-min pretreatment; green plot) were also applied in these experiments. The experiments were carried out on transiently transfected HEK 293T cells expressing the human EGF receptor to achieve sufficient PM PPIns depletion after EGF treatment. The difference of the BRET ratios was calculated between EGF (100 ng/ml)-treated and untreated cells. The data are means of four independent experiments. Error bars represent S.E. Statistical analysis was performed using t test (**, p < 0.01). a.u., arbitrary units.
Previously we showed that stimulation of HEK 293T cells with EGF decreases the PM PtdIns(4,5)P2 level by activating the generation of PtdIns(3,4,5)P3 and inositol 1,4,5-trisphosphate (IP3) by PI3Ks and PLCγ, respectively (24). Interestingly, the latter effect could not be abolished by low Wm concentration (100 nm) (24). To examine whether this decrease of PM PtdIns(4,5)P2 could have an impact on the distribution of K-Ras, we measured arrival of the Venus-K-Ras-CAAX to the Golgi. Stimulation of endogenous EGF receptors of HEK cells by 100 ng/ml EGF failed to cause a detectable translocation from the PM to the Golgi (data not shown). However, when cells were cotransfected with the EGF receptor, EGF stimulation caused translocation of Venus-K-Ras-CAAX from the PM to the Golgi in a similar manner as did M3R stimulation (0.665 × 10⁻² ± 0.293 × 10⁻², p = 0.002) (Fig. 7C). Similarly, this effect was even larger when PI4KA was inhibited with A1, consistent with the notion that depletion of plasma membrane PtdIns4P and PtdIns(4,5)P2 together liberates K-Ras, which is then recruited to the Golgi by PtdIns4P in that compartment (Fig. 7C). In contrast, inhibition and subsequent depletion of the PM PtdIns(3,4,5)P3 did not enhance the translocation (Fig. 7C), which is also consistent with its minor effect on the PM recruitment of K-Ras (Fig. 5A).
PM PPIns depletion attenuates K-Ras– but not H-Ras–induced cell proliferation
Ras proteins control numerous cellular processes ranging from cell growth to differentiation and cell survival (29). To investigate the functional consequences of K-Ras translocation to the Golgi after PM PPIns depletion, we carried out a 24-h [3H]leucine incorporation assay to evaluate the rate of protein synthesis as a marker of cell proliferation.
First, the proliferative effect of the constitutively active mutation of Ras was examined. Constitutively active G12V and dominant-negative S17N forms of the K- and H-Ras proteins were expressed transiently in COS-7 cells. As expected, cells expressing the activating Ras mutants showed significantly larger leucine incorporation compared with those expressing the dominant-negative forms (p < 0.001) (Fig. 8A). This increased protein synthesis was used as a sign of increased proliferation caused by the active Ras mutants. Next, we examined how the PM PPIns depletion affects the ability of active Ras to induce proliferation. Again, PM PPIns depletion was achieved using recruitment of FKBP-PJ. Because rapamycin, an mTOR inhibitor, was used for recruitment, we used the catalytically inactivated FKBP-PJ enzyme as a control (15). As shown on Fig. 8B, active K-Ras increased the [3H]leucine incorporation even in the presence of 100 nm rapamycin, although its effect was reduced (compare Fig. 8, A and B). PM PPIns depletion did not affect the already low [3H]leucine incorporation in cells expressing the dominant-negative form, K-Ras S17N, but had a significant inhibitory effect (p = 0.003) in cells expressing the active form of K-Ras, G12V. Notably, PPIns depletion did not change the proliferative effect of H-Ras-G12V. This was in agreement with the earlier data showing that H-Ras-G12V PM localization does not depend on the PM PPIns. These experiments showed that only the PM-localized Ras is competent in signaling to proliferation and that the Golgi-associated form is unable to induce the same changes under PPIns-depleted conditions.
Figure 8.
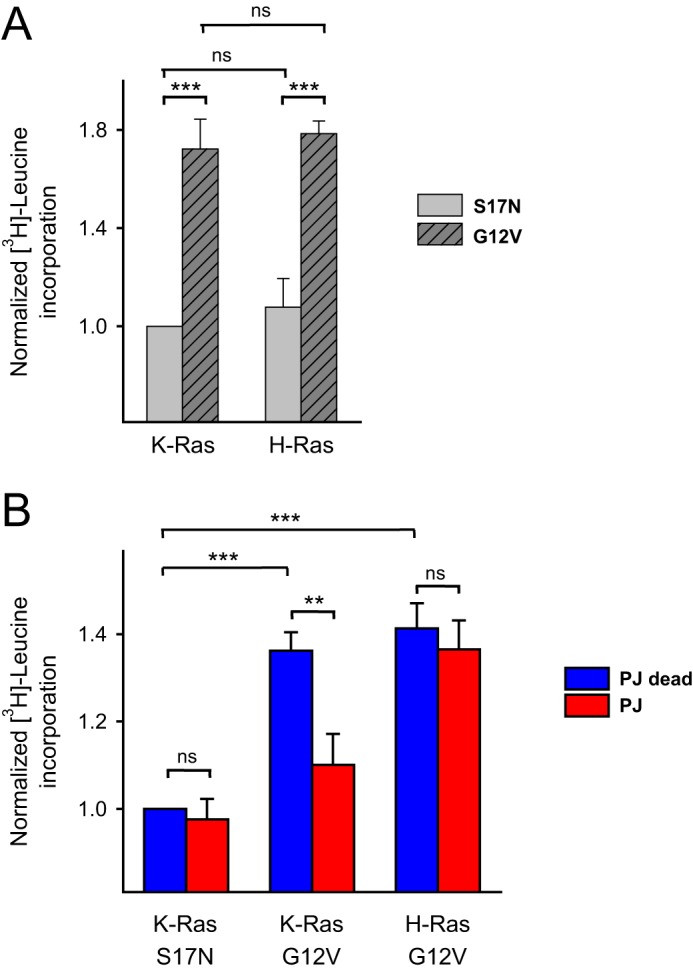
Measurement of the radiolabeled [3H]leucine incorporation in distinct Ras mutant–expressing cells with or without concomitant PM PPIns depletion. A, evaluation of the normalized 24-h [3H]leucine incorporation in transiently transfected COS-7 cells expressing the mRFP-tagged versions of the dominant-negative S17N or constitutively active G12V forms of both K- and H-Ras proteins. Values were normalized to K-Ras S17N. Data are means of three independent experiments. Error bars represent S.E. Statistical analysis was carried out using two-way ANOVA followed by the Holm-Sidak all pairwise multiple comparison method on the data of the four groups (***, p < 0.001). B, comparison of the normalized [3H]leucine incorporation in distinct Ras isoform-expressing cells with or without concomitant PM PPIns. The measurements were carried out on transiently transfected COS-7 cells expressing the mRFP-tagged versions of the indicated Ras isoforms and the required proteins of our PM PPIns depletion system (PM-FRB-mRFP and mRFP-FKBP-PJ). PM PPIns depletion was evoked by long-term rapamycin treatment (100 nm; 24 h; repeated every 8 h). For the control measurements, an enzymatically inactive form of the phosphatase was used (PJ dead). Values were normalized to K-Ras S17N with PJ dead recruitment. Data are means of four independent experiments. Error bars represent S.E. Statistical analysis was carried out using two-way ANOVA followed by the Holm-Sidak all pairwise multiple comparison method on the data of the four groups (**, p < 0.01; ***, p < 0.001; ns, non-significant).
Discussion
PM localization plays a fundamental role in the function of many intracellular signaling proteins. Several factors determine PM localization of a protein, some of which are intrinsic to the protein, such as the presence of hydrophobic lipid modifications and transmembrane segments. Some of the interactions, however, rely upon specific lipid components of the membrane, such as PPIns, or simple electrostatic interactions provided by acidic lipids, such as PtdSer. In this study, we investigated how depletion of negatively charged PPIns can acutely regulate the PM association and intracellular distribution of selected peripheral PM proteins. We focused on two members of the Ras family, K-Ras and H-Ras. The C termini of both of these proteins undergo prenylation, but this alone is not sufficient for stable PM interaction. In the case of K-Ras, electrostatic interactions between positively charged residues located within the C-terminal tail of the molecule and negatively charged phospholipids of the PM are required for PM localization. In contrast, H-Ras, has two additional palmitoylations in its C terminus that ensure PM localization. These features have a major impact on the different signaling properties of these Ras proteins (30, 31).
In this study, we used an adaptation of our recently developed BRET system to obtain a more quantitative assessment of the role of the individual PPIns on K-Ras and H-Ras PM localization. Moreover, we also developed a method for a quantitative assessment of which intracellular membranes Ras molecules will interact with once released from the PM. We combined these BRET measurements with the controlled elimination of PtdIns4P and PtdIns(4,5)P2 using the rapamycin-inducible membrane recruitment of the bifunctional artificial PPIns phosphatase PJ (15). Using this system, we confirmed previous findings (13–15) that both PtdIns4P and PtdIns(4,5)P2 were important for PM localization of K-Ras but that PtdIns(4,5)P2 was more important, and PtdIns(3,4,5)P3 played little if any role. This discrepancy could be explained by the generation of a stronger local electric field by PtdIns(4,5)P2, especially if it is present in clusters in the PM (32–34), or by insufficient PM PtdIns4P depletion when PJ-4ptase is used instead of PJ (compare PM PtdIns4P measurement in Figs. 2C and 5B). Recently, based on its ability to form long-lived salt bridges, PtdIns(4,5)P2 was also shown to have a distinguished role (35).
Although PPIns appear to be the most important in K-Ras PM recruitment, the role of PtdSer in K-Ras localization has been reported (36–39). Although PS only carries a single negative charge, it is present in the inner leaflet of the PM in a relatively high amount (34); therefore, it could contribute to the localization of proteins containing basic surface patches. Indeed, it was found that by decreasing the PM PtdSer level (measured by LactC2 (12)), 7-oxostaurosporine or fendiline could effectively reduce the amount of PM-bound K-Ras in Madin-Darby canine kidney cells (36, 37, 39). Unfortunately, long-term exposure (at least 24 h) to these inhibitors was required to achieve the lipid change, and several other changes could occur during this treatment regime. Our effort to acutely reduce PM PtdSer has not been successful so far, and therefore we could not assess the role of PS in K-Ras PM localization. These efforts are still being continued in our laboratory.
An important new aspect of our study was to follow the fate of the K-Ras protein once it was released from the PM during PPIns depletion. Again, using a BRET analysis that monitors the appearance of the K-Ras protein in membranes of the ER, Golgi, endosomes, or mitochondria, we showed that K-Ras rapidly appears in the Golgi and to a smaller extent in the ER but not in the endosomes after being released from the PM. In the case of the mitochondria, there is a slight increase of the energy transfer between the mitochondrially targeted luciferase and the Venus-K-Ras-CAAX, but it is negligible compared with the Golgi and reflects the appearance of the Venus in the cytoplasm. According to the current views, after being released from the PM, K-Ras binds transport proteins, such as Galectin-3 and PDEδ, that keep it in the cytosol. Our results are consistent with this idea because the Golgi translocation of the Venus-K-Ras-CAAX protein was prevented by treatment with deltarasin, a compound that mimics the farnesyl groups and competes for K-Ras binding of the transport molecules. Moreover, Venus-K-Ras-CAAX can leave the cytoplasm when cells are permeabilized. Interestingly, when the cytoplasmic transport is inhibited, Venus-K-Ras-CAAX appears on the surface of intracellular vesicles, probably because they are negatively charged by PtdIns3P and close to the PM and therefore able to trap Venus-K-Ras-CAAX. Because the electrostatic interaction seems to be major determinant of the membrane binding even in the case of endomembranes, it is not surprising that PtdIns4P depletion of Golgi does also not favor the localization of the proteins in the Golgi.
Could there be a physiological significance of the Golgi localization of K-Ras? There are many examples in the literature that small G proteins are capable of initiating signaling events from endomembranes including the Golgi. It has been reported that Ras proteins can be activated at the Golgi (40, 41) and are able to initiate proliferation signals through the activation of ERK (42). These reports, however, referred to H- and N-Ras but not K-Ras4B because during its intracellular trafficking K-Ras is not found in the Golgi (6). However, a potential significance of the translocation of K-Ras from the PM to the endomembranes including ER and Golgi could be that Ras signaling might be switched on in these other localizations if Ras guanyl-releasing proteins can control their activation state (43, 44). Bivona et al. (45) described the PKC-dependent translocation of K-Ras from the PM to endomembranes including the Golgi and the mitochondria by a mechanism that included the phosphorylation of serine residues on the C-terminal tail of K-Ras, disrupting the electrostatic interaction between the protein and the membrane. However, we could not detect the appearance of Venus-K-Ras-CAAX either in the Golgi or in the mitochondria upon phorbol 12-myristate 13-acetate treatment. This apparent discrepancy could be explained by the different stimulation regime in the Bivona et al. (45) studies and ours; to activate PKC, they used bryostatin, and because phorbol 12-myristate 13-acetate alone was found to be ineffective, they also added ionomycin, which by increasing Ca2+ could have evoked PPIns depletion.
The proliferating effect of the Ras proteins depends on the activation of three distinct pathways. 1) Active Ras can elevate PM PtdIns(3,4,5)P3 levels due to activation of PI3K enzymes and therefore activates Akt signaling. 2) Ras can directly activate the MAPK cascade via activation of Raf proteins. 3) Ras can activate the Ral-guanine nucleotide dissociation stimulator protein, which than triggers the conversation of GDP-bound inactive Ral proteins to GTP-bound active forms (3). Although this latter pathway is less established compared with the abundance of literature on the first two pathways, its significance is increasing as a major factor in the transforming ability of the Ras proteins (31, 46). We used 24-h [3H]leucine incorporation as a measure of Ras-induced proliferation after expression of the various Ras proteins either in their active G12V or inactive S17N forms. To test the effect of PPIns depletion on Ras signaling, we used the rapamycin-recruitable PJ enzyme. These experiments showed that K-Ras but not H-Ras signaling (as it translates to [3H]leucine incorporation) was highly dependent on PM PPIns, suggesting that it is the PM-bound form that is important for signaling and that increased Golgi association does not support a proliferative effect. Importantly, in cells that expressed oncogenic Ras, [3H]leucine incorporation was increased even in the presence of 100 nm rapamycin, which inhibits mTOR signaling (47, 48). In contrast to K-Ras, the increased proliferation evoked by H-Ras expression did not depend on PM PPIns (including PtdIns(3,4,5)P3). This finding was somewhat unexpected in light of numerous reports showing that PPIns are required for the normal function of several members of the MAPK pathway (49, 50). We also found that ERK phosphorylation was reduced by PM PPIns depletion,4 raising the possibility that the proliferative effects of K-Ras are mediated primarily by the Ral pathway. Although there is a report suggesting that the Ral pathway originates from the Golgi (51), it is widely accepted that active PM-bound Ras proteins can activate cell proliferation through the Ral-TBK1 pathway (52). Additionally, there are examples in the literature suggesting that palmitoylation could also occur on cysteine residues further away from the terminal cysteine within the C-terminal tail domain, strengthening the PM anchoring of Ral and preventing the detachment of this molecule from the PM after PM PPIns depletion as could be seen in the case of the H-Ras protein (53, 54).
Lastly, there is a plethora of literature concerning the segregation of the various PM-targeting sequences in lateral domains of the PM often referred to as rafts (16, 55). However, there is a significant amount of controversy surrounding this topic (56, 57). CAAX domains with polybasic residues are often used to target domains outside of rafts, whereas the Lyn domain is used to target rafts (58). Notably, however, it was suggested that PtdIns(4,5)P2 is found in rafts (59), which is where CAAX domains with polybasic sequences would be enriched. The distribution of PtdIns(4,5)P2 or its protein binding partners to specialized PM domains could not be substantiated by several credible efforts (60, 61). This topic is worth mentioning because of the significant literature on the distribution of the various Ras proteins into specialized PM domains designated as rafts (62–64). Unfortunately, our studies were unable to shed any light on this topic, and several efforts in our group failed to detect a difference between the ability of any of these PM-targeting sequences to access PPIns when used to recruit PPIns-modifying enzymes.5
In summary, these studies were aimed at assessing the role of PM PPIns in the localization of various PM-targeting sequences using a BRET-based method for quantitative assessment. In agreement with the literature, we found that sequences with polybasic stretches in addition to lipid modifications depend on PPIns for membrane attachment by the principle of electrostatic interactions rather than specific PPIns binding. Using the K-Ras protein as an example, we also followed the intracellular fate of the protein and showed that it associated with the Golgi in a PtdIns4P-dependent manner once released from the PM, but this Golgi-associated pool was unable to maintain the proliferative effect of the K-Ras protein.
Experimental procedures
Materials
Molecular biology reagents were purchased from Fermentas (Vilnius, Lithuania). For the polymerase chain reaction, the Pfu Turbo Hotstart polymerase was used (Agilent Technologies, Santa Clara, CA). Cell culture dishes, 24-, and 96-well plates were obtained from Greiner (Kremsmunster, Austria). 8-Well μ-Slides (catalog number 80826) for confocal experiments were obtained from IBIDI (Martinsried, Germany). Coelenterazine h was purchased from Regis Technologies (Morton Grove, IL). Lipofectamine 2000 was from Invitrogen. Rapamycin was obtained from Selleckchem (Houston, TX). GeneCellin transfection reagent was from BioCellChallenge (Toulon, France). Deltarasin was purchased from Cayman Chemicals (Ann Arbor, MI). Unless otherwise stated, all other chemicals and reagents were purchased from Sigma.
DNA constructs
To create the various PM-targeted Venus constructs, the targeting sequences of the following proteins were synthesized: the N-terminal 14 amino acids (AA) of Lyn (Lyn(1–14); accession number NM_002350.3), the N-terminal 10 AA of Lck (Lck(1–10); accession number NM_005356.4), the N-terminal 15 AA of c-Src (c-Src(1–15); accession number NM_005417.4), and the C-terminal 22 AA of both K-Ras4B (K-Ras-CAAX; accession number NM_004985) and H-Ras (H-Ras-CAAX; accession number NM_005343). The fragments were then inserted into monomeric Venus (containing the A206K mutation (16)) encoding N1 vector using the NheI and BglII enzymes in the case of the N-terminal targeting sequences or into C1 plasmid using the EcoRI and BamHI sites in the case of the C-terminal Ras sequences. The following linkers were applied by these constructs: DPTRSRAQASNSDPPVAT in the case of Lyn(1–14)-Venus, NNNNDPTRSRAQASNSDPPVAT in the case of both Lck(1–10)-Venus and c-Src(1–15)-Venus (17), and NEQRSRAQASNS in the case of the Ras constructs. The fluorescent Citrine-tagged full-length K-Ras4B-G12V (accession number NM_004985) and the wild-type or G12V mutant H-Ras (accession number NM_005343)-encoding plasmids were a kind gift from John F. Hancock. To create our monomeric Venus-tagged versions, the sequences of the Ras proteins were amplified using PCR, and the fragments were cloned into monomeric Venus-containing C1 vectors using the YSDLELTTMYPYDVPDYA linker in both proteins. The other versions of the Ras proteins (K-Ras WT, K-Ras-S17N, and H-Ras-S17N) were created using site-directed mutagenesis.
To create the various endomembrane-targeted luciferase constructs, the targeting sequences or the full-length forms of the following proteins were used: TOM70 (accession number X05585.1), TGN38 (accession number BC008461), Sac1 (accession number NM_001179777), and EEA (FYVE domain; accession number BX648463) for mitochondrion-, Golgi-, endoplasmic reticulum-, and early endosome-targeting, respectively. The N-terminal coding sequence of the first 30 AA of the TOM70 protein was synthesized and then ligated into super Renilla luciferase (65)-containing N1 plasmid using the NheI and BglII enzyme pair. The sequences of the TGN38 (66), Sac1 (67), and EEA1 (68) were described earlier. The proper fragments of these proteins were amplified with polymerase chain reaction and then inserted into super Renilla luciferase-containing N1 vector using NheI and BglII enzymes in the case of the TGN38-luciferase construct or into super Renilla luciferase-containing C1 vector using EcoRI and BamHI sites in the case of Luc-ER and luciferase-EEA1-FYVE constructs. The following linkers were applied by these constructs: DPTRSRAQASNSDPPVAT was used both by TOM70 and TGN38, and the SGLRSRAQASNSRV and the RSRAQASNSRV sequences were used by the luciferase-Sac1 and luciferase-EEA1-FYVE proteins, respectively.
The rapamycin-inducible lipid depletion system, applied for the PM PPIns depletion (24), and TGN38-FRB-mRFP, which was used for recruiting our cytoplasmic phosphatase to the Golgi (66), were described earlier. The specific BRET-based lipid sensors and the fluorescently tagged versions of either SidM-2x-P4M or PLCδ1-PH constructs or luciferase-tagged versions of the PLCδ1-PH domain were also used previously (24).
Wild-type human M3 cholinergic receptor (N-terminally 3×-hemagglutinin-tagged) was obtained from S&T cDNA Resource Center (Rolla, MO). The human EGF receptor was described earlier (24).
Cell culture
HEK 293T and COS-7 cells (ATCC, Manassas, VA) were maintained in Dulbecco's modified Eagle's medium (DMEM; Lonza 12-604) supplemented with 10% fetal bovine serum, 50 units/ml penicillin, and 50 μg/ml streptomycin in a 5% humidified CO2 incubator at 37 °C in 10-cm tissue culture plastic dishes.
BRET measurements
For BRET measurements, HEK 293T cells were trypsinized and plated on poly-l-lysine-pretreated (0.001%; 1 h) white 96-well plates at a density of 7 × 10⁴ cells/well together with the indicated DNA constructs (0.15–0.2 μg of total DNA/well) and the cell transfection reagent (1.5 μl/well GeneCellin) in Opti-MEM reduced serum medium (Gibco). After 6 h, 100 μl/well DMEM containing serum and antibiotics was added. Measurements were performed 25–26 h after transfection. Before the measurements, the medium over the cells was changed to a medium (50 μl) containing 120 mm NaCl, 4.7 mm KCl, 1.2 mm CaCl2, 0.7 mm MgSO4, 10 mm glucose, and 10 mm Na-HEPES, pH 7.4. Measurements were performed at 37 °C using a Thermo Scientific Varioskan Flash Reader (PerkinElmer Life Sciences). The measurements started with the addition of the cell-permeable luciferase substrate coelenterazine h (40 μl; final concentration of 5 μm), and counts were recorded using 485- and 530-nm emission filters. Detection time was 500 ms for each wavelength. The indicated reagents were also dissolved in modified Krebs-Ringer buffer and added manually in 10 μl. For this, plates were unloaded, which resulted in an interruption in the recordings. All measurements were done in two to four biological replicates. By the measurements of the PM lipid levels, BRET ratios were calculated by dividing the 530 nm and 485 nm intensities and normalized to the baseline. Because the absolute ratio values depended on the expression of the sensors in the case of the intermolecular inositol lipid sensors, the resting levels were considered as 100%, whereas 0% was determined from the values of those experiments where cytoplasmic Renilla luciferase construct was expressed alone. In the case of the interaction experiments between the Venus-tagged PM-targeted constructs and luciferase-tagged endomembrane-targeted constructs, the difference of the BRET ratios was calculated between rapamycin (300 nm)- or carbachol (10 μm)-treated and vehicle (DMSO or distillated water)-treated cells, respectively.
Confocal microscopy
HEK 293T cells at a density of 3 × 10⁴ cells/well or COS-7 cells at a density of 2 × 10⁴ cells/well were cultured on IBIDI 8-well μSlides in DMEM supplemented with 10% fetal bovine serum, 50 units/ml penicillin, and 50 μg/ml streptomycin at 37 °C. After 1 day, the culture medium was changed to 200 μl of transfection solution containing the indicated DNA constructs (0.2 μg of total DNA/well) and 0.33 μl/dish Lipofectamine 2000. After 6 h, the transfection solution was changed to 300 μl of supplemented DMEM culture medium. Confocal measurements were performed 24–26 h after transfection at room temperature in the modified Krebs-Ringer buffer described above using a Zeiss LSM 710 scanning confocal microscope and a 63×/1.4 oil-immersion objective. Postacquisition picture analysis was performed using Fiji and Photoshop (Adobe) software to expand to the full dynamic range, but only linear changes were allowed.
Permeabilization measurements
HeLa cells were cultured on 25-mm number 1.5 glass coverslips (2 × 10⁵ cells/dish) and transfected with Venus-K-Ras-CAAX or Venus-H-Ras-CAAX construct (0.5 μg of DNA/dish) using 2 μl/dish Lipofectamine 2000 for 24 h. Confocal measurements were performed at room temperature in an intracellular medium containing 117 mm KCl, 6 mm NaCl, 1 mm KH2PO4, 10 mm K+-MOPS, 2 mm EGTA, 0.5 mm MgCl2, and 100 nm CaCl2, pH 7.1, using the LSM 710 confocal microscope and a 63×/1.4 oil-immersion objective. For permeabilization, 25 μg/ml digitonin was applied.
[3H]Leucine incorporation assay
The effect of PM lipid depletion on protein synthesis in COS-7 cells was evaluated by a [3H]leucine incorporation assay. 5 × 10⁴ cells were seeded in poly-l-lysine-pretreated (0.001%; 1 h) 24-well plates and left to adhere overnight at 37 °C. The cells were transfected with plasmids, and after 1 day the cells were incubated with serum-free DMEM for 6 h. The quiescent COS-7 cells were further incubated in serum-free DMEM containing 1 μCi/ml [3H]leucine (American Radiolabeled Chemicals, Saint Louis, MO) with or without 100 nm rapamycin (repeated every 8 h). After 24 h of incubation, the plates were placed on ice, and the cells were washed twice with ice-cold PBS and incubated for 30 min in cold trichloroacetic acid (5%). The fixed cells were then washed with PBS and dissolved in 0.5 m NaOH for 30 min. Finally, the lysed cells were transferred to scintillation vials containing 10 ml of OptiPhase HiSafe3 (PerkinElmer Life Sciences). The radioactivity was counted using a Beckman LS5000 TD liquid scintillation counter.
Statistical analysis
For the statistical analysis of ΔBRET ratio data, a paired t test was used to compare the mean of the last three data points before and after the stimulation of the individual curves. When two separate curves were compared, an unpaired t test was also performed on the means of the last three data points of the curves after the stimulation. When three separate curves were compared, one-way ANOVA was used followed by the Holm-Sidak all pairwise multiple comparison method on the means of the last three data points of the curves after the stimulation. To investigate the effects of the different Ras mutants and/or the PM PPIns depletion system on the [3H]leucine incorporation assay, two-way ANOVA followed by the Holm-Sidak all pairwise multiple comparison method was used. Statistical analysis was performed using the SigmaStat 3.5 program (Systat Software Inc., San Jose, CA).
Author contributions
G. G. designed and constructed vectors; designed, performed, and analyzed the experiments; contributed to the preparation of the figures; and wrote the paper. G. R. designed, performed, and analyzed the experiments. R. M. performed experiments. A. B. designed, performed, and analyzed the experiments shown in Fig. 8. L. H. conceived and coordinated the study. T. B. analyzed the experiments and wrote the paper. P. V. conceived and coordinated the study, designed and constructed vectors, designed and analyzed the experiments, contributed to the preparation of the figures, and wrote the paper. All authors analyzed the results and approved the final version of the manuscript.
Supplementary Material
Acknowledgment
The technical assistance of Kata Szabolcsi is highly appreciated.
The authors declare that they have no conflicts of interest with the contents of this article. The content is solely the responsibility of the authors and does not necessarily represent the official views of the National Institutes of Health.
This article contains supplemental Figs. S1–S3.
G. Gulyás and P. Várnai, unpublished observations.
P. Várnai, G. Gulyás, and T. Balla, unpublished observations.
- PM
- plasma membrane
- PPIns
- polyphosphoinositide(s)
- PLC
- phospholipase C
- BRET
- bioluminescence resonance energy transfer
- PtdIns
- phosphatidylinositol
- PS
- phosphatidylserine
- ER
- endoplasmic reticulum
- FKBP
- FK506 binding-protein
- PJ
- pseudojanin
- PH
- pleckstrin homology
- Luc
- luciferase
- PDE
- phosphodiesterase
- FRB
- FKBP-rapamycin-binding
- Wm
- wortmannin
- ptase
- phosphatase
- M3R
- M3 muscarinic receptor
- mTOR
- mechanistic target of rapamycin
- PtdSer
- phosphatidylserine
- AA
- amino acids
- EEA
- early endosome antigen
- mRFP
- monomeric red fluorescent protein
- ANOVA
- analysis of variance.
References
- 1. Whited A. M., and Johs A. (2015) The interactions of peripheral membrane proteins with biological membranes. Chem. Phys. Lipids 192, 51–59 [DOI] [PubMed] [Google Scholar]
- 2. Wennerberg K., Rossman K. L., and Der C. J. (2005) The Ras superfamily at a glance. J. Cell Sci. 118, 843–846 [DOI] [PubMed] [Google Scholar]
- 3. Lu S., Jang H., Muratcioglu S., Gursoy A., Keskin O., Nussinov R., and Zhang J. (2016) Ras conformational ensembles, allostery, and signaling. Chem. Rev. 116, 6607–6665 [DOI] [PubMed] [Google Scholar]
- 4. Prior I. A., Lewis P. D., and Mattos C. (2012) A comprehensive survey of Ras mutations in cancer. Cancer Res. 72, 2457–2467 [DOI] [PMC free article] [PubMed] [Google Scholar]
- 5. Rocks O., Peyker A., Kahms M., Verveer P. J., Koerner C., Lumbierres M., Kuhlmann J., Waldmann H., Wittinghofer A., and Bastiaens P. I. (2005) An acylation cycle regulates localization and activity of palmitoylated Ras isoforms. Science 307, 1746–1752 [DOI] [PubMed] [Google Scholar]
- 6. Wright L. P., and Philips M. R. (2006) Thematic review series: lipid posttranslational modifications. CAAX modification and membrane targeting of Ras. J. Lipid Res. 47, 883–891 [DOI] [PubMed] [Google Scholar]
- 7. Silvius J. R., Bhagatji P., Leventis R., and Terrone D. (2006) K-ras4B and prenylated proteins lacking “second signals” associate dynamically with cellular membranes. Mol. Biol. Cell 17, 192–202 [DOI] [PMC free article] [PubMed] [Google Scholar]
- 8. Choy E., Chiu V. K., Silletti J., Feoktistov M., Morimoto T., Michaelson D., Ivanov I. E., and Philips M. R. (1999) Endomembrane trafficking of ras: the CAAX motif targets proteins to the ER and Golgi. Cell 98, 69–80 [DOI] [PubMed] [Google Scholar]
- 9. Scheidt H. A., and Huster D. (2009) Structure and dynamics of the myristoyl lipid modification of SRC peptides determined by 2H solid-state NMR spectroscopy. Biophys. J. 96, 3663–3672 [DOI] [PMC free article] [PubMed] [Google Scholar]
- 10. Kay J. G., Koivusalo M., Ma X., Wohland T., and Grinstein S. (2012) Phosphatidylserine dynamics in cellular membranes. Mol. Biol. Cell 23, 2198–2212 [DOI] [PMC free article] [PubMed] [Google Scholar]
- 11. Stahelin R. V., Scott J. L., and Frick C. T. (2014) Cellular and molecular interactions of phosphoinositides and peripheral proteins. Chem. Phys. Lipids 182, 3–18 [DOI] [PMC free article] [PubMed] [Google Scholar]
- 12. Yeung T., Gilbert G. E., Shi J., Silvius J., Kapus A., and Grinstein S. (2008) Membrane phosphatidylserine regulates surface charge and protein localization. Science 319, 210–213 [DOI] [PubMed] [Google Scholar]
- 13. Yeung T., Terebiznik M., Yu L., Silvius J., Abidi W. M., Philips M., Levine T., Kapus A., and Grinstein S. (2006) Receptor activation alters inner surface potential during phagocytosis. Science 313, 347–351 [DOI] [PubMed] [Google Scholar]
- 14. Heo W. D., Inoue T., Park W. S., Kim M. L., Park B. O., Wandless T. J., and Meyer T. (2006) PI(3,4,5)P3 and PI(4,5)P2 lipids target proteins with polybasic clusters to the plasma membrane. Science 314, 1458–1461 [DOI] [PMC free article] [PubMed] [Google Scholar]
- 15. Hammond G. R., Fischer M. J., Anderson K. E., Holdich J., Koteci A., Balla T., and Irvine R. F. (2012) PI4P and PI(4,5)P2 are essential but independent lipid determinants of membrane identity. Science 337, 727–730 [DOI] [PMC free article] [PubMed] [Google Scholar]
- 16. Zacharias D. A., Violin J. D., Newton A. C., and Tsien R. Y. (2002) Partitioning of lipid-modified monomeric GFPs into membrane microdomains of live cells. Science 296, 913–916 [DOI] [PubMed] [Google Scholar]
- 17. Johnson C. M., Chichili G. R., and Rodgers W. (2008) Compartmentalization of phosphatidylinositol 4,5-bisphosphate signaling evidenced using targeted phosphatases. J. Biol. Chem. 283, 29920–29928 [DOI] [PMC free article] [PubMed] [Google Scholar]
- 18. Tóth D. J., Tóth J. T., Gulyás G., Balla A., Balla T., Hunyady L., and Várnai P. (2012) Acute depletion of plasma membrane phosphatidylinositol 4,5-bisphosphate impairs specific steps in endocytosis of the G-protein-coupled receptor. J. Cell Sci. 125, 2185–2197 [DOI] [PMC free article] [PubMed] [Google Scholar]
- 19. Szakadáti G., Tóth A. D., Oláh I., Erdélyi L. S., Balla T., Várnai P., Hunyady L., and Balla A. (2015) Investigation of the fate of type I angiotensin receptor after biased activation. Mol. Pharmacol. 87, 972–981 [DOI] [PMC free article] [PubMed] [Google Scholar]
- 20. Várnai P., Thyagarajan B., Rohacs T., and Balla T. (2006) Rapidly inducible changes in phosphatidylinositol 4,5-bisphosphate levels influence multiple regulatory functions of the lipid in intact living cells. J. Cell Biol. 175, 377–382 [DOI] [PMC free article] [PubMed] [Google Scholar]
- 21. Hammond G. R., Machner M. P., and Balla T. (2014) A novel probe for phosphatidylinositol 4-phosphate reveals multiple pools beyond the Golgi. J. Cell Biol. 205, 113–126 [DOI] [PMC free article] [PubMed] [Google Scholar]
- 22. Várnai P., and Balla T. (1998) Visualization of phosphoinositides that bind pleckstrin homology domains: calcium- and agonist-induced dynamic changes and relationship to myo-[3H]inositol-labeled phosphoinositide pools. J. Cell Biol. 143, 501–510 [DOI] [PMC free article] [PubMed] [Google Scholar]
- 23. Várnai P., Rother K. I., and Balla T. (1999) Phosphatidylinositol 3-kinase-dependent membrane association of the Bruton's tyrosine kinase pleckstrin homology domain visualized in single living cells. J. Biol. Chem. 274, 10983–10989 [DOI] [PubMed] [Google Scholar]
- 24. Tóth J. T., Gulyás G., Tóth D. J., Balla A., Hammond G. R., Hunyady L., Balla T., and Várnai P. (2016) BRET-monitoring of the dynamic changes of inositol lipid pools in living cells reveals a PKC-dependent PtdIns4P increase upon EGF and M3 receptor activation. Biochim. Biophys. Acta 1861, 177–187 [DOI] [PMC free article] [PubMed] [Google Scholar]
- 25. Elad-Sfadia G., Haklai R., Balan E., and Kloog Y. (2004) Galectin-3 augments K-Ras activation and triggers a Ras signal that attenuates ERK but not phosphoinositide 3-kinase activity. J. Biol. Chem. 279, 34922–34930 [DOI] [PubMed] [Google Scholar]
- 26. Zimmermann G., Papke B., Ismail S., Vartak N., Chandra A., Hoffmann M., Hahn S. A., Triola G., Wittinghofer A., Bastiaens P. I., and Waldmann H. (2013) Small molecule inhibition of the KRAS-PDEδ interaction impairs oncogenic KRAS signalling. Nature 497, 638–642 [DOI] [PubMed] [Google Scholar]
- 27. Papke B., Murarka S., Vogel H. A., Martín-Gago P., Kovacevic M., Truxius D. C., Fansa E. K., Ismail S., Zimmermann G., Heinelt K., Schultz-Fademrecht C., Al Saabi A., Baumann M., Nussbaumer P., Wittinghofer A., et al. (2016) Identification of pyrazolopyridazinones as PDEδ inhibitors. Nat. Commun. 7, 11360. [DOI] [PMC free article] [PubMed] [Google Scholar]
- 28. Schmick M., Vartak N., Papke B., Kovacevic M., Truxius D. C., Rossmannek L., and Bastiaens P. I. (2014) KRas localizes to the plasma membrane by spatial cycles of solubilization, trapping and vesicular transport. Cell 157, 459–471 [DOI] [PubMed] [Google Scholar]
- 29. Bar-Sagi D., and Hall A. (2000) Ras and Rho GTPases: a family reunion. Cell 103, 227–238 [DOI] [PubMed] [Google Scholar]
- 30. Zhou Y., and Hancock J. F. (2015) Ras nanoclusters: versatile lipid-based signaling platforms. Biochim. Biophys. Acta 1853, 841–849 [DOI] [PubMed] [Google Scholar]
- 31. Goldfinger L. E., and Michael J. V. (2017) Regulation of Ras signaling and function by plasma membrane microdomains. Biosci. Trends 11, 23–40 [DOI] [PubMed] [Google Scholar]
- 32. McLaughlin S., and Murray D. (2005) Plasma membrane phosphoinositide organization by protein electrostatics. Nature 438, 605–611 [DOI] [PubMed] [Google Scholar]
- 33. Fujita A., Cheng J., Tauchi-Sato K., Takenawa T., and Fujimoto T. (2009) A distinct pool of phosphatidylinositol 4,5-bisphosphate in caveolae revealed by a nanoscale labeling technique. Proc. Natl. Acad. Sci. U.S.A. 106, 9256–9261 [DOI] [PMC free article] [PubMed] [Google Scholar]
- 34. Bigay J., and Antonny B. (2012) Curvature, lipid packing, and electrostatics of membrane organelles: defining cellular territories in determining specificity. Dev. Cell 23, 886–895 [DOI] [PubMed] [Google Scholar]
- 35. Gregory M. C., McLean M. A., and Sligar S. G. (2017) Interaction of KRas4b with anionic membranes: a special role for PIP2. Biochem. Biophys. Res. Commun. 487, 351–355 [DOI] [PMC free article] [PubMed] [Google Scholar]
- 36. Cho K. J., Park J. H., Piggott A. M., Salim A. A., Gorfe A. A., Parton R. G., Capon R. J., Lacey E., and Hancock J. F. (2012) Staurosporines disrupt phosphatidylserine trafficking and mislocalize Ras proteins. J. Biol. Chem. 287, 43573–43584 [DOI] [PMC free article] [PubMed] [Google Scholar]
- 37. van der Hoeven D., Cho K. J., Ma X., Chigurupati S., Parton R. G., and Hancock J. F. (2013) Fendiline inhibits K-Ras plasma membrane localization and blocks K-Ras signal transmission. Mol. Cell. Biol. 33, 237–251 [DOI] [PMC free article] [PubMed] [Google Scholar]
- 38. Gelabert-Baldrich M., Soriano-Castell D., Calvo M., Lu A., Viña-Vilaseca A., Rentero C., Pol A., Grinstein S., Enrich C., and Tebar F. (2014) Dynamics of KRas on endosomes: involvement of acidic phospholipids in its association. FASEB J. 28, 3023–3037 [DOI] [PubMed] [Google Scholar]
- 39. Cho K. J., van der Hoeven D., Zhou Y., Maekawa M., Ma X., Chen W., Fairn G. D., and Hancock J. F. (2015) Inhibition of acid sphingomyelinase depletes cellular phosphatidylserine and mislocalizes K-Ras from the plasma membrane. Mol. Cell. Biol. 36, 363–374 [DOI] [PMC free article] [PubMed] [Google Scholar]
- 40. Chiu V. K., Bivona T., Hach A., Sajous J. B., Silletti J., Wiener H., Johnson R. L. 2nd, Cox A. D., and Philips M. R. (2002) Ras signalling on the endoplasmic reticulum and the Golgi. Nat. Cell Biol. 4, 343–350 [DOI] [PubMed] [Google Scholar]
- 41. Balla A., Erdélyi L. S., Soltész-Katona E., Balla T., Várnai P., and Hunyady L. (2011) Demonstration of angiotensin II-induced Ras activation in the trans-Golgi network and endoplasmic reticulum using bioluminescence resonance energy transfer-based biosensors. J. Biol. Chem. 286, 5319–5327 [DOI] [PMC free article] [PubMed] [Google Scholar]
- 42. Jin T., Ding Q., Huang H., Xu D., Jiang Y., Zhou B., Li Z., Jiang X., He J., Liu W., Zhang Y., Pan Y., Wang Z., Thomas W. G., and Chen Y. (2012) PAQR10 and PAQR11 mediate Ras signaling in the Golgi apparatus. Cell Res. 22, 661–676 [DOI] [PMC free article] [PubMed] [Google Scholar]
- 43. Lorenzo P. S., Kung J. W., Bottorff D. A., Garfield S. H., Stone J. C., and Blumberg P. M. (2001) Phorbol esters modulate the Ras exchange factor RasGRP3. Cancer Res. 61, 943–949 [PubMed] [Google Scholar]
- 44. Caloca M. J., Zugaza J. L., and Bustelo X. R. (2003) Exchange factors of the RasGRP family mediate Ras activation in the Golgi. J. Biol. Chem. 278, 33465–33473 [DOI] [PubMed] [Google Scholar]
- 45. Bivona T. G., Quatela S. E., Bodemann B. O., Ahearn I. M., Soskis M. J., Mor A., Miura J., Wiener H. H., Wright L., Saba S. G., Yim D., Fein A., Pérez de Castro I., Li C., Thompson C. B., et al. (2006) PKC regulates a farnesyl-electrostatic switch on K-Ras that promotes its association with Bcl-XL on mitochondria and induces apoptosis. Mol. Cell 21, 481–493 [DOI] [PubMed] [Google Scholar]
- 46. Neel N. F., Martin T. D., Stratford J. K., Zand T. P., Reiner D. J., and Der C. J. (2011) The RalGEF-Ral effector signaling network: the road less traveled for anti-Ras drug discovery. Genes Cancer 2, 275–287 [DOI] [PMC free article] [PubMed] [Google Scholar]
- 47. Varma S., and Khandelwal R. L. (2007) Effects of rapamycin on cell proliferation and phosphorylation of mTOR and p70(S6K) in HepG2 and HepG2 cells overexpressing constitutively active Akt/PKB. Biochim. Biophys. Acta 1770, 71–78 [DOI] [PubMed] [Google Scholar]
- 48. Calimeri T., and Ferreri A. J. (2017) m-TOR inhibitors and their potential role in haematological malignancies. Br. J. Haematol. 177, 684–702 [DOI] [PubMed] [Google Scholar]
- 49. Clapéron A., and Therrien M. (2007) KSR and CNK: two scaffolds regulating RAS-mediated RAF activation. Oncogene 26, 3143–3158 [DOI] [PubMed] [Google Scholar]
- 50. Koveal D., Schuh-Nuhfer N., Ritt D., Page R., Morrison D. K., and Peti W. (2012) A CC-SAM, for coiled coil-sterile alpha motif, domain targets the scaffold KSR-1 to specific sites in the plasma membrane. Sci. Signal. 5, ra94. [DOI] [PMC free article] [PubMed] [Google Scholar]
- 51. Matallanas D., Sanz-Moreno V., Arozarena I., Calvo F., Agudo-Ibáñez L., Santos E., Berciano M. T., and Crespo P. (2006) Distinct utilization of effectors and biological outcomes resulting from site-specific Ras activation: Ras functions in lipid rafts and Golgi complex are dispensable for proliferation and transformation. Mol. Cell. Biol. 26, 100–116 [DOI] [PMC free article] [PubMed] [Google Scholar]
- 52. Gentry L. R., Martin T. D., Reiner D. J., and Der C. J. (2014) Ral small GTPase signaling and oncogenesis: more than just 15minutes of fame. Biochim. Biophys. Acta 1843, 2976–2988 [DOI] [PMC free article] [PubMed] [Google Scholar]
- 53. Falsetti S. C., Wang D. A., Peng H., Carrico D., Cox A. D., Der C. J., Hamilton A. D., and Sebti S. M. (2007) Geranylgeranyltransferase I inhibitors target RalB to inhibit anchorage-dependent growth and induce apoptosis and RalA to inhibit anchorage-independent growth. Mol. Cell. Biol. 27, 8003–8014 [DOI] [PMC free article] [PubMed] [Google Scholar]
- 54. Gentry L. R., Nishimura A., Cox A. D., Martin T. D., Tsygankov D., Nishida M., Elston T. C., and Der C. J. (2015) Divergent roles of CAAX motif-signaled posttranslational modifications in the regulation and subcellular localization of Ral GTPases. J. Biol. Chem. 290, 22851–22861 [DOI] [PMC free article] [PubMed] [Google Scholar]
- 55. Diaz-Rohrer B. B., Levental K. R., Simons K., and Levental I. (2014) Membrane raft association is a determinant of plasma membrane localization. Proc. Natl. Acad. Sci. U.S.A. 111, 8500–8505 [DOI] [PMC free article] [PubMed] [Google Scholar]
- 56. Levental I., and Veatch S. (2016) The continuing mystery of lipid rafts. J. Mol. Biol. 428, 4749–4764 [DOI] [PMC free article] [PubMed] [Google Scholar]
- 57. Carquin M., D'Auria L., Pollet H., Bongarzone E. R., and Tyteca D. (2016) Recent progress on lipid lateral heterogeneity in plasma membranes: from rafts to submicrometric domains. Prog. Lipid Res. 62, 1–24 [DOI] [PMC free article] [PubMed] [Google Scholar]
- 58. Gao X., Lowry P. R., Zhou X., Depry C., Wei Z., Wong G. W., and Zhang J. (2011) PI3K/Akt signaling requires spatial compartmentalization in plasma membrane microdomains. Proc. Natl. Acad. Sci. U.S.A. 108, 14509–14514 [DOI] [PMC free article] [PubMed] [Google Scholar]
- 59. Pike L. J., and Miller J. M. (1998) Cholesterol depletion delocalizes phosphatidylinositol bisphosphate and inhibits hormone-stimulated phosphatidylinositol turnover. J. Biol. Chem. 273, 22298–22304 [DOI] [PubMed] [Google Scholar]
- 60. van Rheenen J., Achame E. M., Janssen H., Calafat J., and Jalink K. (2005) PIP2 signaling in lipid domains: a critical re-evaluation. EMBO J. 24, 1664–1673 [DOI] [PMC free article] [PubMed] [Google Scholar]
- 61. Ji C., Zhang Y., Xu P., Xu T., and Lou X. (2015) Nanoscale landscape of phosphoinositides revealed by specific pleckstrin homology (PH) domains using single-molecule superresolution imaging in the plasma membrane. J. Biol. Chem. 290, 26978–26993 [DOI] [PMC free article] [PubMed] [Google Scholar]
- 62. Roy S., Plowman S., Rotblat B., Prior I. A., Muncke C., Grainger S., Parton R. G., Henis Y. I., Kloog Y., and Hancock J. F. (2005) Individual palmitoyl residues serve distinct roles in H-ras trafficking, microlocalization, and signaling. Mol. Cell. Biol. 25, 6722–6733 [DOI] [PMC free article] [PubMed] [Google Scholar]
- 63. Prior I. A., Muncke C., Parton R. G., and Hancock J. F. (2003) Direct visualization of Ras proteins in spatially distinct cell surface microdomains. J. Cell Biol. 160, 165–170 [DOI] [PMC free article] [PubMed] [Google Scholar]
- 64. Abankwa D., Gorfe A. A., Inder K., and Hancock J. F. (2010) Ras membrane orientation and nanodomain localization generate isoform diversity. Proc. Natl. Acad. Sci. U.S.A. 107, 1130–1135 [DOI] [PMC free article] [PubMed] [Google Scholar]
- 65. Woo J., and von Arnim A. G. (2008) Mutational optimization of the coelenterazine-dependent luciferase from Renilla. Plant Methods 4, 23. [DOI] [PMC free article] [PubMed] [Google Scholar]
- 66. Szentpetery Z., Várnai P., and Balla T. (2010) Acute manipulation of Golgi phosphoinositides to assess their importance in cellular trafficking and signaling. Proc. Natl. Acad. Sci. U.S.A. 107, 8225–8230 [DOI] [PMC free article] [PubMed] [Google Scholar]
- 67. Várnai P., Tóth B., Tóth D. J., Hunyady L., and Balla T. (2007) Visualization and manipulation of plasma membrane-endoplasmic reticulum contact sites indicates the presence of additional molecular components within the STIM1-Orai1 Complex. J. Biol. Chem. 282, 29678–29690 [DOI] [PubMed] [Google Scholar]
- 68. Balla T., Bondeva T., and Várnai P. (2000) How accurately can we image inositol lipids in living cells? Trends Pharmacol. Sci. 21, 238–241 [DOI] [PubMed] [Google Scholar]
Associated Data
This section collects any data citations, data availability statements, or supplementary materials included in this article.