Abstract
Background
The optic radiation (OR) is a white-matter bundle connecting the lateral geniculate body and the visual cortex. Phase difference-enhanced imaging (PADRE) is a new MRI technique that is able to achieve precise delineation of the OR. The aim of this study was to investigate the effect of age on the volume and signal intensity of the OR using PADRE, and to establish a volumetric reference of the OR from a healthy population, compared with diffusion tensor imaging (DTI).
Material/Methods
Thirty-nine healthy volunteers underwent MR imaging with PADRE and DTI sequences on a 3.0-T scanner. For the volumetric analysis with PADRE, the OR corresponding to the external sagittal stratum was manually traced, while an automated thresholding method was used for the DTI-based volumetric analysis of the OR.
Results
The mean right and left OR volumes measured from the PADRE images were 1469.0±242.4 mm3 and 1372.6±310.2 mm3, respectively. Although OR volume showed no significant correlation with age, the normalized OR signal intensity showed a linear correlation with increasing age (r2=0.50–0.53; P<0.01). The OR signal intensity on PADRE and DTI-related quantitative parameters for the OR showed significant correlations (r2=0.46–0.49; P<0.01).
Conclusions
The PADRE technique revealed exceptional preservation of OR volume, even in later life. Moreover, PADRE was able to detect age-related changes in signal intensity of the OR and may contribute to future analyses of pathological neurodegeneration in patients with glaucoma and multiple sclerosis.
MeSH Keywords: Age Distribution, Magnetic Resonance Imaging, Visual Pathways
Background
The optic radiation (OR) is a white matter bundle connecting the lateral geniculate body and the visual cortex of the occipital lobe in each cerebral hemisphere, and represents the contralateral half of the visual field. In the periventricular region, 3 anatomical structures exist parallel to the lateral ventricular wall: the external sagittal stratum (ExSS), the internal sagittal stratum (which contains fibers from the colliculus), and the tapetum (which consists of fibers from the corpus callosum). Of these, only the ExSS is considered to be the definitive OR, since it is directly connected to the lateral geniculate body and visual cortex [1].
The magnetic resonance (MR) imaging techniques of diffusion tensor imaging (DTI) and susceptibility-weighted imaging (SWI) have previously been reported as providing excellent demarcation of the OR [2,3]. Studies employing DTI methods have reported rarefaction and loss of integrity of the OR fiber bundle in patients with glaucoma [4–6], and 2 studies have attempted to perform quantitative volumetry of the OR [5,6]. However, because of the technical limitations of DTI, these studies were not able to distinguish the influence of adjacent fiber bundles on the estimated volume of the OR. Therefore, a new imaging method for the configuration, volume, and physiopathological alterations in the integrity of the definitive OR, specifically the ExSS, is highly expected.
Recently, novel phase-weighted MR techniques termed tissue-enhanced SWI with phase differences or phase difference-enhanced imaging (PADRE) have been developed. These can selectively enhance the contrast between target tissue and the surrounding tissue, and allow clear delineation of the ExSS from adjacent fiber bundles [7]. However, little data is available regarding the configuration of the OR using PADRE.
In this study, we initially focused on a method based on PADRE to measure the volume and signal intensity of the true OR fibers, specifically those within the ExSS, compared with similar measurements obtained using a DTI-based method. Secondly, we investigated the normal effect of age on the OR section within the ExSS.
Material and Methods
Patients
Thirty-nine healthy volunteers (19 males and 20 females; mean age 44.4±16.1 years; age range 21–78 years) recruited from subjects who underwent routine medical check-ups at the Sendai Open Hospital (Tsurugaya, Miyagino-ku, Sendai, Japan) participated in this study. Ophthalmological examinations were performed, and those with increased intraocular pressure, optic nerve atrophy, visual field disturbances, or thinning of the retinal nerve fiber layer were excluded. Written informed consent was obtained from each participant after a full explanation of the purpose and procedures of this study. This study was approved by the Institutional Review Board of Tohoku University (registry number 2016-1-848).
MRI data acquisition
All participants underwent MR imaging on an Achieva dStream 3.0-T scanner (Philips, Best, the Netherlands) with a 15-channel head coil. The PADRE imaging used a 3D T1-weighted fast-field-echo sequence with the following parameters: repetition time (TR) 31 ms; echo time (TE) 12/17.9/23.8 ms; flip angle (FA) 10°; field of view (FOV) 230×193×80 mm3; matrix size 320×320; and voxel size 0.45×0.45×0.5 mm3. The scan duration was 372 s. The PADRE technique followed that described by Kakeda et al. [8]. Its power lies in its selection of the phase difference, which enhances the magnetic properties of the target tissue. Although SWI identifies phase differences that are mainly related to veins, the PADRE technique is able to select and classify various phase differences, Δθ, to enhance the contrast of different tissues. Tissues are enhanced on the magnitude image |ρ| with the enhancing function w(Δθ), which is less than 1, as well as SWI. PADRE can demonstrate structure with selected phase difference, such as myelinated fiber, as a lower signal. Finally, the PADRE image ρPADRE is reconstructed as:
We optimized the PADRE reconstruction parameters to enhance the magnetic contrast of the target tissues representing the OR tract, and then reconstructed the PADRE images from the MR data.
DTI was performed using single-shot echo-planar imaging with the following parameters: TR/TE 7316/83 ms; FA 90°; FOV 224×224×126 mm3; matrix size 112×112; 2-mm-thick slices; and a voxel size of 2×2×2 mm3. Diffusion weighting was applied along 32 directions with a b-value of 800 s/mm2, resulting in a scan duration of 322 s.
Visual evaluation of the PADRE images
A neuroradiologist visually assessed the PADRE images, and measured the thickness of the ExSS and the distance from the wall of the lateral ventricles to the medial border of the ExSS at the level of the trigone of the lateral ventricles, on 1 representative raw axial-slice image.
Quantitative volumetric analysis
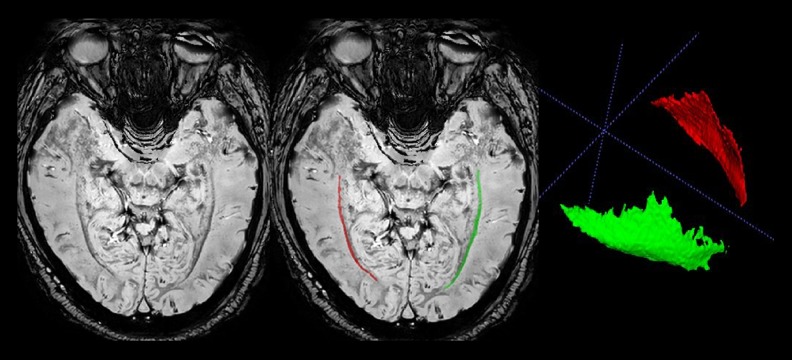
Two observers blinded to the subject information conducted manual 3D segmentation of the PADRE images using ITKsnap [9]. The right and left ExSS were traced on all 3D-reconstructed slices according to the documented anatomical structure of the OR (Figure 1), and the volumetric information and signal intensity of each ROI were then extracted. To normalize the mean signal intensity of the OR on the PADRE sequences, the mean signal intensity of the OR was divided by the mean signal intensity within a 23-mm3 spherical volume of interest set in the white matter lateral to the bilateral ExSS of each participant. To evaluate the reliability of this method, 2 observers re-conducted segmentations on 7 randomly selected subjects, about 2 weeks after the original segmentations were performed.
Figure 1.
Representative axial sections of phase difference enhanced (PADRE) images. The characteristic 4 layers, presumably corresponding to the tapetum (a high-signal intensity layer), internal sagittal stratum (a median-signal intensity layer), external sagittal stratum (a low-signal intensity layer), and adjacent white matter (a high-signal intensity layer), are visible beside the lateral ventricles. The external sagittal stratum can be clearly noted as the band with the lowest signal intensity, which differentiates it from surrounding tissue. The red and green regions of interest demonstrate the right and left external sagittal stratum, respectively.
Probability map of the OR
A probability map simply depicts the spatial distribution of the structure of interest, here Optic Radiation, across subjects. This is generally conducted using spatial registration to better match subjects of the group together, and it is also frequently used to generate atlases [10–12].
A distribution probability map of the OR was produced from the PADRE-based segmentations of the OR tracts. This was produced to quantitatively assess the spatial extent of the OR across subjects. Firstly, a target space was created by registering all the PADRE images to their common average using affine-only transformations, to preserve the individual OR variations while removing global size effects. By this method, a population-average PADRE image and a set of individual transformation matrices were obtained. The segmentation maps were then warped and the voxels summed to obtain the final spatial extent map.
Definition of the OR based on DTI
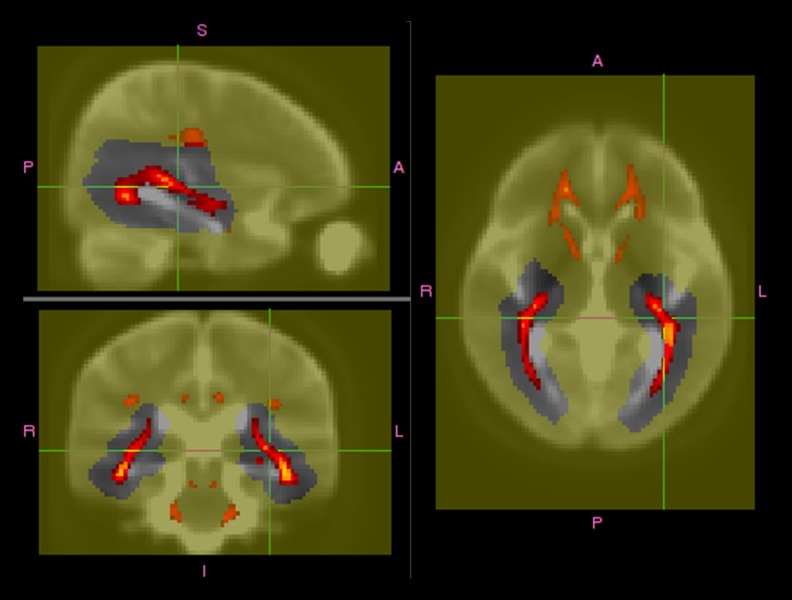
A previous study [13] using DTI-based images simply delineated the OR by including all voxels whose principal water-diffusion direction was parallel to the main direction of the OR, corresponding to the green component of an RGB-coded diffusion map. At each voxel, the principal-direction vector was projected onto a vector pointing in the anterior–posterior direction. A template-space image and associated affine transformations were then created to: 1) accurately define the direction parallel to the OR in all subjects, despite different head positions in the scanner; and 2) define a loose OR ROI mask. The template image was created from the b=0 images using affine transformations. The OR was then defined on the resulting scalar map as every voxel within the loose optic radiation mask above a threshold value of 0.5 (Figure 2). The volumes, mean MD, and mean FA of these newly defined OR masks were then computed. A spatial distribution probability map was also generated by averaging the DTI-based segmentations.
Figure 2.
Definition of the population-mean optic radiation (OR) region of interest (ROI) using DTI-based segmentation. The red–yellow color range, which runs from 0.5 to 1, represents the proportion of all subjects’ ROIs computed using the DTI method, coregistered using affine transformations, and thresholded. The background image is the average of all the coregistered b=0 images. The yellow color is the intersubject mask used to approximately locate the OR.
Statistical analysis
All data were stored on a personal computer and analyzed using commercially available software (SPSS version 15.0, SPSS Inc, Chicago, IL). Continuous data that were normally distributed using the D’Agostino-Pearson normality test were compared using a t test or analysis of variance with post hoc Bonferroni–Dunn correction, where appropriate. For comparisons between data determined by 2 methods, Pearson or Spearman correlation coefficients were established. Linear regression was calculated using the least-squares method. To compare the OR volume aging effects obtained from the PADRE and DTI methods, both relationships were fitted using linear, quadratic, and cubic regression models. The best model (best adjusted r2) for each trajectory was then selected. All data are expressed as the mean ± standard deviation (SD). A P value less than 0.05 was considered statistically significant.
Results
Visual evaluation of the OR
The ExSS is clearly recognizable as the layer with the lowest signal beside the lateral ventricles. The thickness of the ExSS ranged from 1.03 to 1.45 mm (1.15±0.09 mm). The distance from the lateral ventricles to the medial border of the ExSS ranged from 2.97 to 4.73 mm (3.88±0.54 mm).
Volumetric information on the OR
The means of the right and left OR volumes for all subjects were 1469.0±242.4 mm3 and 1372.6±310.2 mm3 respectively, with a total mean OR volume of 2841.7±512.2 mm3. No significant sex-related difference was found. Twenty-eight of the 39 participants (71.8%) had a larger right OR, with the difference in right and left OR volumes being statistically significant (P=0.03).
According to the DTI-based metric, the means and standard deviations of the right and left OR volumes for all subjects were 1236.8±439.6 mm3 and 1594.8±507.9 mm3, respectively (total 2831.6±924.1 mm3). The right, left, and total volumes of the OR in the male group were significantly larger than those in the female group (P=0.03). There were no statistically significant differences between the right and left OR volumes (P=0.15).
Comparison of OR spatial extent maps and age-related volume trajectories
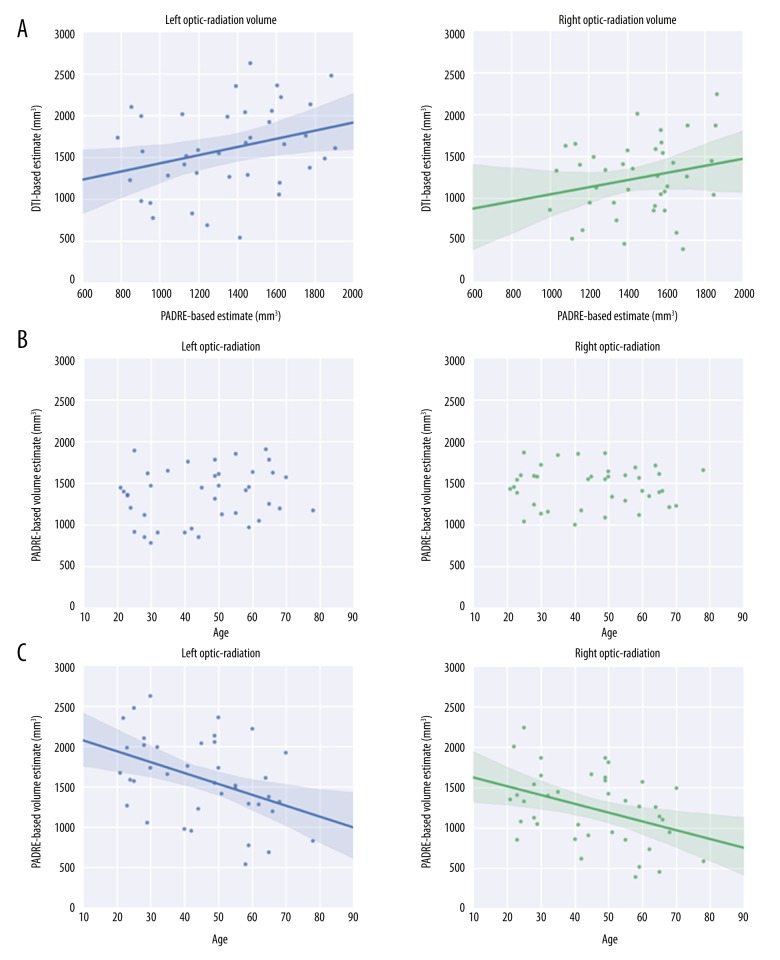
A weak but statistically significant correlation of the OR volumes was found between the 2 parameters (r2=0.16; P<0.001) (Figure 3A). Polynomial functions demonstrated no statistically significant association with increasing age (P=0.36) (Figure 3B). Age-related trajectories of right and left volumes of the OR on DTI showed a statistically significant (r=−0.52; P<0.001) negative linear correlation with increasing age (Figure 3C).
Figure 3.
The relationship between age and OR volume. (A) Correlation between OR volume estimates from the PADRE- and DTI-based methods. (B) Age-related trajectories of the right and left volumes of the OR measured from PADRE. (C) Age-related trajectories of right and left volumes of the OR on DTI.
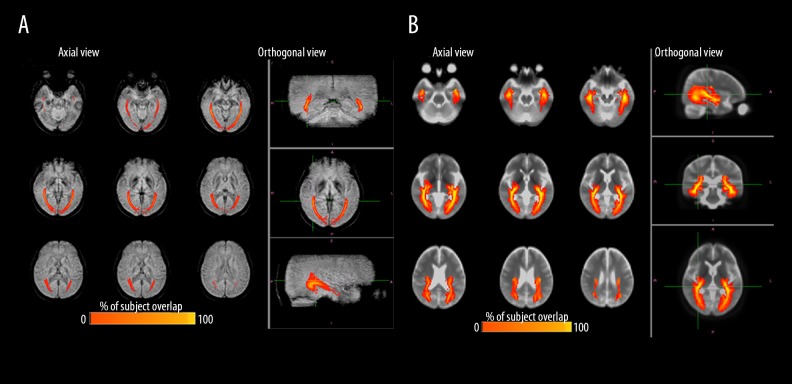
The OR pathway probability maps using the PADRE (Figure 4A) and DWI methods represent the degree of overlapping OR fibers from all the participants. Both probability maps showed a similar location for the OR, except that the probability map reconstructed by the DTI (Figure 4B) dispersed outwards more and had wider variability.
Figure 4.
Probabilistic OR maps. OR pathway probabilistic maps representing the degree of overlapping OR fibers of all 39 participants according to PADRE (A) and DTI (B).
Signal Intensities of the OR on PADRE
The normalized mean values of the right, left, and total OR signal levels for all subjects were 0.644±0.05, 0.644±0.046, and 0.644±0.0481, respectively. Twenty of the 39 participants (51.3%) had a higher normalized signal in the left OR (P=0.98). The right and left normalized signal intensities of the OR between the male group and the female group had no statistically significant difference (right: P=0.35, left: P=0.09; data not shown). The age-related trajectories of the normalized mean OR signal intensity showed a strong, linear increase with increasing age (right: r2 =0.50, P=0.003; left: r2=0.53, P<0.01) (Figure 5).
Figure 5.
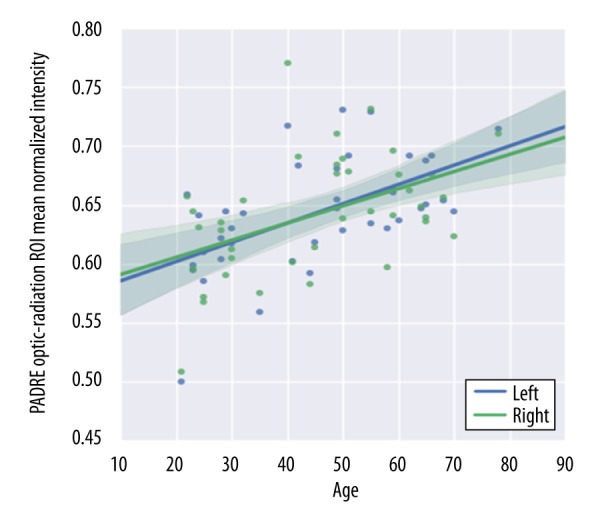
Age-related trajectories of normalized signal intensity for the OR on PADRE. The OR signal intensity on PADRE demonstrated a linear increase with age.
Statistical comparison of PADRE signal intensities with DTI
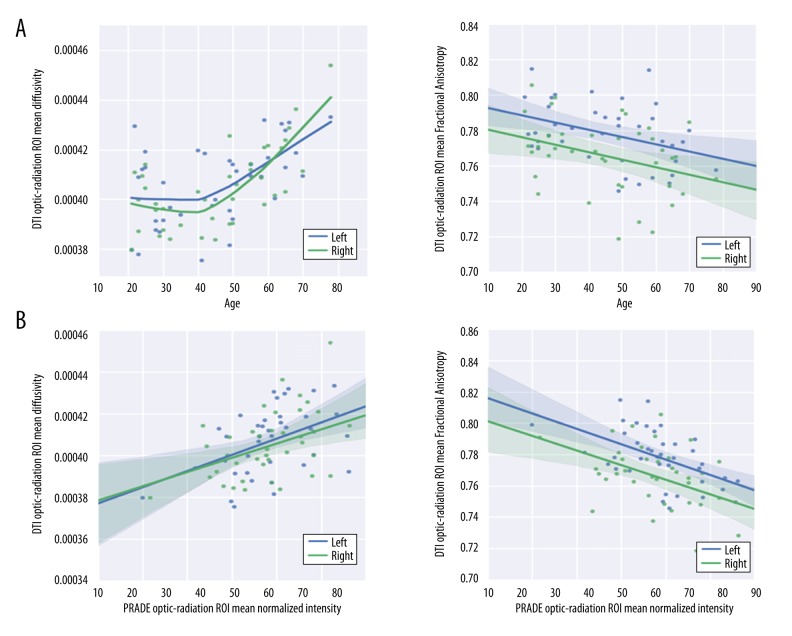
The mean and standard deviation of the MD and FA values of the right, left, and total OR for all subjects are shown in Figure 6. The age-related trajectories of the MD were stable until the age of 40, followed by a rapid increase in senescence (P=0.002) (Figure 6A, left panel), while the FA values of the OR showed a continuous decrease according to age (P=0.035) (Figure 6A, right panel).
Figure 6.
Relationships between PADRE- or DTI-related parameters and age. Age-related trajectories of the DTI-related parameters of mean diffusivity (MD) (A), and mean fractional anisotropy (FA) (B), for the OR. Correlations between the normalized signal intensity of OR on PADRE and the 2 DTI-related parameters MD (C) and FA (D).
There was a strongly significant positive correlation between normalized PADRE intensity and MD (right: r2=0.46, P=0.007, left: r2=0.49, P=0.004) (Figure 6B, left panel) and a negative correlation between PADRE intensity and FA (right: r2=0.42, P=0.003, left: r2=0.44, P=0.001) (Figure 6B, right panel).
Discussion
The principal finding of this study is that the ExSS can be depicted on PADRE as the layer with the lowest signal among the characteristic 4 layers beside the lateral ventricles. Such measurements of the thickness of the ExSS and the distance from the lateral ventricle to the medial border of the ExSS on PADRE are consistent with values reported from myelin-stained specimens in a histological investigation of the ExSS [1]. This is the first report suggesting the significance of PADRE intensity as a semi-quantitative parameter reflecting the change of OR.
Accurate knowledge of the normal age-related trajectories of the OR volume is of great importance for quantitative evaluation of pathological abnormalities of the OR (e.g., glaucoma [14] and multiple sclerosis [15]), as well as for understanding the process of white matter development and deterioration. We analyzed the volumetric information of the OR in the normal human brain using PADRE, and showed that the OR volume in healthy adults remains relatively stable throughout the lifespan (Figure 1B).
Our spatial distribution maps for the OR also indicated lower variability and improved localization in the ExSS with the PADRE method in comparison with the DTI method [16]. The voxel-based morphometry (VBM) method, which is mainly aimed at investigating cortical morphology at a global level, may be insufficiently sensitive for accurate definition of the ExSS. Reportedly, the effects of aging on the entire white matter volume peak at approximately 50 years of age, and are then followed by only a mild decline [17–19]. Our visual observations on the PADRE images of older participants revealed an increasing signal on the internal sagittal stratum, which lies beside the ExSS, and suggests an age-related alteration.
Another result from the PADRE imaging, that age-related trajectories of normalized mean OR intensity are linearly increasing, suggests that the intensity of the OR on PADRE could quantitatively depict physiological aging effects. It should be noted here that PADRE has an advantage in depicting the alteration of myelin. Compared to SWI and quantitative susceptibility mapping (QSM), which are MRI techniques using phase information, PADRE enables enhancement of the specific small phase differences between water and myelin and achieves strong contrast dedicated to myelin concentration. Information according to myelin cannot be obtained from SWI because SWI mainly selects the phase difference corresponding to deoxy-hemoglobin or iron. With QSM, quantifying comparatively larger phase difference variables from each structure, detecting minor changes occurring in such small phase differences in white matter is challenging. Furthermore, PADRE uses T2*-weighted images as the background magnitude image. The synergistic effect of selecting myelin-specific phase difference and T2* effect sensitive to white matter heterogeneity [20] could give PADRE excellent deliverability for OR alteration.
Our study shows that the normalized signal intensity of PADRE is strongly correlated with these parameters. The present findings of age-related signal elevation in the OR on PADRE, without a volume decline, may be attributable to pathological aging effects, including altered water content and fluid dynamics, or rarefaction of myelin fibers within the OR. Thus, the PADRE signal could potentially be used as a quantitative parameter to reflect the integrity of OR fibers, as is the case with MD and FA. Further investigations, including animal experiments on pathological aging effects in the OR, are required to confirm our observations on PADRE.
The present study has several limitations. Firstly, there was a small number of participants (n=39), and they had a large range of age (21–78 years). Therefore, some of the statistically insignificant parameters in this study may have not reached sufficient statistical power. These issues need to be examined in future studies with larger sample sizes. Secondly, our manual segmentation method for defining the ExSS was time-consuming and involved a great deal of careful attention to provide consistency. The development of a more objective automated segmentation method would therefore be beneficial. Lastly, we lacked data from individuals with pathological conditions, including glaucoma, which could provide rich information on pathological changes in the OR. Nonetheless, the present data clearly suggest that PADRE can be a clinically relevant measure of pathway-specific white matter integrity in accordance to age. Normalization of signal intensities and standardization of acquisition parameters are necessary for future widespread use of signal intensity as a true quantitative parameter.
Conclusions
In summary, PADRE can provide more reliable volumetric information on the OR, which can be restricted to the ExSS. The spatial pattern of intracortical neurodevelopment follows a posterior–anterior gradient, and early maturation of the occipital visual cortices and occipital white matter have been reported [17,21]. The PADRE-based probability map of the OR would therefore become a useful reference for future studies on the pathological neurodegeneration in patients suffering from glaucoma and multiple sclerosis.
Acknowledgments
The authors are grateful to Dr. Tetsuya Yoneda (Department of Medical Physics in Advanced Biomedical Sciences, Faculty of Life Sciences, Kumamoto University, Kumamoto, Japan) for valuable comments on PADRE data acquisition. We also thank Dr. Izumi Matsudaira and Ms. Kaori Yamada for their assistance with data acquisition and clerical support.
Footnotes
Portions of this work were presented in abstract form (Abstract No.1584) at the Organization of Human Brain Mapping (OHBM) 2015, Honolulu, HI, June 16, 2015
Conflicts of interest
None.
Source of support: This work was funded by the Grant-in-Aid for Young Scientists (B) from the Japan Society for the Promotion of Science (Project No: 26860971), the Young Investigator Grant of Tohoku University Hospital, and the Project to Promote Gender Equality and Female Researchers of Tohoku University (TUMUG Support Project) to Dr. Tatewaki
References
- 1.Kitajima M, Korogi Y, Takahashi M, et al. MR signal intensity of the optic radiation. Am J Neuroradiol. 1996;17:1379–83. [PMC free article] [PubMed] [Google Scholar]
- 2.Taoka T, Sakamoto M, Nakagawa H, et al. Diffusion tensor tractography of the meyer loop in cases of temporal lobe resection for temporal lobe epilepsy: Correlation between postsurgical visual field defect and anterior limit of meyer loop on tractography. Am J Neuroradiol. 2008;29:1329–34. doi: 10.3174/ajnr.A1101. [DOI] [PMC free article] [PubMed] [Google Scholar]
- 3.Mori N, Miki Y, Kasahara S, et al. Susceptibility-weighted imaging at 3 Tesla delineates the optic radiation. Invest Radiol. 2009;44:140–45. doi: 10.1097/RLI.0b013e318193ff25. [DOI] [PubMed] [Google Scholar]
- 4.Boucard CC, Hanekamp S, Curcic-Blake B, et al. Neurodegeneration beyond the primary visual pathways in a population with a high incidence of normal-pressure glaucoma. Ophthalmic Physiol Opt. 2016;36:344–53. doi: 10.1111/opo.12297. [DOI] [PubMed] [Google Scholar]
- 5.Lee DH, Park JW, Hong CP. Quantitative volumetric analysis of the optic radiation in the normal human brain using diffusion tensor magnetic resonance imaging-based tractography. Neural Regen Res. 2014;9:280–84. doi: 10.4103/1673-5374.128223. [DOI] [PMC free article] [PubMed] [Google Scholar]
- 6.Michelson G, Engelhorn T, Warntges S, et al. DTI parameters of axonal integrity and demyelination of the optic radiation correlate with glaucoma indices. Graefes Arch Clin Exp Ophthalmol. 2013;251:243–53. doi: 10.1007/s00417-011-1887-2. [DOI] [PubMed] [Google Scholar]
- 7.Ide S, Kakeda S, Korogi Y, et al. Delineation of optic radiation and stria of gennari on high-resolution phase difference enhanced imaging. Acad Radiol. 2012;19:1283–89. doi: 10.1016/j.acra.2012.05.018. [DOI] [PubMed] [Google Scholar]
- 8.Kakeda S, Korogi Y, Yoneda T, et al. A novel tract imaging technique of the brainstem using phase difference enhanced imaging: Normal anatomy and initial experience in multiple system atrophy. Eur Radiol. 2011;21:2202–10. doi: 10.1007/s00330-011-2158-7. [DOI] [PubMed] [Google Scholar]
- 9.Yushkevich PA, Piven J, Hazlett HC, et al. User-guided 3D active contour segmentation of anatomical structures: Significantly improved efficiency and reliability. Neuroimage. 2006;31:1116–28. doi: 10.1016/j.neuroimage.2006.01.015. [DOI] [PubMed] [Google Scholar]
- 10.Klein A, Andersson J, Ardekani BA, et al. Evaluation of 14 nonlinear deformation algorithms applied to human brain mri registration. Neuroimage. 2009;46:786–802. doi: 10.1016/j.neuroimage.2008.12.037. [DOI] [PMC free article] [PubMed] [Google Scholar]
- 11.Evans AC, Collins DL, Mills SR, et al. 3D statistical neuroanatomical models from 305 MRI volumes. In: Klainsner L, editor. Proceeding of the IEEE-Nuclear Science Symposium and Medical Imaging Conference (NCS/MIC); 1993 Oct 31–Nov 6; San Francisco, CA, USA. pp. 1813–17. [Google Scholar]
- 12.Mazziotta JC, Toga AW, Evans A, et al. A probabilistic atlas of the human brain: Theory and rationale for its development. The international consortium for brain mapping (ICBM) Neuroimage. 1995;2:89–101. doi: 10.1006/nimg.1995.1012. [DOI] [PubMed] [Google Scholar]
- 13.Engelhorn T. 3T DTI in patients with glaucoma. New approaches for data analysis and clinical implications. MAGNETOM Flash [serial online] 2013. Feb, pp. 3–11. Available from: https://www.healthcare.siemens.fi/news/glaucoma.html.
- 14.Sidek S, Ramli N, Rahmat K, et al. Glaucoma severity affects diffusion tensor imaging (DTI) parameters of the optic nerve and optic radiation. Eur J Radiol. 2014;83:1437–41. doi: 10.1016/j.ejrad.2014.05.014. [DOI] [PubMed] [Google Scholar]
- 15.Zhang X, Zhang F, Huang D, et al. Contribution of gray and white matter abnormalities to cognitive impairment in multiple sclerosis. Int J Mol Sci. 2016;18:46. doi: 10.3390/ijms18010046. [DOI] [PMC free article] [PubMed] [Google Scholar]
- 16.Zikou AK, Kitsos G, Tzarouchi LC, et al. Voxel-based morphometry and diffusion tensor imaging of the optic pathway in primary open-angle glaucoma: A preliminary study. Am J Neuroradiol. 2012;33:128–34. doi: 10.3174/ajnr.A2714. [DOI] [PMC free article] [PubMed] [Google Scholar]
- 17.Westlye LT, Walhovd KB, Dale AM, et al. Life-span changes of the human brain white matter: Diffusion tensor imaging (DTI) and volumetry. Cereb Cortex. 2010;20:2055–68. doi: 10.1093/cercor/bhp280. [DOI] [PubMed] [Google Scholar]
- 18.Tamnes CK, Ostby Y, Fjell AM, et al. Brain maturation in adolescence and young adulthood: Regional age-related changes in cortical thickness and white matter volume and microstructure. Cereb Cortex. 2010;20:534–48. doi: 10.1093/cercor/bhp118. [DOI] [PubMed] [Google Scholar]
- 19.Sato K, Taki Y, Fukuda H, et al. Neuroanatomical database of normal Japanese brains. Neural Netw. 2003;16:1301–10. doi: 10.1016/j.neunet.2003.06.004. [DOI] [PubMed] [Google Scholar]
- 20.Bender B, Klose U. The in vivo influence of white matter fiber orientation towards B0 on T2* in the human brain. NMR Biomed. 2010;23:1071–76. doi: 10.1002/nbm.1534. [DOI] [PubMed] [Google Scholar]
- 21.Westlye LT, Walhovd KB, Dale AM, et al. Differentiating maturational and aging-related changes of the cerebral cortex by use of thickness and signal intensity. Neuroimage. 2010;52:172–85. doi: 10.1016/j.neuroimage.2010.03.056. [DOI] [PubMed] [Google Scholar]


