Abstract
Background
Weight gain early after transplant is a risk factor for posttransplant metabolic syndrome (PTMS), cardiovascular events, and renal insufficiency. The impact of mammalian target of rapamycin inhibition on posttransplant weight gain and the development of PTMS components postliver transplantation were examined in a randomized, controlled study.
Methods
After a run-in period, patients (N = 719) were randomized at 30 ± 5 days posttransplant in a 1:1:1 ratio to 3 treatment groups: (i) everolimus (EVR) + reduced tacrolimus (TAC) (n = 245); (ii) TAC control (n = 243) or (iii) TAC elimination (n = 231). In this post hoc analysis, weight change at 12 and 24 months was compared between groups. Vital signs, lipids, and laboratory parameters at 12 and 24 months and rates of PTMS were assessed.
Results
Mean increase in weight from baseline was higher at month 12 in the TAC control arm (8.15 ± 9.27 kg) than in the EVR + reduced TAC (5.88 ± 12.60 kg, P = 0.056) and the TAC elimination arms (4.76 ± 9.94 kg, P = 0.007). At month 24, the TAC control arm displayed a significantly greater weight increase (9.54 ± 10.21 kg) than either the EVR + reduced TAC (6.69 ± 8.37 kg, P = 0.011) or the TAC elimination groups (6.01 ± 9.98 kg, P = 0.024). Rates of PTMS were similar for the EVR + reduced TAC (71.8%), TAC elimination (70.3%) and TAC control (67.4%) arms (P = NS).
Conclusions
EVR with reduced-exposure TAC attenuated weight gain at 1 and 2 years posttransplant compared with a standard TAC immunosuppression regimen. Rates of PTMS were comparable between EVR-containing and TAC control regimens.
In this randomized controlled trial, liver recipients on tacrolimus reduced or eliminated immunosuppressions gain less weight at 1 and 2 years. Whereas, the chances of developing posttransplant metabolic syndrome not affected. The role of everolimus in this regard remains unclear.
Obesity increases in prevalence and severity after liver transplantation.1 Many of the most frequent causes of long-term mortality after liver transplantation are associated with or are exacerbated by obesity before or after transplantation.2 Two thirds of long-term mortality after liver transplant is unrelated to graft function, with cardiovascular (CV) complications being a common cause of nongraft-related mortality and morbidity.3-5 Metabolic syndrome, a clustering of cardiometabolic risk factors including obesity, hyperglycemia, dyslipidemia and elevated blood pressure, is an important risk factor in the development of CV disease. Therefore, reduction in the development of posttransplant metabolic syndrome (PTMS) or its components should be a major management focus to optimize outcomes after liver transplantation.
Several studies have shown a link between weight gain, dyslipidemia, PTMS, and increased posttransplantation morbidity.6,7 In a retrospective review of 455 liver transplant recipients from 1999 to 2004, the prevalence of obesity increased from 23.8% at 4 months to 40.8% at 3 years after liver transplant and predicted metabolic syndrome at 1 year posttransplant.7 Prior CV disease, hypertension, and diabetes were also associated with increased CV risk. PTMS is associated with higher posttransplantation body mass index (BMI) and with a significantly increased risk of major vascular events.6
The basis of weight gain after liver transplantation is likely to be multifactorial, with an important contribution from immunosuppressive agents. Although a role of calcineurin inhibitor (CNI)-based immunosuppression in weight gain, hypertension, hyperglycemia, and dyslipidemia in liver transplant recipients has been reported, the relative impact of mammalian target of rapamycin inhibition (mTORi) on these factors has not. A study of weight gain in liver transplant patients receiving tacrolimus (TAC) versus cyclosporine A (CsA), with or without corticosteroids, demonstrated similar levels of weight gain between the 2 CNIs with a limited impact of corticosteroids.8 However, TAC use versus non–CNI-based immunosuppression was associated with a reduced risk of CV disease in a retrospective review of 455 liver transplant recipients.7
The signaling molecule mTOR is a regulator of cell mass and growth. In animal studies, the use of mTOR inhibitors has been associated with lower body mass when compared with CNIs.9-11
In liver transplant patients, mTOR inhibitors are known to contribute to dyslipidemia posttransplant.12 The early introduction of the mTOR inhibitor everolimus (EVR) in combination with reduced TAC is associated with improved renal function 2 years postliver transplantation.13 However, the effect of this immunosuppressive regimen on body weight and other PTMS related factors is less clear. The aim of the current study was to assess the comparative impact of mTOR inhibition on the course of posttransplant weight gain and the development of components of PTMS in subjects after liver transplantation using data collected in the randomized, controlled RAD001H2304 study.13,14
MATERIALS AND METHODS
Study Design and Conduct
The methodology and inclusion/exclusion criteria of this study have been described in detail previously.13 Briefly, this was a 24-month prospective, randomized, multicenter, 3-arm, parallel-group, open-label study in de novo liver transplant recipients during January 2008 to April 2012. After a run-in period where the immunosuppression regimen was identical for all groups, patients (N = 719) were randomized at 30 ± 5 days posttransplant in a 1:1:1 ratio to 1 of 3 treatment groups: (i) EVR + reduced TAC; (ii) TAC control or (iii) TAC elimination. The trial was conducted in accordance with the Declaration of Helsinki and Good Clinical Practice guidelines, and all patients provided written informed consent.
Study Objectives
We present post hoc analyses to examine the effect of each treatment arm on body weight and other PTMS-related factors including blood pressure, heart rate, glycosylated hemoglobin (HbA1c), total cholesterol, high-density lipoprotein (HDL), lactate dehydrogenase, triglycerides and glucose (fasting), creatinine, lipid profile, and routine laboratory parameters were also evaluated.
Subgroup analyses of weight change were performed using cutoffs as follows: age, younger than 60 years and 60 years or older; sex, male or female; baseline BMI underweight, <18; normal, 18 to 25; overweight, 25 to 30; and obese, >30, HDL categories as per American Heart Association for low (male, < 40 mg/dL; female, < 50 mg/dL), normal (male, ≥ 40 mg/dL; female, ≥50 mg/dL), and optimal (≥60 mg/dL), LDL categories as per American Heart Association criteria of optimal (<100 mg/dL), near or above optimal (100 to < 130 mg/dL), borderline high (130 to < 160 mg/dL) and high (>160 mg/dL), HbA1c normal (≤5.6%) and elevated (>5.6%), systolic blood pressure (SBP), ≥140 versus <140, and patients with diabetes at baseline versus those without diabetes.
Patients with PTMS at month 12 and month 24 were identified using the following definition: at least 3 of obesity (BMI, >30 kg/m2), serum triglyceride level greater than 150 mg/dL (1.7 mmol/L) or treatment for high lipids, HDL level less than 39 mg/dL (1 mmol/L) in men and less than 50 mg/dL (1.3 mmol/L) in women, hypertension (SBP ≥140 mmHg or treatment for hypertension), and fasting plasma glucose of 100 mg/dL or greater (5.6 mmol/L) or glucose-lowering therapy.
An analysis of incidence of major adverse CV events in patients with and without PTMS was also performed to examine whether there were any effects of PTMS on CV outcomes.
Immunosuppression
In the EVR + reduced TAC arm, patients received EVR 1.0 mg twice a day as starting dose, which was adjusted from day 5 to maintain a trough level of 3 to 8 ng/mL. TAC was dosed to achieve a trough concentration of 3 to 5 ng/mL by week 3 after randomization. For the TAC control arm, the target TAC trough concentration was 8 to 12 ng/mL until 4 months posttransplant and 6 to 10 ng/mL thereafter. In the TAC elimination arm, EVR was administered as in the EVR + reduced TAC group until month 4 posttransplant, when the target trough concentration range was increased to 6 to 10 ng/mL. TAC elimination was then initiated and was to be completed by the end of month 4 posttransplant.
Statistical Methods
Analyses were performed on all randomized patients who received at least 1 dose of randomized study drug. An additional per protocol analysis of weight change was also undertaken and included randomized patients who fulfilled the requirements of the study protocol. Changes from baseline for vital signs measurements were compared between treatment groups using an analysis of variance. Median changes from baseline for laboratory measurements were compared between treatment groups using a Wilcoxon Rank Sum test. P values for the pairwise treatment comparisons of the mean were derived for the subgroups analysis. χ2 tests were used to compare rates of PTMS between treatment groups.
RESULTS
Patient Population
Of 719 patients (full analysis set) randomized to each of the treatment groups (EVR + reduced TAC, 245; TAC elimination, 231; TAC control, 243), 716 individuals (safety set) received study medication (EVR + reduced TAC, 245; TAC elimination, 229; TAC control, 242).
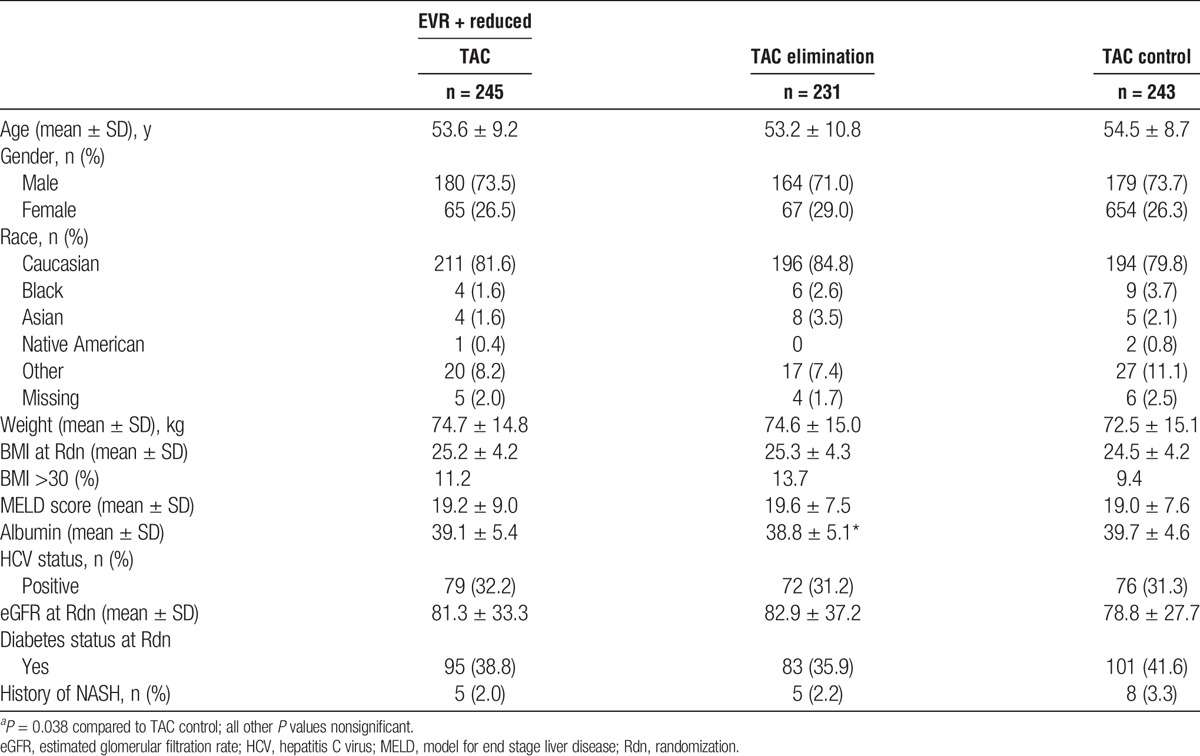
Demographics and baseline characteristics are summarized in Table 1. The 3 groups were balanced with respect to demographic and background characteristics, including weight and BMI. A BMI of over 30 was recorded in 11.2% of EVR + reduced TAC patients, 13.7% of TAC elimination patients, and 9.4% of the TAC control group. Mean MELD scores were similar between the 3 groups at 19.2, 19.6, and 19.0 for EVR + reduced TAC, TAC elimination, and TAC control groups. Baseline albumin was slightly lower in the TAC elimination than the TAC control group but there was no significant difference between the EVR + reduced TAC group and TAC control group. Rates of diabetes and nonalcoholic steatohepatitis (NASH) were also similar at baseline between the 3 treatment arms.
TABLE 1.
Demographic and baseline characteristics by treatment group (ITT population—24 month analysis)
Weight Gain
In the on-treatment analysis, mean increase in weight from baseline (30 days posttransplant) was higher at month 12 in the TAC control arm (8.15 ± 9.27 kg) than in the EVR + reduced TAC (5.88 ± 12.60 kg, P = 0.056) and the TAC elimination arms (4.76 ± 9.94 kg, P = 0.007). At month 24, the TAC control arm displayed a significantly greater weight increase (9.54 ± 10.21 kg) than either the EVR + reduced TAC (6.69 ± 8.37 kg, P = 0.011) or the TAC elimination groups (6.01 ± 9.98 kg, P = 0.024) (Table 2A and Figure 1). Results from the on-treatment analysis were further supported using a sensitivity analysis of per-protocol weight changes, in which mean increase in weight from baseline was significantly greater at months 12 (8.43 ± 8.42 kg) and 24 (9.81 ± 10.16 kg) in the TAC control arm than in the EVR + reduced TAC (month 12: 5.72 ± 13.2, P = 0.037; month 24: 6.52 ± 8.55 kg, P = 0.005) and the TAC elimination groups (month 12: 4.50 ± 9.89, P = 0.001; month 24: 5.26 ± 9.70, P = 0.002) (Table 2A and Figure 1). Excluding patients with stomatitis or mouth ulceration gave very similar results (Table 2B).
TABLE 2.
Changes in vital signs and laboratory parameters by treatment arm at 12 and 24 months
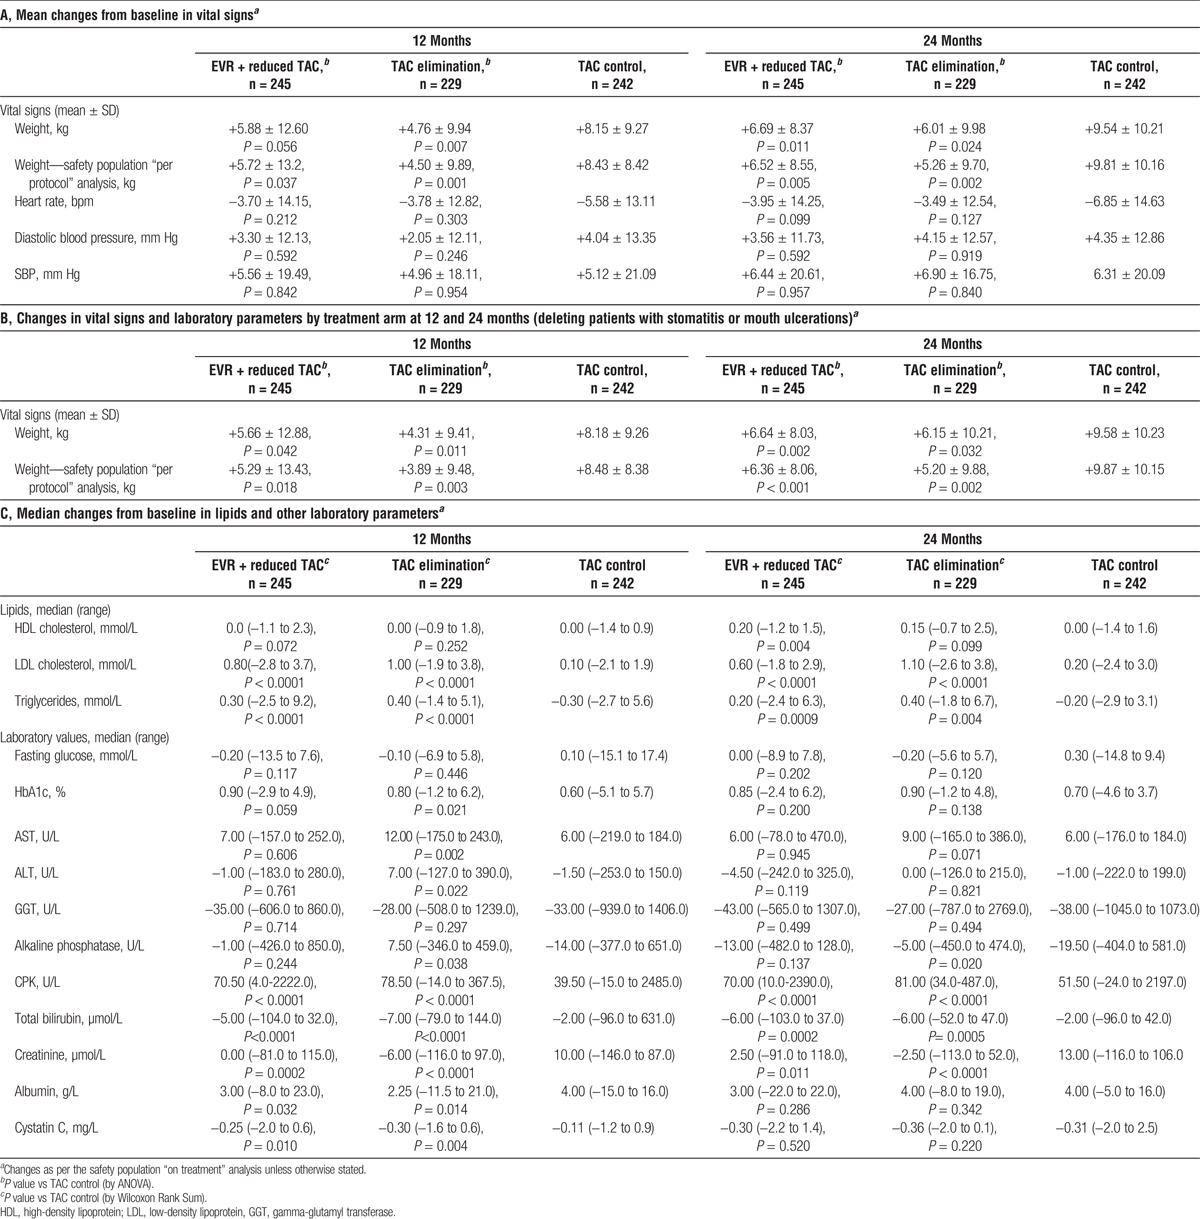
FIGURE 1.
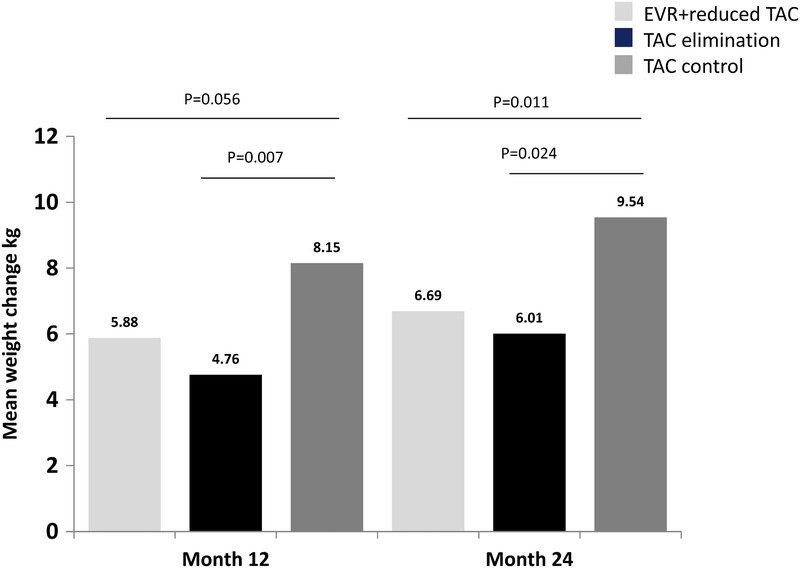
Mean weight change from baseline at 12 and 24 months. Weight gain was statistically significantly lower in the EVR containing arms (EVR + reduced TAC and TAC elimination) at 24 months.
Weight Change by Subgroups
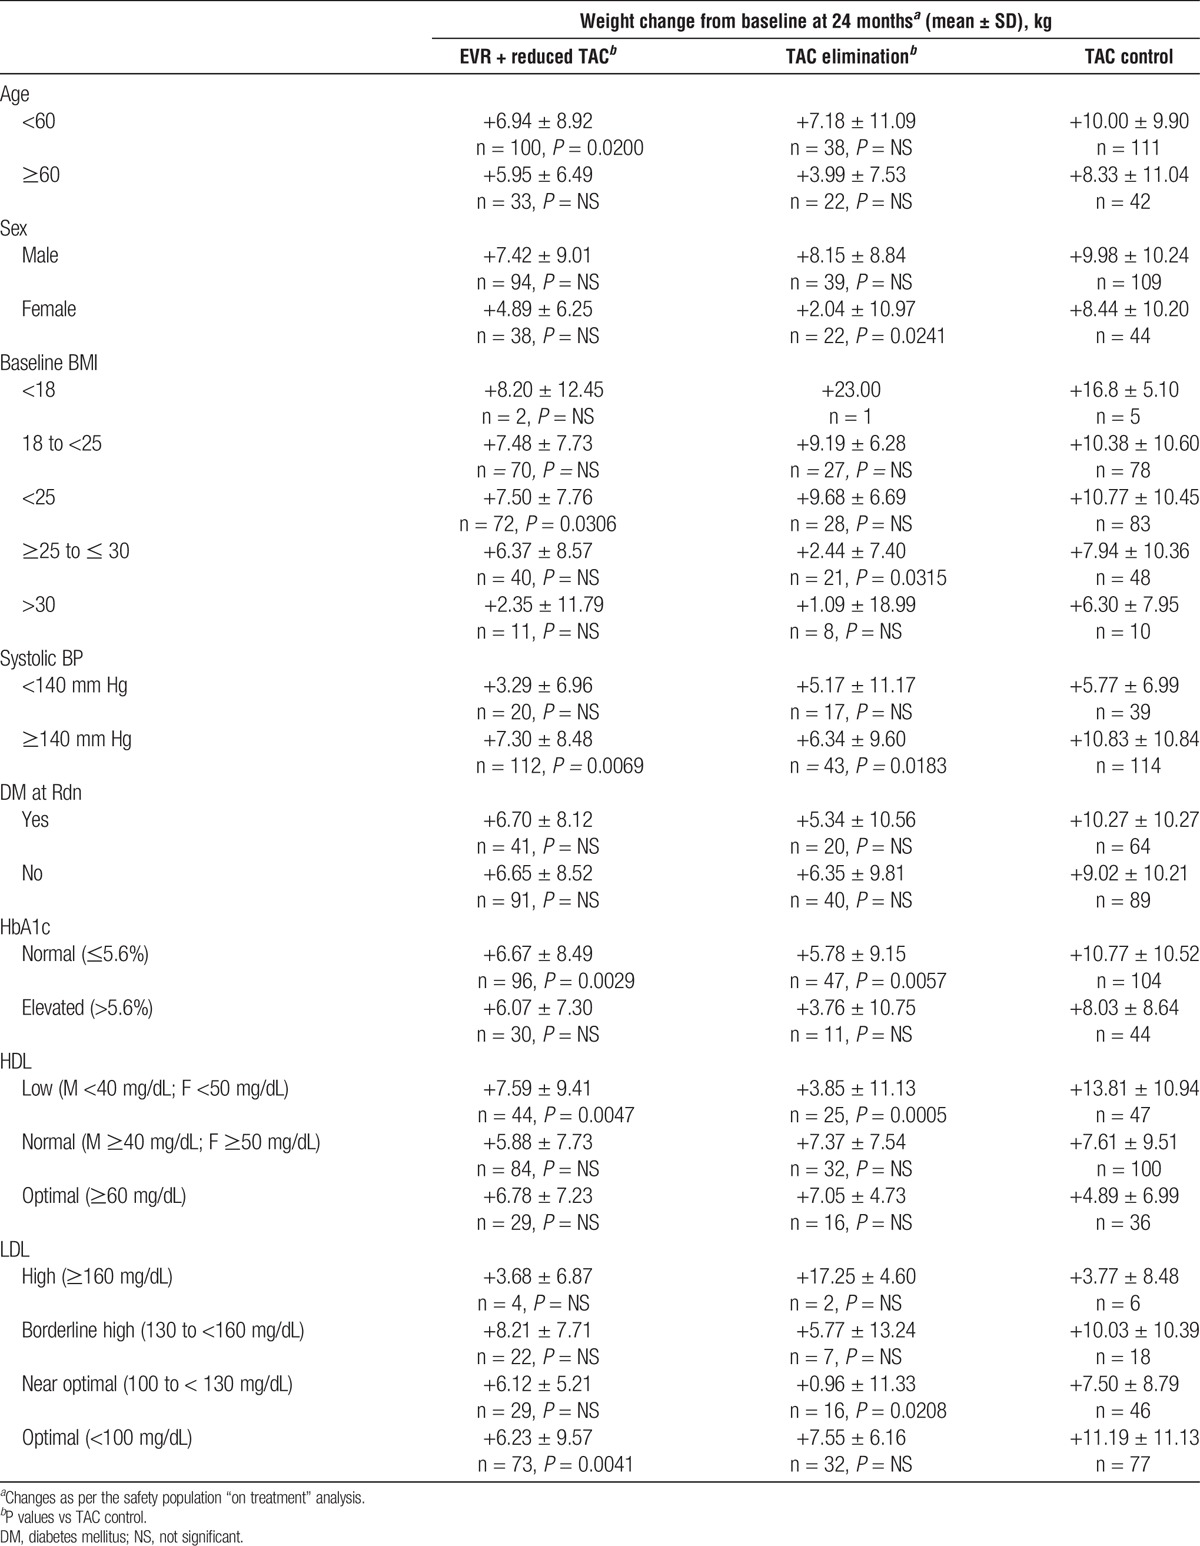
When analyzed by subgroups, weight change was significantly lower in the EVR + reduced TAC arm than in the TAC control arm for patients aged younger than 60 years (P = 0.0200), but not those aged 60 years and older (Table 3). Patients with baseline BMI less than 25 (P = 0.0306), systolic BP of 140 mm Hg or higher (P = 0.0069), normal HbA1c (P = 0.0029), low HDL (P = 0.0047), and optimal LDL (P = 0.0041) also had significantly lower weight gain in the EVR + reduced TAC arms than in the TAC control arm (Table 3). In the TAC elimination arm, weight gain was significantly lower than in the TAC control arm for female patients (P = 0.0241), those with baseline BMI ≥ 25 to ≤ 30 (P = 0.0315), systolic BP ≥140 mm Hg (P = 0.0183), normal HbA1c (P = 0.0057), low HDL (P = 0.0005), and near-optimal LDL (P = 0.0208) (Table 3).
TABLE 3.
Weight changes at 24 months by subgroup
Vital Signs, Lipids and Laboratory Measures
There were no significant changes in heart rate or blood pressure (systolic or diastolic) at months 12 and 24 between study arms (Table 2A).
Triglycerides and LDL cholesterol showed significantly greater median increases from baseline in the EVR + reduced TAC and TAC elimination arms compared with the TAC control arms at months 12 and 24. There were no significant differences in HDL cholesterol levels at month 12, although at month 24, a significantly greater increase in median HDL cholesterol was observed for the EVR + reduced TAC arm than for the TAC control group (Table 2C).
Median increase in glycosylated hemoglobin was similar across groups by month 24 (Table 2C).
Total bilirubin decreased by a significantly greater amount in the EVR-containing treatment arms than in the TAC control arm. There were no significant differences between the EVR + reduced TAC and TAC control groups for other liver chemistries, including aspartate aminotransferase (AST), alanine aminotransferase (ALT), alkaline phosphatase and GGT; however, at 12 months there were significantly higher increases in ALT, AST, and alkaline phosphatase in the TAC elimination group than for TAC control patients (Table 2C). Kidney function measures creatinine and cystatin C both showed greater reductions from baseline in the EVR + reduced TAC and TAC elimination arms than in the TAC control arm at month 12 (Table 2C).
Median changes from baseline in creatine phosphokinase (CPK) levels were significantly greater in the EVR-containing arms than in the TAC control arm at months 12 and 24 (Table 2C). Absolute mean CPK levels at 12 months were 122.5 ± 181.2, 114.2 ± 75.4 and 94.7 ± 257.0 for the EVR + reduced TAC, TAC elimination, and TAC control groups, respectively, and at 24 months were 161.3 ± 281.0, 131.9 ± 100.3 and 100.2 ± 278.8. All mean values therefore remained within normal range for CPK (60 to 174 U/L,15 depending on sex).
PTMS
Overall, 379 (52.9%) patients at baseline and 500 patients (69.8%) posttransplantation met criteria for metabolic syndrome as detailed in Methods (Table 4). Between week 5 and month 24, PTMS occurred in 176 (71.8%) patients receiving EVR + reduced TAC, 161 (70.3%) patients in the TAC elimination arm and 163 (67.4%) in the TAC Control arm (Table 4). PTMS was newly occurring in 68 (56.2%) patients receiving EVR + reduced TAC, 56 (53.3%) patients in the TAC elimination arm and 58 (52.3%) in the TAC Control arm (Table 4). There were no significant differences between the frequencies of PTMS in the EVR + reduced TAC and TAC elimination groups versus the TAC control arm (Table 4).
TABLE 4.
Incidence of PTMS and components over time (safety set)

Concomitant medication for PTMS components was allowed for in the definition of PTMS, where treatment indicated the presence of a component. In the EVR + reduced TAC group, 62.5% of patients received antihypertensive treatment posttransplant, 24.5% received lipid lowering agents and 55.9% were treated for elevated glucose. Pretransplant, 57.6% were treated for hypertension, 5.3% for lipid abnormalities, and 77.1% for glucose management. In the TAC elimination group the numbers posttransplant were 65.9%, 23.6%, and 56.8% for antihypertensive treatment, lipid lowering therapy and glucose intervention, respectively, and pretransplant were 65.9%, 3,5% and 79.5%, respectively. In the TAC control group 66.1% patients were receiving hypertension treatment posttransplant, 15.3% lipid regulation, and 56.6% treatment for blood glucose regulation. Pretransplant, 59.9% TAC control patients were treated for hypertension, 7.9% for lipid abnormalities, and 79.8% for elevated glucose.
Examining PTMS components, all showed an increased frequency to 24 months compared with baseline (Table 4). The only significant differences between groups at baseline for any PTMS component were the EVR-containing treatment arms EVR + reduced TAC and TAC Elimination showing significantly lower frequencies of elevated serum triglycerides than the TAC control arm (P = 0.010 and P = 0.026; Table 4). To month 24, there were no significant differences between treatment arms in the frequency of hypertension, obesity or lowered HDL levels. The TAC Elimination arm showed a significantly lower frequency of elevated plasma glucose to month 24 than the TAC control arm (P = 0.046; Table 4). The EVR-containing treatment arms EVR + reduced TAC and TAC Elimination showed significantly higher frequencies of elevated serum triglycerides to month 24 than the TAC control arm (P = 0.017 and P = 0.024; Table 4).
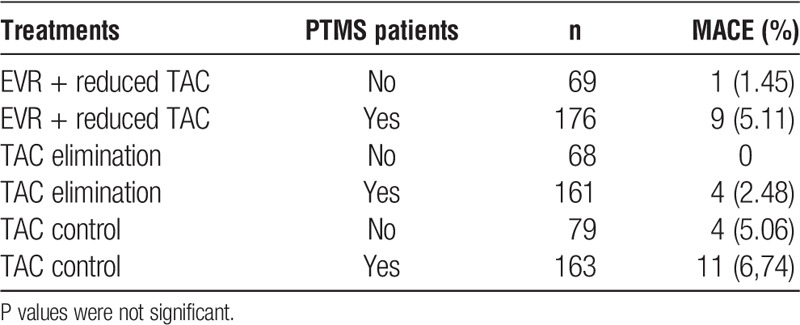
An analysis of the frequency of major adverse CV events (MACE) in all patients between week 5 and month 24 of treatment showed no differences in the rate of MACE in patients with PTMS (Table 5); however, the study was not powered to detect a statistically significant difference in outcome.
TABLE 5.
PTMS and MACE
Safety
As reported previously,13 over the 24-month study period, the overall rates of adverse events were similar between groups (Tables 6 and 7). Serious adverse events were similar between EVR + reduced TAC (56.3%) and TAC control (54.1%) groups (P = 0.6493); however, SAEs were more frequent in the TAC elimination patients (65.5%) than in the TAC control group (P = 0.0145) (Table 6) due to a higher rate of acute rejection in the TAC elimination arm.13 Discontinuation of study medication due to adverse events was more frequent in the EVR + reduced TAC arm versus TAC control (n = 70/245 [28.6%] vs 44/242 [18.2%]; Table 6).
TABLE 6.
Notable events by treatment arm at 24 months

TABLE 7.
Selected AEs and infections of interest by treatment arm at 24 months (safety population)
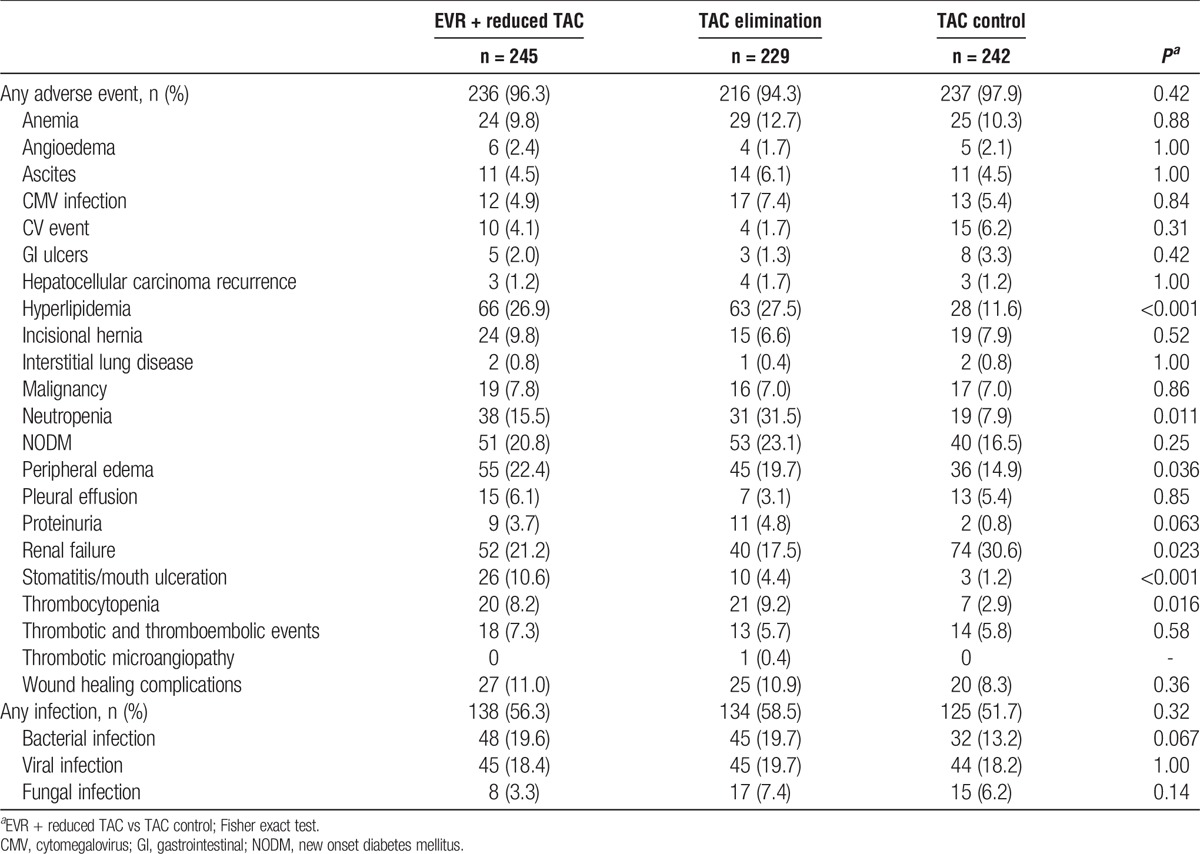
Table 7 lists selected adverse events/infections of interest by treatment arm at 24 months. The frequency of CV events and new onset diabetes mellitus were similar between treatment arms. The frequency of renal failure was significantly lower in the EVR + reduced TAC group in comparison to the TAC control group (21.1% vs 30.6%, P = 0.023). Hyperlipidemia was more frequent in the EVR-containing arms (P < 0.001). Rates of neutropenia (15.5% vs 7.9%, P = 0.011), peripheral edema (22.4% vs 14.9%, P = 0.036), stomatitis or mouth ulceration (10.6% vs 1.2%, P < 0.001), and thrombocytopenia (8.2% vs 2.9%, P = 0.016) were all greater in the EVR + reduced TAC group in comparison to the TAC control group.
DISCUSSION
Obesity is linked to increased morbidity after liver transplantation.2 Weight gain early after transplant is a risk factor for metabolic syndrome7 and associated complications. Weight gain posttransplant is also of interest in the context of rapidly increasing frequency of obesity-related liver disease (NASH) as an indication for liver transplantation. In animal studies, mTOR inhibitors have been associated with reduced weight gain compared with CNIs.9 Here, we assessed the comparative impact of mTOR inhibition on the course of postliver transplant weight gain and PTMS from baseline to month 24 in 716 patients in the context of a prospective, randomized controlled trial.
The results of this study provide a unique opportunity to examine the relative effect of EVR on weight gain and components of the metabolic syndrome after liver transplantation. The most important result of this analysis is that that early introduction of EVR with reduced-exposure TAC at 1 month after liver transplantation reduced weight gain assessed at 1 and 2 years posttransplant. Weight gain was even lower in the TAC elimination arm, suggesting that the difference can be attributed to EVR. Stomatitis and mouth ulceration did not impact the extent or pattern of weight gain observed, when the low numbers of patients affected were removed from the analysis, as might be expected for these transitory AEs.
Subjects who are obese before liver transplantation are likely to remain obese, and those who are overweight may become obese after transplant,16 with increased comorbidity and risk for major CV events.6,7 In the current study, subjects who were of normal weight at baseline who were treated with EVR plus reduced TAC gained less weight than those treated with TAC alone. Weight gain was also reduced in patients with optimal or near-optimal LDL cholesterol and normal HbA1c, suggesting that weight gain is linked to changes in other metabolic factors. Although the frequency of obesity increased posttransplant, there were no significant differences in rates of obesity between treatment arms. The impact of EVR-containing regimens on posttransplant weight gain may be more pronounced among patients with normal BMI at the time of transplantation. Although it is conceivable that there may have been a group of malnourished recipients regaining muscle mass and restoring their nutritional status after liver transplantation, detected as weight gain, there were very few patients who were underweight or had a significant extent of muscle wastage before transplantation in this study and nutritional parameters, such as albumin were not lower in the TAC control arm. Longer, larger studies will be required to determine the impact, if any, of weight gain on posttransplant mortality and/or graft loss.
The frequency of hypertension increased from baseline over the course of the study, but did not differ significantly between treatment arms. Notably, patients with hypertension, defined as SBP ≥140, gained significantly less weight when treated with EVR-containing regimens than in the TAC control arms. This could in part arise due to additional medication and lifestyle modifications aimed at reducing hypertension. The findings here indicate that EVR does not exacerbate hypertension in liver transplant patients.
The increased incidence of hyperlipidemia with EVR-containing regimens observed in this study is a known effect of mTOR inhibitors. However, despite the significantly greater increase in LDL and triglycerides, this did not translate into an increased rate of PTMS among EVR-treated patients. The effect of HDL increase at month 24 may offset some of these LDL and triglyceride findings. This suggests that EVR does not exacerbate PTMS. The reduction in weight gain observed with EVR may in part counter the lipid effects. Despite the rise in cholesterol, no increase in cardiac events was observed with EVR. The first line approach to the treatment of hyperlipidemia is lifestyle change through diet, exercise and weight loss17; in those who have maximized lifestyle intervention, statins are effective in reducing CV risk. Weight gain is more challenging to treat.
Although glycosylated hemoglobin showed a slightly greater increase with EVR-containing regimens in the first year after transplantation, this difference was no longer present at 24 months, potentially due to the use of concomitant glucose-lowering medication. Similarly, to the effects observed with lipids, this transient increase HbA1c does not translate into an increased occurrence of PTMS with EVR. Despite the increase in glycosylated hemoglobin, the rates of diabetes at baseline and after transplantation were similar across the 3 regimens compared. A previous study of diabetes and posttransplant risk found that while diabetes at time of liver transplantation is associated with reduced posttransplant survival, an additive effect was observed for obesity and diabetes.18 Whether the reduction in weight gain with EVR-containing regimens, and the absence of any increase in PTMS, translates into long term benefits will require longer follow-up posttransplantation. The impact of lower weight on allograft steatosis and recurrent NASH cannot be addressed in this study. The rates of NASH as an indication for liver transplantation were low, which may reflect the earlier period for recruitment of the study.
In line with the data previously reported for the RAD001H2304 study,13 the analysis of laboratory measures at 12 and 24 months showed improved kidney function measures with the EVR-containing regimens compared to TAC control. Renal failure rates were also lower in the EVR-containing arms. Since obesity has been linked with chronic renal disease,19 reducing obesity may have even further long-term renal benefits. Patients treated with EVR had higher mean CPK values than controls, which may be attributable to muscle-specific inactivation of mTOR leading to dystrophic effects, as demonstrated in mice.20 Mean values remained with normal ranges, however.
Many of the study subjects met the criteria for PTMS at baseline. Of those patients with newly occurring PTMS, there were no significant differences between treatment arms in rates of occurrence. Overall, there were no differences in rates of CV adverse events between treatment arms.
There are several limitations to the current analysis. First, this is a post hoc assessment of weight gain and other parameters. The impact of the attenuated weight gain observed in participants who received EVR is uncertain. In the nontransplant setting, weight gain is strongly correlated with the frequency and severity of components of the metabolic syndrome. The impact of weight gain after liver transplantation, however, has not been well defined. It is also possible that the duration of study follow-up in our analysis (2 years), while long for clinical trials in transplantation, may have been too short to observe any impact on medical consequences of obesity, which can take years to manifest. The open-label design of RAD001H2304 was necessitated by the requirement for careful adjustment of EVR and TAC exposure, but represents a further limitation. The control regimen—TAC with steroids either continued or withdrawn 6 months post liver transplant—is a standard immunosuppressive regimen, although an addition of mycophenolic acid (to enable lower TAC exposure) has become more common since the protocol was developed. The rates of NASH were low and cryptogenic disease was not separately identified in the analysis. Finally, the study was not powered to detect differences in relatively infrequent 2 year adverse events, such as cardiac events.
EVR with reduced-exposure TAC decreased post liver transplantation weight gain at 1 and 2 years posttransplant in comparison to a standard TAC containing immunosuppression regimen. Longer follow-up is needed to determine the long-term impact of the reduced weight gain on the development of PTMS, CV complications and related outcomes.
Footnotes
M.C., Novartis paid research support to institution, consulting paid to self. D.P. is a Novartis employee. K.MC. is a Novartis employee. J.H., Novartis paid research support to institution. K.W., Novartis paid research support to institution.
The authors declare no conflicts of interest.
M.C. participated in the study concept, data analysis, and article preparation. M.R. participated in the study concept, data analysis, and article preparation. D.P. participated in the study concept and data analysis. K.MC. participated in the data analysis and article preparation. J.H. participated in the study concept, data analysis, article preparation. K.W. participated in the study concept, data analysis, article preparation.
Trial registration: NCT00622869
REFERENCES
- 1.Everhart JE, Lombardero M, Lake JR, et al. Weight change and obesity after liver transplantation: incidence and risk factors. Liver Transpl Surg. 1998;4:285–296. [DOI] [PubMed] [Google Scholar]
- 2.Wissing KM, Pipeleers L. Obesity, metabolic syndrome and diabetes mellitus after renal transplantation: prevention and treatment. Transplant Rev (Orlando). 2014;28:37–46. [DOI] [PubMed] [Google Scholar]
- 3.Asfar S, Metrakos P, Fryer J, et al. An analysis of late deaths after liver transplantation. Transplantation. 1996;61:1377–1381. [DOI] [PubMed] [Google Scholar]
- 4.Lentine KL, Costa SP, Weir MR, et al. Cardiac disease evaluation and management among kidney and liver transplantation candidates: a scientific statement from the American Heart Association and the American College of Cardiology Foundation. Circulation. 2012;126(5):617–663. [DOI] [PubMed] [Google Scholar]
- 5.Watt KD, Pedersen RA, Kremers WK, et al. Evolution of causes and risk factors for mortality post-liver transplant: results of the NIDDK long-term follow-up study. Am J Transplant. 2010;10:1420–1427. [DOI] [PMC free article] [PubMed] [Google Scholar]
- 6.Laryea M, Watt KD, Molinari M, et al. Metabolic syndrome in liver transplant recipients: prevalence and association with major vascular events. Liver Transpl. 2007;13:1109–1114. [DOI] [PubMed] [Google Scholar]
- 7.Fussner LA, Heimbach JK, Fan C, et al. Cardiovascular disease after liver transplantation: when, what, and who is at risk. Liver Transpl. 2015;21:889–896. [DOI] [PubMed] [Google Scholar]
- 8.Richards J, Gunson B, Johnson J, et al. Weight gain and obesity after liver transplantation. Transpl Int. 2005;18:461–466. [DOI] [PubMed] [Google Scholar]
- 9.Rovira J, Marcelo Arellano E, Burke JT, et al. Effect of mTOR inhibitor on body weight: from an experimental rat model to human transplant patients. Transpl Int. 2008;21:992–998. [DOI] [PubMed] [Google Scholar]
- 10.Johnson SC, Yanos ME, Bitto A, et al. Dose-dependent effects of mTOR inhibition on weight and mitochondrial disease in mice. Front Genet. 2015;6:247. [DOI] [PMC free article] [PubMed] [Google Scholar]
- 11.Chang GR, Chiu YS, Wu YY, et al. Rapamycin protects against high fat diet-induced obesity in C57BL/6J mice. J Pharmacol Sci. 2009;109:496–503. [DOI] [PubMed] [Google Scholar]
- 12.Holdaas H, Potena L, Saliba F. mTOR inhibitors and dyslipidemia in transplant recipients: a cause for concern? Transplant Rev (Orlando). 2015;29:93–102. [DOI] [PubMed] [Google Scholar]
- 13.Saliba F, De Simone P, Nevens F, et al. Renal function at two years in liver transplant patients receiving everolimus: results of a randomized, multicenter study. Am J Transplant. 2013;13:1734–1745. [DOI] [PubMed] [Google Scholar]
- 14.De Simone P, Beckebaum S, Koneru B, et al. Everolimus with reduced tacrolimus in liver transplantation. Am J Transplant. 2013;13:1373–1374. [DOI] [PubMed] [Google Scholar]
- 15.Principles of Pharmacology: The Pathophysiologic Basis of Drug Therapy. Golan DE, editor: : Lippincott Williams & Wilkins; 2008. [Google Scholar]
- 16.Cutler C, Stevenson K, Kim HT, et al. Sirolimus is associated with veno-occlusive disease of the liver after myeloablative allogeneic stem cell transplantation. Blood. 2008;112:4425–4431. [DOI] [PMC free article] [PubMed] [Google Scholar]
- 17.Stone NJ, Robinson JG, Lichtenstein AH, et al. Treatment of blood cholesterol to reduce atherosclerotic cardiovascular disease risk in adults: synopsis of the 2013 American College of Cardiology/American Heart Association cholesterol guideline. Ann Intern Med. 2014;160:339–343. [DOI] [PubMed] [Google Scholar]
- 18.Adams LA, Arauz O, Angus PW, et al. Additive impact of pre-liver transplant metabolic factors on survival post-liver transplant. J Gastroenterol Hepatol. 2016;31:1016–1024. [DOI] [PubMed] [Google Scholar]
- 19.Wang Y, Chen X, Song Y, et al. Association between obesity and kidney disease: a systematic review and meta-analysis. Kidney Int. 2008;73:19–33. [DOI] [PubMed] [Google Scholar]
- 20.Risson V, Mazelin L, Roceri M, et al. Muscle inactivation of mTOR causes metabolic and dystrophin defects leading to severe myopathy. J Cell Biol. 2009;187:859–874. [DOI] [PMC free article] [PubMed] [Google Scholar]


