


Abstract
The contraction and spreading of nonmuscle cells are important phenomena in a number of cellular processes such as differentiation, morphogenesis, and tissue growth. Recent experimental work has shown that the topology and the mechanical properties of the underlying substrate play a significant role in directing the cell’s response. In this work, we introduce a multiscale model to understand the sensing, activation, and contraction of the actin cytoskeleton of nonmuscle cells based on the idea that acto-myosin cross-bridges display a catch-bond response. After investigating the respective roles of bond catchiness and acto-myosin assembly on the mechano-sensitivity of stress fibers, we present full simulations of cells laying on arrays of micropillars. Model predictions show good qualitative agreements with experimental observation, suggesting that acto-myosin catch bonds are a major mechano-sensing element in nonmuscle cells.
Keywords: catch bond, acto-myosin assembly, finite elements, cell contraction, mechanosensitivity, hierarchical modeling
Graphical abstract
1. INTRODUCTION
In nonmuscle cells, the interactions between actin filaments and myosin motors are important for a variety of processes, including intracellular transport, cytokinesis, and mechano-sensing. The latter mechanism relies on complex cytoskeletal machinery orchestrated by an assembly of contractile elements, known as stress fibers that connect to a substrate via focal adhesions and can span the entire length of a cell.1 Upon “measuring” a substrate’s properties, cells may reorganize their stress fibers in a specific fashion leading to contraction, spreading, and depending on the stemness of the cell, differentiation, each of which depend on mechanical and chemical signaling. Understanding the mechanism by which sensing occurs is therefore critical to characterize how the microenvironment affects cell response.
Nonmuscle cells exhibit several types of stress fibers depending on their function. In particular, stress fibers known as ventral stress fibers are important to the cell’s mechanism of contraction. Ventral stress fibers attach to focal adhesions and enable the application of inward forces between these anchor points.1 A number of experimental studies have investigated contraction and spreading of nonmuscle cells due to the mechanical activity of ventral stress fibers and their dependence on the mechanical properties of their environment. In particular, the design of substrates coated with flexible micropillars2 have allowed quantitative measurements of the contractile force generated by adherent cells as well as their ability to sense stiffness in two-dimensions.3,4 Other studies2,4 have shown that the contractile force increases with the number of adhesion sites and adhesion stability is achieved when an adequate force is applied.5
Theoretical and computational studies have traditionally been built at multiple length scales to understand mechano-sensing and contraction. At the molecular level, contraction is typically described by the sliding filament model in which contraction emerges from the motion of globular myosin II head on the actin filaments mediated by ATP.6,7 Such models have been successful in explaining muscle contraction,8 for example, in the behavior of cardiac cells9 and smooth-muscle cells.10 At the cellular level, models have mostly relied on more empirical approaches11,12 motivated by mechanics-based arguments.13 In this context, macroscopic models were derived to explain the dependence of stress fiber organization on force-sensing14 or to identify the role of adhesion kinetics on stress fiber formation and a cell’s stiffness sensing capabilities.15 Deshpande et al.16,17 further incorporated coupled biochemical and mechanical mechanisms to explain the activation of stress fiber according to the substrate stiffness. The consideration of other important mechanisms such as actin and cytosol transport was captured within the context of mixture theory and poro-mechanics.18–20 The idea of performing experiments virtually provides a route to check the validity of the proposed models and theories. For instance, Soine et al.21 built a framework that incorporates a continuum model for cells based on elasticity and inverse analysis to fit the experimental data on contractile cell. Furthermore, Pathak et al.22 built a structural model that could predict how cells distribute their SFs and how this leads to contractile force at adhesion sites. To our knowledge, the role of acto-myosin assembly on the cell mechano-sensitivity has not been studied using virtual experiment.
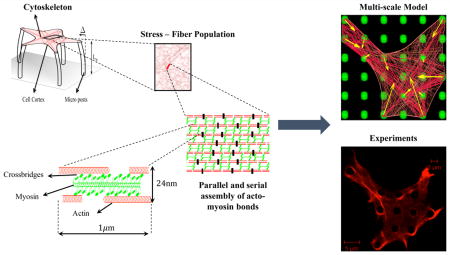
In this work, we developed a multiscale model of the actin cytoskeleton with the goal of understanding, at the molecular scale, the acto-myosin bond as the force sensitive element and its role in driving the overall response at the cellular level. As depicted in Figure 1, we take advantage of the hierarchical organization of the actin cytoskeleton across different length-scales starting from a full cell at equilibrium when seeded onto elastic micropillars. At this scale, the cytoskeleton is described as a random organization of actin stress fibers surrounded by an elastic cortex that can bind to its substrate via focal adhesions. Each stress fiber is then described as a parallel assembly of interconnected actin filaments that can slide past one-another through myosin motors. These dynamics and equilibria are described in terms of a coarse-scale active viscoelastic representation of the sliding filament model. A force sensitive element is finally incorporated at the molecular length-scale by considering the fact that the stability of the acto-myosin bond follows that of a catch-bond, i.e., stability increases with force. The dependence of bond stability on force is shown in various studies. For instance, Veigel et al.23 showed that the bond detachment rate decreases with an increase in the force using optical tweezers on a single cross-bridge. Piazzesi et al.24 further used X-ray interference on single muscle fibers and calculated the dependence of the number of attached bonds on the applied force assuming a sarcomeric order of the fibers. Among these works, our model is motivated by a recent study by Guo25 in which it was found that acto-myosin bonds, when studied ex vivo, increase their lifetime as they are subjected to tensile forces, up to a maximum load reported to be 6 pN. Under the action of active stresses generated within a cell by ATP hydrolysis, our model predicts the activation and contraction of stress fibers in directions that depend on both the geometry of the substrate and its mechanical properties. We compare our multiscale model to the results from experimental measurements performed herein.
Figure 1.

Multiscale model of a contractile cell is based on the mechanics of the acto-myosin bonds at the molecular scale. Alternating assembly of actin and myosin II filaments form the stress fibers, which can exist between any two focal adhesion in the cell.
2. METHODS
We introduce a mechanistic model that captures the mechano-sensitive contraction behavior of a single stress fiber, based on its hierarchical decomposition (Figure 1), and compare it to experimental measurements. Our objective here is to concentrate on the role of the behavior of the acto-myosin bond on cell mechano-sensitivity and to predict the stabilization and contraction of stress fibers in a cell “fixed” on micropillars. As such, we chose not to incorporate the mechanism of stabilization of focal adhesion with force15,26 and the growth and disassembly of stress-fibers with time, both of which rely on actin polymerization and depolymerization. In other words, the current model does not describe the processes of cell migration or spreading.2,3
2.1. Multiscale Model
2.1.1. Active Viscoelastic Model of a Stress Fiber
2.1.1.1. Kinematics of Actomyosin Assembly
A stress fiber is described as a bundle of actin filaments, held together by α-actinin1,6 and cross-linked by myosin II. Myosin II are motor proteins that have the ability to walk on actin filament and trigger sliding between adjacent units; this mechanism is responsible for the overall contraction of the assembly. To characterize the relationship between sliding and overall contraction, we considered a control segment of length1,6 l ≈ 1 µm (Figure 1) and with a 24 nm diameter cross-sectional diameter that comprises myosin filaments with Nx = 10 active motors,27 surrounded by a number Nf = 2 of actin filaments.1,6 In this segment, the sliding of myosin heads on actin produces an effective contraction rate vs that is bound between 0 and the maximum value .5 The total deformation of the control segment depends not only on this sliding contraction but also on its elastic deformation. This compliance arises from the low elastic modulus k = 2pN/nm25 of the acto-myosin bonds. When the assembly is subjected to stress, an acto-myosin bond senses a local force f such that the elastic deformation reads δe = f/k. The total deformation of the segment is thus δ = δs + δe where δs is the inelastic displacement from sliding. Assuming that the myosin and the actin filaments initially overlap perfectly, the available number of acto-myosin connections is N̂= NxNf. However, as the control segment contracts the overlap ratio between actin and myosin filaments drops and so does the number of available actin-myosin junctions.28 For simplicity, we assumed that this number N(δs) decreases linearly with shortening as follows:
| (1) |
where the maximum contraction has been measured to be around 25% in length.29 We note that when the total contraction reaches , the cross-bridges are no longer available (N̂= 0), and contraction comes to a halt. We defined the actual number Na of active cross-bridges as a fraction η of available connections such that Na = ηN̂ (δs).
2.1.1.2. Energy Functional of a Control Segment
To model the response of a control segment, we constructed an energy function ℱ that captures the various entropic, elastic, and dissipative processes occurring at the molecular length-scale in the form:
| (2) |
where 𝒜 is the power generated by ATP hydrolysis, 𝒟 is the rate of energy dissipation, ℰ = U − TΔS is the energy stored in the segment, and the last term is the work rate of external forces F. We selected the absolute temperature T = 310 K.
The stored energy was defined as follows. The entropy of a system made of a large number of bonds that constantly attach and detach due to thermal fluctuations was written in terms of the fraction η of attached units by30
| (3) |
where kB is the Boltzmann constant and 0 ≤ η ≤ 1. The stored elastic energy then comprised two contributions, the adhesive energy stored in attached bonds and the deformational energy stored in the ηN attached cross-bridges:
| (4) |
Guo et al.25 have shown that the stability of an acto-myosin bond increases with the applied force up to a certain level before it eventually decreases. This stability has been characterized in terms of the increasing energy barrier ΔEb (see Figure 3 a) with the applied force. We have shown7 that this “catch bond” behavior can be represented by a modification of Bell’s law as31
| (5) |
where J is the reference energy of the bond, f0 = 2.2pN is a scaling force, Δx = 3 nm is the width of the energy barrier,32 and α = 2.4kBT is the catch bond energy or “bond catchiness”. A pictorial description of this equation, together with the associated physical mechanism is given in Figure 3. The total Gibbs energy of the control segment was defined by
| (6) |
Viscous dissipation was determined as follows. Modeling cross-bridges as entities that slide on actin filaments with velocity vs and viscosity coefficient μ,33 the Rayleigh dissipative functional was expressed as
| (7) |
Active power generation was determined as follows. Power input is given to the system by ATP hydrolysis, creating the driving force ζ for myosin motion. Since only active cross-bridges contribute to this process, the active power was expressed in terms of η as
| (8) |
Figure 3.

(a) Energy barrier of a catch bond increases with the applied force. (b) Bond strength increases with the bond energy which extends the bond lifetime.25 This can be interpreted as high activation η of the bonds.
2.1.1.3. Governing Equations of Stress Fiber
As is shown in Figure 1, a stress fiber was built from a parallel and serial assembly of control segments. On the one hand, the assembly in series determines the length of a stress fiber and its true deformation arising from sliding filaments, , and the elastic deformation of cross-bridges, , where n1 is the number of control segments in series. The end-to-end contraction rate was then computed as . On the other hand, the number n2 of control segments within the fiber cross-section (in parallel) determines its load carrying capacity characterized by the number of cross-bridges through the thickness. On the basis of this assembly, the total energy of a stress fiber was defined by
| (9) |
Note that it is implicitly assumed that control segments display the same behavior within a single stress fiber, and thus, the variables δs, δe, N̂(δs), vs, and η are uniform in this region. The final governing equations were derived by ensuring that active, dissipative, and elastic forces are balanced. This final step was confirmed when the functional ℱSF is minimized,7 i.e.,
| (10) |
where the subscripts are used to denote differential operators. Assuming that the variables η̇, δ̇e, and vs are independent of each other, the three terms in eq 10 must be minimized separately, which leads three Euler–Lagrange equations. The first term in eq 10 is the force equilibrium:
| (11) |
One can deduce from this equation that if the stress fiber is subjected to a tensile force Fe, then each cross-bridge supports the tension f = Fe/(ηN(Δds)). The second term leads to the equilibrium of the chemical potential of the acto-myosin bond
| (12) |
and finally, the last term leads to the dissipation equation:
| (13) |
From this, it was deduced that the sliding velocity can be expressed in terms of the force f acting on each cross-bridge as where . Thus, ζ = 5pN was reinterpreted as the stalling force, i.e., the force at which the contraction velocity vanishes. Although the above model possesses several parameters, most have been taken from the literature including the number of filaments (Nx and Nf), filament elasticity, and sliding velocity. However, those parameters related to the catch bond model were derived by matching the critical force to the results reported by Guo et al. (see Figure 2 b). The bond catchiness α was then evaluated to match the maximum observed fraction of acto-myosin cross-bridges ηmax = 5%.27 The determined value αmax = 2.4kBT then served as a reference to investigate the role of bond catchiness.
Figure 2.

Mechanics of an actin-myosin pair is captured via three elements; (i) an elastic element, (ii) a contracting element, and (iii) a bond element.
2.1.2. From Stress Fiber Mechanics to Cytoskeleton
To understand how the response of a single stress fiber scales to the full cell dimension (5–50 µm), we built a structural representation of the actin cytoskeleton, in which stress-fibers interact with other cytoskeletal elements and the underlying substrate. Our simplified description relies on three key elements (Figure 3): (i) the acto-myosin cytoskeleton, made of randomly distributed stress-fibers of constant thickness, (ii) the actin cortex, modeled here as a passive elastic layer at the cell periphery, and (iii) regions of focal adhesions that provide anchoring points among the substrate, the cortex, and stress-fibers.
The actin cytoskeleton was modeled as follows. We assumed ventral stress fibers since they are the stress fibers that anchor at adhesion points including the actin cortex, which allows them to drive cell contraction. Ventral stress fibers do not interact with each other directly (i.e., they do not form a network) and usually reside in a plane at the bottom of the cell.6 We therefore simplified the acto-myosin cytoskeleton as a two-dimensional assembly of noninteracting ventral stress fibers that are randomly oriented in space and attached on their two ends to either a focal adhesions or the actin cortex. Defining an a-priori stress fiber distribution is a difficult task since this quantity usually evolves as the cell contracts and changes geometry. However, assuming that no forces are applied to a cell in its initial state, it was reasonable to assume that this network is isotropic (i.e., independent of any loading direction). The second challenge consists of defining an initial stress fiber density: the number of stress fibers per unit area. This issue was resolved by realizing that this density is directly proportional to the available anchoring sites either on adhesion complexes or on the actin cortex. For the examples investigated in this work, we estimated 7 anchoring sites per µm on the cortex and 7 sites per µm2 on focal adhesion complexes.2,4,15 We finally needed to prescribe a distribution regarding stress fiber length. On the basis of the arguments that short stress fibers tend to have longer life span than longer ones,34 one should expect a higher probability of finding the former in the network. This assumption was represented by an exponential probability distribution function (PDF) ϕ(l) as
| (14) |
where l is the length of the stress fiber in micrometers, and λ = 0.2 is the rate parameter (Figure 4). From a more practical viewpoint, the stress fiber network was constructed as follows. The growth of a stress fiber from an anchoring site in a certain direction which makes an angle θ with the horizontal axis was considered. The length of the stress fiber in this direction was then chosen randomly according to the distribution ϕ. For an isotropic distribution, we constructed an empirical relationship l(θ) for each adhesion sites. In order to keep initial isotropy, we randomly selected the growth direction θ for a stress fiber starting from an adhesion site using the PDF ϕ(l(θ)) = ϕ(θ).
Figure 4.

Cytoskeleton is modeled as isotropic distribution of stress fibers whose lengths follow the probability distribution function (PDF) ϕ(l). Other cytoskeletal elements include the focal adhesion complex, modeled here as strong adhesion regions on top of micropillars and the actin cortex, described as a deformable layer with bending and stretch elasticity. In the proposed model, stress fibers are allowed to anchor either at focal adhesion regions or in the actin cortex.
Substrate adhesion was modeled as follows. We considered cells that interact with a substrate made of micron-sized pillars as described in experimental studies.2–4 Since the pillar tops are coated with adhesion proteins, it was assumed that stress fibers strongly anchor to these sites at their extremities, which leads to an overall pillar deflection. This deflection was determined by two parameters: the pillar’s elastic modulus Ep and its geometrical properties by2
| (15) |
where K is the flexural rigidity, L is the height, Ip is the moment of inertia, and Δ is the deflection for each pillar.
The actin cortex was modeled as follows. The actin cortex is an important structural element that regulates the deformation and bending of the membrane. Its elastic response was characterized by two deformation modes: stretch and bending. For simplicity, we used a small deformation, a linearly elastic Euler–Bernoulli beam model with elastic modulus Ec = 20 kPa,35,36 for which the stored elastic energy ℒ per unit length depends on the axial and the transverse deformation as follows:37
| (16) |
Here, Ac and Ic are the cross-sectional area and moment of inertia of the cortex, while u and v are its axial and transverse displacement, respectively. The distributed transverse load q(x, t) and axial load p(x, t) further arise from the contraction of stress fiber attached to the cortex.7 The flexural stiffness EcIc was chosen to be 1.42 × 10⁻⁹dyn·cm, consistent with experimental observations.35,36
2.1.3. Overall Model and Numerical Implementations
The cell contraction is governed by three equations; balance of forces and moments (11), the chemical equilibrium of acto-myosin bonds (12) and the dissipation due to the contraction (13). The total contraction of a stress fiber reads ‖d2 − d1‖ = Δds(t) + Δde and was calculated from the displacements of its two ends d1 and d2. The total work rate of the cell is composed of three components: work rate of stress fibers (ℱSF), cortex (ĖC), and the microposts (ĖA),
| (17) |
where m1 and m2 are the total number of stress fibers in the cell and the number of attached pillars, respectively. The first term represents the contribution of each of the m1 stress fibers comprising the cytoskeleton. The elastic energy stored in the m2 micropost as they bend reads
| (18) |
where is the total deflection of the nth micropost. This deflection is computed as with , being the x and y components of the displacement vector on the top of the post. Finally, the third term in eq 17 is the integration of the internal energy of the cortex over the boundary Γ. This energy originates from both axial deformation and bending. Thus, we assumed that these modes of deformation are uncoupled and therefore is defined as
| (19) |
where d‖ = dc·(1 − n) and d⊥ = dc·n are the axial and transverse components of the cortex deformation, and n is the unit normal of the corresponding cortex segment with a length Lc.
Finally, as we assume that stress fibers are anchored either on the micropost or in the cortex, their motion is entirely determined by the deformation of these two elements. Therefore, deformation in the cell was written entirely in terms of the cortex displacement d = dc and pillar displacement d = dp. The unknowns of the system are therefore the displacements d, the cortex rotation θc = ∂d⊥/∂x‖, and the stress fiber activation η. In terms of these unknowns, the force balance equation becomes
| (20) |
complemented by the two equations 12 and 13. A numerical solution of the above equations was derived using the finite element (FE) method. In particular, the stress fibers and the adhesion sites were modeled with standard one-dimensional structural elements, whereas the cell cortex was implemented using frame elements, accounting for bending.38 The equilibrium solution was then found using Newton–Raphson iterative solution method, and the detailed description of the procedure can be found in ref 7.
2.2. Experimental Methods
Polydimethylsiloxane (PDMS) substrates containing microposts were fabricated using a single step photolithography process. The microposts were imaged by scanning electron microscopy. The diameter of the microposts was confirmed to be 2 µm, and the spacing was confirmed to be 5 µm. A solution of fluorescently labeled fibronectin in phosphate buffered saline (PBS) was spin coated onto a glass slide. The PDMS micropost substrate was carefully stamped onto the glass slide to coat the tops of the microposts. The PDMS substrate was subsequently treated with a 0.1% Plutonic F127 in PBS for 1 h and then rinsed. Confocal microscopy was used to confirm that fibronectin was localized to the tops of the microposts. Adherent C2C12 cells (ATCC) were seeded on top of the microposts and cultured in Dulbecco’s modified Eagle’s medium supplemented with 10% fetal bovine serum for 1 day. The cells were fixed, permeabilized, stained with rhodamine phalloidin, and imaged by confocal microscopy.
3. RESULTS AND DISCUSSION
The multiscale model was implemented to explore some of the characteristic predictions regarding the acto-myosin assembly both at the level of a single stress fiber and at the full cellular scale. These results are discussed in light of experimental measurements and observations from our group.
3.1. Contraction of an Acto-myosin Unit: A Single Stress Fiber between Two Microposts
We first investigated model predictions based on the stiffness sensing capabilities of a single stress fiber. For this, we used a standard nonlinear solver, based on the Newton–Raphson method to derive solution of the coupled governing equations 11, 12, and 13. A number of studies2,4,20 have shown that nonmuscle cells can sense the stiffness of the environment and adapt their level of contraction through the active acto-myosin cross-bridges. In the rest of this work, we use the term “stress fiber activation” to describe the number of active bonds (ηN(Δds)), which is the quantity that characterizes the level of SF formation in our modeling approach. Further, in this context, the term “active crossbridge” refers to an actin–myosin junction with an established bond, which resists an applied force. Here, we asked whether this observation can be explained by catch bond behavior in the acto-myosin bond. We considered a virtual experiment in which a myosin bundle, powered by ATP hydrolysis, walks from right to left along a polarized actin filament. This motion is resisted by an elastic spring of constant K that provides a link between the myosin filaments and a fixed point (Figure 5a). As a myosin filament slides on actin, the elongation δ of the spring increases such that the resisting force on the myosin bundle is F = Kδ. If the acto-myosin bonds are catchy, the number of active cross-bridges increases with the applied force as depicted in Figure 2b. The system reaches steady state depending on when the cumulative active force (N(δs)ηζ) to the myosin heads is balanced with the spring force. For slip bonds, however, the increase in the acto-myosin force resulting from force applied by the spring causes their disassembly and a rapid increase in the force on the remaining bonds. Eventually, we predict that the system quickly reaches an equilibrium state with a low cross-bridge activation η together with a small contractile force and shortening deformation (Figure 2b). Similar results are shown by the work of Albert et al.39 in which the catch bond response was described by a stochastic modeling of the acto-myosin bond lifetime. This formulation predicts trends similar to those of ours regarding force sensing capability of a bundle of myosin, i.e., the sensitivity of the assembly increases significantly when catch bonds are considered.
Figure 5.

(a) Myosin bundle attached to a spring at one end is moving on a fixed actin. The actomyosin catch bonds show more resistance to the force applied by the spring against the motion than the one in the case of the slip bond. Therefore, the resultant contraction is higher for the catch bond. (b) Total contraction δ̂ is a nonlinear function of the spring stiffness. The contractile force increases until it reaches a limit where the maximum number of cross-bridges are active. F̂= fηN(δs)/ζ,δ̂ = δs/ , α* = α/αmax, and K̂ = K/k.
We investigated how the predicted contractile behavior propagates to the level of a single stress fiber. Two main observations are made: first, the dependency of the stiffness-sensitivity on bond catchiness remains unchanged compared to results shown in Figure 5. Second, we predict a length-dependent equilibrium and dynamical behavior of the stress fiber activation and contraction. To illustrate this phenomenon, we imagine a virtual experiment in which a single stress fiber is allowed to contract between two microposts with identical effective bending stiffnesses K (Figure 5a). For the sake of clarity, let us further consider two setups in which two stress fibers with different length, l and 5l, are investigated to compare the relative shortening 2δ/l and activation η levels in time. First of all, for the same pillar deflection, the contractile force produced by both stress fibers is the same. However, the relative shortening in the longer stress fiber is lower than that in the shorter one (2δ/5l < 2δ/l); this implies that the apparent pillar compliance increases stress fiber length. Moreover, a consequence of the end-to-end contraction rate (i.e., ) is that the longer stress fibers tend to activate and shorten faster than their short counterparts (Figure 6b). We will see below that this prediction affects the early stage contraction of the cytoskeleton as longer stress fibers are first to activate and contract.
Figure 6.

Longer stress fibers have higher compliance, and they activate faster than the short ones.
3.2. Contraction of an Acto-myosin Unit: A Stress Fiber Bundle between Two Microposts
We next investigated the effect of stress fiber density on the activation, force sensing, and contraction. We used methods similar to that described for a single stress fiber. Here, our virtual experimental setup is such that the extremities of multiple stress fibers are attached to two microposts. For the sake of illustration, we consider two situations: (i) a single stress fiber, as before, and (ii) four parallel stress fibers between the microposts (Figure 7 a). In Figure 7b, we first show the time evolution of the activation η and the relative shortening 2δp/l of the stress fibers when the micropost bending stiffness is K̂= K/k = 1. Three key observations are made. First, we see that regardless of the number of stress fibers, the fraction of active cross-links η reaches its maximum values assymptotically with time. Second, as expected, the pillar deflection (and thus relative shortening) is larger for four stress fibers than that for one stress fiber. However, the relationship is not linear since four fibers only contract 1.5 times more than a single stress fiber. Third and finally, the activation rate of the single stress fiber is higher than that of four stress fibers. This may be explained as follows: multiple stress fibers share the load, which means that each acto-myosin bond carries less of a load than that in the case of a single fiber (four times less in our case) and thus undergoes a slower activation.
Figure 7.

Parametric study of stress fibers between two microposts. (a) Two cases are selected; (i) a single stress fiber and (ii) four stress fibers between two microposts. (b) Single stress fiber reaches its maximum shortening faster, and it has a higher activation rate. Four stress fibers experience a higher relative shortening. (c) The activation N(δs)η of a stress fiber decreases with an increase in the number of stress fibers in parallel.
To better understand the impact of stress fiber density on stiffness sensing, we then studied in Figure 7c how the maximum activation N(δs)η and shortening varied with pillar stiffness K̂. We see here that regardless of the number of stress fibers, the activation increases and relative shortening decreases with pillar stiffness. Increasing the number of stress fibers, however, results in increasing the pillar deflection and lowering the activation level N(δs)η. Indeed, since multiple fibers undergo a stronger shortening, the total number N(δs) of available cross-links decreases due to filament overlap as described by eq 1. Overall, these simulations suggest that multiple stress fibers can strongly interact when sharing the load. Their contraction and activation response therefore arise from a delicate balance between the local response of single acto-myosin segments and the time evolving force equilibrium between adjacent fibers.
3.3. Contraction of C2C12 Cells on Microposts
In this example, our goal was to predict the stress fiber distribution and contraction in an adherent cell that is adhering to arrays of microposts and compare these results with the experimental observations of adherent C2C12 cells. On the modeling side, we further explored the role of acto-myosin bond catchiness on the contractile force generation, stress fiber distribution, and cell morphology. Experimentally, C2C12 cells were seeded onto PDMS micropost substrates with a diameter of 2 µm spaced 5 µm apart. The tops of the posts were coated with fibronectin to promote cell attachment, while the rest of the substrate was treated with Plutonic F127 to prevent cell attachment. From the modeling side, one of the main challenges is that the initial conditions are often poorly known. For instance, the cell shape and stress fiber distribution prior to contraction must be assumed. Here, in agreement with previous models we assume that no deformation (u = 0) occurs prior to the contraction19,40 and that cells contain no active stress-fibers (η = 0). Since the model does not incorporate the dynamics of focal adhesion attachment/detachment and cell spreading, one can approximate the initial cell’s shape using the images of steady state. Because the cell cortex is in its minimum energy state prior the contraction, its initial shape can be approximated by straight lines between the adhesion sites on the boundary.17 For the cells investigated, we estimated seven anchoring sites per µm on the cortex and seven anchoring sites per µm2 at the focal adhesion sites. The stress fiber densities were selected to match the cortex deformation at steady state. In order to predict the cell deformation and the stress fiber distribution, we modeled the microposts with a stiffness 100 nN/µm and chose the bond catchiness parameter α* = 1.
We considered two cellular geometries shown in Figure 8a for which the adhesion sites were determined based on experimental images. The activation of stress fiber and deformation of the cortex were shown at three characteristic times that represent (I) early activation state, (II) transition state, and (III) near steady state. To illustrate the effect of bond catchiness α, we show the model predictions for α* = 1 (strong catch bond) and α* = 1/2 (moderate catch bond). Overall, our results show that (a) the cell shape starts as a polygon but quickly evolves into a more realistic morphology due to the interactions between stress fiber contraction and cortex elasticity, (b) the stress fibers tend to form, stabilize, and contract in the directions of highest stiffness, (c) the chronology of stress fiber activation is heterogeneous within the cells, (d) the longer stress fibers activate first and tend to activate more than the shorter ones, as discussed earlier, and (e) the strength of the catch bond plays a significant role in these processes. Weak catch bonds result in a weak cell cytoskeleton (poor stress fiber activation) and very little cell and micropost deformation. Strong catch bonds, however, enable prediction of the cell morphology and cytoskeleton that reasonably reproduce the experimental cellular morphologies. We note, however, that experimental data only provide qualitative information do not enable a comparison with predicted contractile forces. This can be achieved in future studies by conducting experiments in which the deflection of pillars can be used to estimate the cellular forces as described in ref 2, for instance.
Figure 8.

Model predictions for C2C12 cells on substrate. (a) The cell images obtained at the steady state and simulation results for time evolution of cell morphology and stress fiber distribution for different bond strength. (b) Numerical investigation shows that the cell’s stiffness sensing originates from the catch bond behavior. (c) Time evolution of the contractile force for different bond strengths α*.
We next explored the effect of micropost stiffness on average contractile force using our virtual experiment. In this context, Figure 8c shows the time evolution of this average force for the two cells under consideration, subjected to a bond catchiness α* = 1 and 1/2, respectively. As expected, a stronger catch bond leads to higher contraction for both cells. We also observed that the contractile force increases with the number of adhesion sites on the cell boundary. Indeed, cell-I (Figure 8a) is attached to 6 microposts, while the cell-II (Figure 8a) is attached to 8 microposts. In Figure 8a, we show how cell contractility is affected by bond catchiness α* and micropost stiffness K. Results correspond to cell-I, and as well, cell-II displays a very similar response. We note here that the average contractile force increases asymptotically with micropost bending stiffness. However, we observed that the force remains the same for the micropost bending stiffness K ≥ 100 nN/µm and reaches its limit asymptotically, which is the case in our experimental system. This prediction can be rationalized by looking at the response of a single stress fiber presented in section 3.1. When α = 0, results are as expected and the average contractile force on the pillars remains relatively small regardless of pillar compliance. This implies that the lack of bond catchiness inhibits mechano-sensing at the cellular scale. We further observe that the average contraction increases nonlinearly (superlinear) with bond catchiness but only displays a sublinear increase with pillar stiffness.
4. CONCLUSIONS
In this work, we presented a multiscale model of the actin-myosin cytoskeleton of adherent cell in order to understand how the molecular mechanisms behind contraction and force-sensing can propagate to the cellular scale. In this model, the cytoskeleton is viewed as a quasi-random distribution of stress fibers that possess a hierarchical organization of actin filaments and myosin bundles. Contraction is then possible through the sliding of the filament under the action of acto-myosin cross-bridges. Our analysis shows that the mechano-sensitivity of a stress fiber can be explained by the fact that cross-bridges possess a catch bond response, i.e., they stabilize under loading. The model was used to predict the evolution of the cytoskeleton organization and contraction force of skeletal muscle cells on arrays of microposts. Generally, we show that if the acto-myosin is mechano-sensitive, i.e., it displays a strong catch bond response, model predictions are in good agreement in terms of the cell morphology and stress fiber distribution. However, quantitative comparison with the experimental data for these types of cells is left for future studies.
Acknowledgments
Research reported in this publication was partially supported by the National Institute of Arthritis and Musculoskeletal and Skin Diseases of the National Institutes of Health under Award Number 1R01AR065441. F.J.V. acknowledges the support of the National Science Foundation under the CAREER award 1350090.
Footnotes
The content is solely the responsibility of the authors and does not necessarily represent the official views of the National Institutes of Health.
The authors declare no competing financial interest.
References
- 1.Tojkander S, Gateva G, Lappalainen P. Actin stress fibers - assembly, dynamics and biological roles. J. Cell Sci. 2012;125:1855–1864. doi: 10.1242/jcs.098087. [DOI] [PubMed] [Google Scholar]
- 2.Tan JL, Tien J, Pirone DM, Gray DS, Bhadriraju K, Chen CS. Cells lying on a bed of microneedles: An approach to isolate mechanical force. Proc. Natl. Acad. Sci. U. S. A. 2003;100:1484–1489. doi: 10.1073/pnas.0235407100. [DOI] [PMC free article] [PubMed] [Google Scholar]
- 3.Ghibaudo M, Saez A, Trichet L, Xayaphoummine A, Browaeys J, Silberzan P, Buguin A, Ladoux B. Traction forces and rigidity sensing regulate cell functions. Soft Matter. 2008;4:1836–1843. [Google Scholar]
- 4.Trichet L, Le Digabel J, Hawkins RJ, Vedula SRK, Gupta M, Ribrault C, Hersen P, Voituriez R, Ladoux B. Evidence of a large-scale mechanosensing mechanism for cellular adaptation to substrate stiffness. Proc. Natl. Acad. Sci. U. S. A. 2012;109:6933–6938. doi: 10.1073/pnas.1117810109. [DOI] [PMC free article] [PubMed] [Google Scholar]
- 5.Schwarz US, Safran SA. Physics of adherent cells. Rev. Mod. Phys. 2013;85:1327. [Google Scholar]
- 6.Pellegrin S, Mellor H. Actin stress fibres. J. Cell Sci. 2007;120:3491–3499. doi: 10.1242/jcs.018473. [DOI] [PubMed] [Google Scholar]
- 7.Vernerey FJ, Akalp U. Role of catch bonds in actomyosin mechanics and cell mechanosensitivity. Phys. Rev. E: Stat. Phys., Plasmas, Fluids, Relat. Interdiscip. Top. 2016;94:012403. doi: 10.1103/PhysRevE.94.012403. [DOI] [PMC free article] [PubMed] [Google Scholar]
- 8.Huxley AF. Muscle structure and theories of contraction. Prog. Biophys. Biophys. Chem. 1957;7:255–318. [PubMed] [Google Scholar]
- 9.Chapelle D, Clement F, Genot F, Tallec PL, Sorine M, Urquiza JM. In: Functional Imaging and Modeling of the Heart. Katila T, Nenonen J, Magnin IE, Clarysse P, Montagnat J, editors. Vol. 2230 Springer; Berlin, Germany: 2001. [Google Scholar]
- 10.Brook B, Jensen OE. The role of contractile unit reorganization in force generation in airway smooth muscle. Mathematical Medicine and Biology. 2014;31:99–124. doi: 10.1093/imammb/dqs031. [DOI] [PMC free article] [PubMed] [Google Scholar]
- 11.Bischofs IB, Schwarz US. Cell organization in soft media due to active mechanosensing. Proc. Natl. Acad. Sci. U. S. A. 2003;100:9274–9279. doi: 10.1073/pnas.1233544100. [DOI] [PMC free article] [PubMed] [Google Scholar]
- 12.Nelson CM, Jean RP, Tan JL, Liu WF, Sniadecki NJ, Spector AA, Chen CS. Emergent patterns of growth controlled by multicellular form and mechanics. Proc. Natl. Acad. Sci. U. S. A. 2005;102:11594–11599. doi: 10.1073/pnas.0502575102. [DOI] [PMC free article] [PubMed] [Google Scholar]
- 13.Mohrdieck C, Wanner A, Roos W, Roth A, Sackmann E, Spatz JP, Arzt E. A theoretical description of elastic pillar substrates in biophysical experiments. ChemPhysChem. 2005;6:1492–498. doi: 10.1002/cphc.200500109. [DOI] [PubMed] [Google Scholar]
- 14.Foucard L, Vernerey FJ. A themodynamical model for stres-fiber organization in contractile cells. Appl. Phys. Lett. 2012;100:1–4. doi: 10.1063/1.3673551. [DOI] [PMC free article] [PubMed] [Google Scholar]
- 15.Walcott S, Sun SX. A mechanical model of actin stress fiber formation and substrate elasticity sensing in adherent cells. Proc. Natl. Acad. Sci. U. S. A. 2010;107:7757–7762. doi: 10.1073/pnas.0912739107. [DOI] [PMC free article] [PubMed] [Google Scholar]
- 16.Deshpande VS, McMeeking RM, Evans AG. A model for the contractility of the cytoskeleton including the effects of stress-fibre formation and dissociation. Proc. R. Soc. London, Ser. A. 2007;463:787–815. [Google Scholar]
- 17.McGarry JP, Evans AG, McMeeking RM, Deshpande VS. Modeling the Active Contractility of Cells under Dynamic Loading; Proceedings of the AME 2009 Summer Bioengineering Conference; June 17–21, 2009; New York, NY: American Society of Mechanical Engineers (ASME); 2009. [Google Scholar]
- 18.Vernerey FJ, Farsad M. A constrained mixture approach to mechano-sensing and force generation in contractile cells. Journal of the mechanical behavior of biomedical materials. 2011;4:1683–99. doi: 10.1016/j.jmbbm.2011.05.022. [DOI] [PubMed] [Google Scholar]
- 19.Vernerey FJ, Farsad M. A mathematical model of the coupled mechanisms of cell adhesion, contraction and spreading. Journal of Mathematical Biology. 2014;68:989–1022. doi: 10.1007/s00285-013-0656-8. [DOI] [PMC free article] [PubMed] [Google Scholar]
- 20.McGarry JP, Fu J, Yang MT, Chen CS, McMeeking RM, Evans AG, Deshpande VS. Simulation of the contractile response of cells on an array of micro-posts. Philos. Trans. R. Soc., A. 2009;367:3477–3497. doi: 10.1098/rsta.2009.0097. [DOI] [PMC free article] [PubMed] [Google Scholar]
- 21.Soine JR, Brand CA, Stricker J, Oakes PW, Gardel ML, Schwarz US. Model-based Traction Force Microscopy Reveals Differential Tension in Cellular Actin Bundles. PLoS Comput. Biol. 2015;11:e1004076. doi: 10.1371/journal.pcbi.1004076. [DOI] [PMC free article] [PubMed] [Google Scholar]
- 22.Pathak A, Chen CS, Evans AG, McMeeking RM. Structural Mechanics Based Model for the Force-Bearing Elements Within the Cytoskeleton of a Cell Adhered on a Bed of Posts. J. Appl. Mech. 2012;79:061020. [Google Scholar]
- 23.Veigel C, Molloy JE, Schmitz S, Kendrick-Jones J. Load-dependent kinetics of force production by smooth muscle myosin measured with optical tweezers. Nat. Cell Biol. 2003;5:980–986. doi: 10.1038/ncb1060. [DOI] [PubMed] [Google Scholar]
- 24.Piazzesi G, Reconditi M, Linari M, Lucii L, Bianco P, Brunello E, Decostre V, Stewart A, Gore DB, Irving TC, Irving M, Lombardi V. Skeletal Muscle Performance Determined by Modulation of Number of Myosin Motors Rather Than Motor Force or Stroke Size. Cell. 2007;131:784–795. doi: 10.1016/j.cell.2007.09.045. [DOI] [PubMed] [Google Scholar]
- 25.Guo B, Guilford WH. Mechanics of actomyosin bonds in different nucleotide states are tuned to muscle contraction. Proc. Natl. Acad. Sci. U. S. A. 2006;103:9844–9849. doi: 10.1073/pnas.0601255103. [DOI] [PMC free article] [PubMed] [Google Scholar]
- 26.Nicolas A, Geiger B, Safran SA. Cell mechanosensitivity controls the anisotropy of focal adhesions. Proc. Natl. Acad. Sci. U. S. A. 2004;101:12520–12525. doi: 10.1073/pnas.0403539101. [DOI] [PMC free article] [PubMed] [Google Scholar]
- 27.Kaunas R, Hsu H, Deguchi S. Sarcomeric model of stretch-induced stress fiber reorganization. Cell Health Cytoskeleton. 2011;3:13–22. [Google Scholar]
- 28.Gordon AM, Huxley AF, Jullian FJ. The variation in isometric tension with sarcomere length in vertebrate muscle fibres. J. Physiol. 1966;184:170–192. doi: 10.1113/jphysiol.1966.sp007909. [DOI] [PMC free article] [PubMed] [Google Scholar]
- 29.Kreis TE, Birchmeier W. Stress fiber sarcomeres of fibroblasts are contractile. Cell. 1980;22:555. doi: 10.1016/0092-8674(80)90365-7. [DOI] [PubMed] [Google Scholar]
- 30.Flory PJ. Principles of Polymer Chemistry. Cornell University Press; Ithaca, New York: 1953. [Google Scholar]
- 31.Pereverzev Y, Prezhdo O. Force-induced deformations and stability of biological bonds. Phys. Rev. E. 2006;73:050902. doi: 10.1103/PhysRevE.73.050902. [DOI] [PubMed] [Google Scholar]
- 32.Evans E. Probing the relation between force - lifetime - and chemistry in single molecular bonds. Annu. Rev. Biophys. Biomol. Struct. 2001;30:105–128. doi: 10.1146/annurev.biophys.30.1.105. [DOI] [PubMed] [Google Scholar]
- 33.Chaen S, Inoque J, Sugi H. The force-velocity relationship of the ATP-dependent actin-myosin sliding cytoplasmic streaming in algal cells, studied using a centrifuge microscope. J. Exp. Biol. 1995;198:1021–1027. doi: 10.1242/jeb.198.4.1021. [DOI] [PubMed] [Google Scholar]
- 34.Thery M, Pepin A, Dressaire E, Chen Y, Bornens M. Cell Distribution of Stress Fibres in Reponse to the Geometry of the Adhesive Environment. Cell Motil. Cytoskeleton. 2006;63:341–355. doi: 10.1002/cm.20126. [DOI] [PubMed] [Google Scholar]
- 35.Dailey H, Ricles LM, Yalcin HC, Ghadiali SN. Image-based finite element modeling of alveolar epithelial cell injury during airway reopening. J. Appl. Physiol. 2008;106:221–232. doi: 10.1152/japplphysiol.90688.2008. [DOI] [PubMed] [Google Scholar]
- 36.Vargas-Pinto R, Gong H, Vahabikashi A, Johnson M. The effect of the endothelial cell cortex on atomic force microscopy measurements. Biophys. J. 2013;105:300–309. doi: 10.1016/j.bpj.2013.05.034. [DOI] [PMC free article] [PubMed] [Google Scholar]
- 37.Timoshenko S, Goodier JN. Theory of Elasticity. McGraw Hill Book Company; New York: 1951. [Google Scholar]
- 38.Kwon YW, Bang H. The Finite Element Method Using MATLAB. CRC Press; Boca Raton, FL: 2000. [Google Scholar]
- 39.Albert PJ, Erdmann T, Schwarz US. Stochastic dynamics and mechanosensitivity of myosin II minifilaments. New. J. Phys. 2014;16:093019. [Google Scholar]
- 40.Dowling EP, Ronan W, Ofek G, Deshpande VS, McMeeking RM, Athanasiou KA, McGarry JP. The effect of remodelling and contractility of the actin cytoskeleton on the shear resistance of single cells: a computational and experimental investigation. J. R. Soc., Interface. 2012;9:3469–3479. doi: 10.1098/rsif.2012.0428. [DOI] [PMC free article] [PubMed] [Google Scholar]