Abstract
Background:
The aim of this study was to evaluate the prognostic implication of asphericity (ASP); spatial irregularity; of pretherapeutic 18F 2-deoxy-2-fluoro-D-glucose (18F FDG) tumor uptake in patients with invasive ductal carcinoma (IDC) of the breast.
Methods:
One hundred thirty-one female IDC patients (mean age = 48.1 ± 10.4 years), with pathological tumor size greater than 2 cm were retrospectively evaluated using 18F FDG positron emission tomography/computed tomography (PET/CT). ASP of 18F FDG distribution was calculated on the basis of the deviation of the tumor shape from spherical symmetry. Progression-free survival (PFS) was predicted on the basis of the univariate and multivariate analyses of the measured clinicopathologic factors and metabolic PET parameters [maximum standardized uptake value (SUVmax), metabolic tumor volume (MTV), and total lesion glycolysis (TLG)].
Results:
The PFS rate among the 131 patients was 90.1%. The mean follow-up time was 50 months for the entire study cohort and 26 months for the patients with recurrent disease. It is evident from the univariate analysis that N stage, hormonal receptor (Estrogen, ER/Progesterone, PR) status, MTV (≤4.2 mL), and ASP (≤15.1%) affected the PFS. Hazard ratios (HRs) estimated from the multivariate Cox regression analysis show that N stage (HR = 17.6), ASP (HR = 11.9), and hormonal receptor status (HR = 6.9) were independent prognostic factors in predicting PFS. In the subgroup of patients with lymph node metastasis, ASP (HR = 10.9) and hormonal receptor status (HR = 9.1) were independent prognostic factors for PFS.
Conclusion:
ASP of 18F FDG uptake is an independent predictor of outcome in IDC patients, and can be used for prognostic stratification.
Keywords: 18F FDG-PET/CT, asphericity, breast cancer, Heterogeneity, invasive ductal carcinoma, prognosis
1. Introduction
In 2013, breast cancer was the cancer with the highest incidence for women in 161 countries and the most common cause for cancer-related deaths in women in 98 countries.[1] Although it is curable when detected early, about one-third of women with breast cancer eventually die of the disease. Breast cancer is a remarkably heterogeneous disease. Therefore, precise prediction of prognosis and selection of optimal treatment are important.[2] Tumor burden, represented by tumor size and the number of lymph nodes (LNs) involved, is the most important prognostic factor for breast cancer recurrence, as advanced-stage tumors are more likely to have distant metastases.[3–5]
18F 2-deoxy-2-fluoro-D-glucose (18F FDG) positron emission tomography (PET) is a useful tool in predicting tumor response or resistance to a specific treatment. 18F FDG-PET images reflect the in vivo tumor biology. In addition to the clinical and structural information, PET images provide information about the metabolic characteristics of the tumor.[6–8] The prognostic value of 18F FDG uptake by the primary tumor in patients with invasive ductal breast cancer (IDC) has been investigated in previous studies.[9–14] It is evident from these studies that there exists a relationship between the PET scan derived metabolic parameters, such as the maximum standardized uptake value (SUVmax), metabolic tumor volume (MTV) and total lesion glycolysis (TLG) of primary tumors, and known prognostic parameters of breast cancer. These metabolic parameters can therefore serve as good surrogate markers for the prediction of disease progression in patients with IDC.[9–14]
There is increasing recognition that the heterogeneity of pretherapeutic 18F FDG uptake in the primary tumor can provide predictive information in several solid tumors. Therefore, quantifying the heterogeneity of 18F FDG uptake appears to be a promising factor in predicting therapeutic outcome, as it might reflect the biological variability causing this intratumoral heterogeneity.[15,16] Results from previous pretherapeutic 18F FDG-PET studies, characterizing heterogeneity of uptake in different carcinomas based on textural features in the images and predicting treatment outcome based on this heterogeneity, have been encouraging.[17–19]
The prognostic value of asphericity (ASP), a parameter quantifying the spatial irregularity of 18F-FDG uptake in tumors, in predicting tumor progression and treatment outcomes in patients with primary head and neck cancer[20,21] and nonsmall cell lung cancer[22] has been previously reported.
The aim of this study was to evaluate the independent prognostic value of ASP, calculated from pretherapeutic 18F-FDG uptake in tumors, in predicting progression-free survival (PFS) in patients with IDC and to compare it with the PFS estimated from conventional quantitative PET parameters, such as SUVmax, MTV, and TLG as well as relevant clinicopathologic factors.
2. Materials and methods
2.1. Patients
From a pool of 661 patients, who underwent 18F FDG PET/computed tomography (PET/CT) scanning between January 2008 and December 2010 to determine the clinical stage of primary IDC before initial treatment, 131 women (mean age, 48.1 ± 10.4 years; range, 39–79 years) were included in this study. The inclusion criteria were as follows: primary tumor size ≥2 cm[23,24]; available medical information and pathologic reports; no excisional biopsy before the PET/CT scanning; and no distant metastasis at the time of initial diagnosis.
Depending on the tumor size, location, multicentricity, and patient preference, all patients were surgically treated with either breast conserving surgery or modified radical mastectomy with sentinel LN biopsy or axillary LN dissection, following the pretherapeutic PET/CT scanning. Patients received a preoperative or postoperative taxane-based systemic chemotherapy regimen, comprising doxorubicin (Adriamycin; Pharmacia) and cyclophosphamide followed by docetaxel. Radiotherapy was given after surgery, and hormonal therapy was given to patients with hormonal receptor positive breast cancer. Patients with human epidermal growth factor receptor 2 (HER2) positive breast cancers were postoperatively treated with trastuzumab (Herceptin; Genentech) for 1 year. The need for adjuvant target therapy was determined by hormone receptor status and menopausal status. Patients were monitored every 3 months for the first 2 years and every 6 months thereafter for 5 years. During this follow-up period, breast sonography, magnetic resonance imaging (MRI), CT, bone scintigraphy, and 18F FDG-PET/CT were used for diagnosing disease recurrence, metastasis, and cancer progression. All suggestive lesions were confirmed histologically or the patients underwent a follow-up within 6 months.
Tumors were classified and staged according to the World Health Organization classification and the TNM staging system. In patients receiving neo-adjuvant chemotherapy, pathologic T and N staging may be influenced by systemic therapy before surgical procedures; thus, for these patients, we used the pretreatment clinical staging system. The study protocol had been approved by the Ethics Committee of the Kyungpook National University Hospital (KNUH 2015–05–013). No informed consent was needed because of the retrospective design of the study.
2.2. 18F FDG-PET/CT imaging
After fasting for at least 6 hours, patient blood glucose levels were checked before the administration of 18F FDG. Patients with elevated blood glucose levels had their examinations rescheduled. None of the patients had blood glucose levels exceeding 150 mg/dL at the time of the scan. 18F FDG was injected intravenously (4.8 MBq/kg of body weight) and the scans were performed 1 hour after the injection. 18F FDG-PET/CT scans were performed using a Reveal RT-HiREZ 6-slice CT apparatus (Reveal RT-HiREZ; CTI Molecular Imaging, Knoxville, TN) and a 16-slice CT Discovery standard test equipment (STE) apparatus (Discovery STE; GE Healthcare, Milwaukee, WI). For attenuation correction, a low-dose CT scan without contrast enhancement with the patient supine and breathing quietly, from the base of skull to the upper thigh was obtained before the PET scan. PET scans with a maximum spatial resolution of 6.5 mm (Reveal PET/CT) and 5.5 mm (Discovery PET/CT) were also obtained from the base of skull to the upper thigh for a period of 3 minutes per bed position. PET images obtained using the Reveal PET/CT and Discovery PET/CT scanners were reconstructed using an ordered subsets expectation maximization algorithm (4 iterations, 8 subsets). Image reconstruction was carried out using a 128 × 128 matrix, a Gaussian filter of 5.0 mm, and a slice thickness of either 3.0 mm (Reveal PET/CT) or 3.27 mm (Discovery PET/CT).
2.3. Image analysis
SUVmax based on body weight and MTV were determined by the attenuation-corrected PET data using the PMOD 3.5 software (PMOD Technologies Ltd, Zurich, Switzerland). Several segmentation methods have been proposed for the analysis of PET images in breast cancer patients, but no widely accepted guidelines exist. Of the various methods described for determining metabolic volumes, a fixed threshold of SUV 2.5, as previously reported, was used.[12] An experienced nuclear medicine physician and a resident of nuclear medicine (blinded to the clinical data but not to tumor location) analyzed all PET/CT images retrospectively. The borders of volumes of interest (VOI) were adjusted manually to exclude adjacent physiological FDG-avid structures on PET/CT images. The VOIs were verified and validated by an independent senior nuclear medicine physician. The tumor boundaries were then automatically contoured based on the fixed threshold of SUV2.5.
The ASP of VOI was computed together with SUVmax, SUVmean, MTV, and TLG.
2.3.1. Asphericity
The ASP of the primary tumor was defined as
 |
where S and V are the surface and volume of the MTV, respectively.
The rationale for this definition is described in detail in previous reports.[20–22] ASP is independent of the lesion size. It is zero for spherical lesions and is non-zero for all other lesion types. An ASP value of 0.5 or 50%, for example, means that the surface of the lesion is 50% larger than the surface of a sphere with the same volume. Thus, ASP is a quantitative measure of irregularity in shape indicating metabolic heterogeneity in the tumor caused by various biologic factors such as low metabolism in the necrotic regions of the tumor or metabolically active invasive regions in the tumor. Two representative orthogonal slices are shown in Fig. 1.
Figure 1.
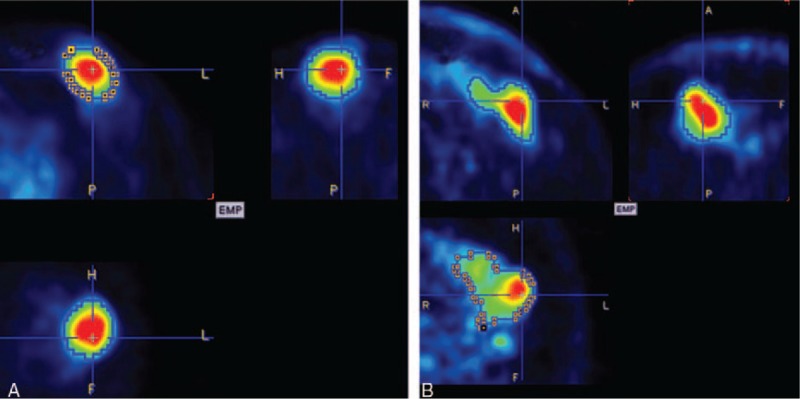
Representative orthogonal slices. The difference of the metabolic tumor volume (MTV) between A (10.9 mL) and B (20.1 mL) is twice. Whereas B (71%) has almost 9-fold asphericity (ASP) values compared with A (8%). The tumor delineation is marked with a blue line.
2.4. Pathologic examination
Immunohistochemical (IHC) staining was performed on formalin-fixed, paraffin-embedded tissue slices excised from representative breast tumors. Estrogen receptor (ER), progesterone receptor (PR), and HER2 expression was assessed by IHC analysis using commercial monoclonal antibodies for ER (1:200 dilution; Neomarker), PR (1:4500 dilution; Neomarker), and HER2 (1:300 dilution; DakoCytomation); the iView DAB detection kit (Ventana Medical Systems) was used for detection. Samples were scored positive for hormone receptors when the expression was ≥10%. The HER2 expression results by IHC analysis were scored as negative, 1+, 2+, or 3+ following the manufacturer's recommendations. Tissue samples with an HER2 IHC staining score of more than 2 were also tested by HER2 gene amplification using the fluorescence in situ hybridization (FISH) method. Tissue samples with an IHC staining score of 3+ were defined as HER2 positive, or a score of 2+ in the case of FISH-based IHC staging. The results were recorded following the guidelines of the American Society of Clinical Oncology and the College of American Pathologists.[25]
2.5. Statistical analysis
Survival time was derived from the date of 18F FDG-PET/CT scan to the date of recurrence or last follow-up. The parameters were evaluated in relation to PFS using receiver operating characteristic (ROC) curve analysis. The optimal cut-off values were used to define the 2 groups. Cox regression analysis with forward selection was used to develop the univariate and multivariate models analyzing the relation between the independent variables and PFS. Independent variables analyzed included age, tumor size, LN status, neoadjuvant chemotherapy, histological grade, ER and PRs, HER2 status, SUVmax, MTV, TLG, and ASP. PFS curve was generated using Kaplan–Meier methods and survival difference between groups was assessed by the log-rank test. For specifically evaluating the prognostic value of ASP, we analyzed PFS in subgroups comprising patients with LN metastasis. Medcalc version 15.4 (Medcalc Software, Ostend, Belgium) was used for all analyses. All P values were 2-sided and values of <.05 were considered statistically significant.
3. Results
3.1. Patients’ characteristics
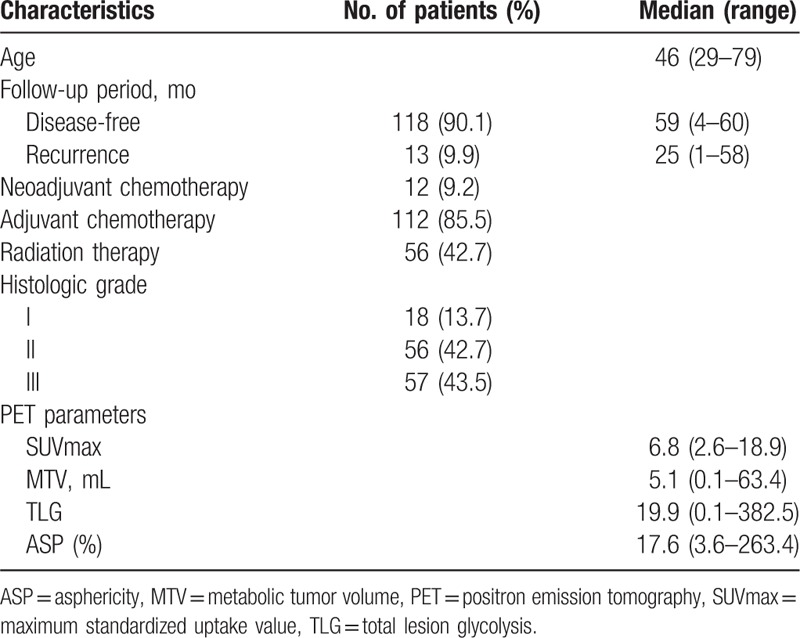
The characteristics of the study participants are listed in Table 1. Among the 131 patients, 12 (9.2%) received neoadjuvant chemotherapy before surgical treatment, 112 (85.5%) received adjuvant chemotherapy, and 56 (42.7%) received radiation therapy. Sixty-four patients (48.9%) had negative-LN metastasis (N-) and 67 patients (51.1%) had positive-LN metastasis (N+). In N+ patients, N stage was categorized on the basis of the staging system of the American Joint Committee on cancer[26] and 39 patients (58.2%) were assigned to N stage 1, 21 (31.3%) to N stage 2, and 7 (10.4%) to N stage 3. There were 5 patients (3.8%) in stage I, 98 patients (74.8%) in stage II, and 28 (21.4%) with stage III IDC.
Table 1.
Patient characteristics.
3.2. Patient outcome
Patients had a 5-year PFS rate of 90.1% (n = 118) with a mean follow-up time of 59 months. Recurrence or progression occurred in 13 patients after a mean time period of 25 months, as regional recurrence (n = 1), distant metastatic disease (n = 10), and a combination of both (n = 2). Five-year PFS rate in N+ patients was 82.1% (55 of 67) with a mean follow-up time of 48 months.
3.3. Relationship between ASP and clinicopathologic parameters
Table 2 summarizes ASP differences according to the clinicopathologic parameters. The mean ASP was 31.5% ± 37.5 (range, 3.6–263.4) and was significantly different among the N stage groups (P = .029). The mean ASP increases with an increase in the N stage. However, there was no significant difference in ASP according to T stage, ER, PR, and HER2 status.
Table 2.
Comparisons of asphericity according to clinicopathologic parameters.

3.4. PFS analysis
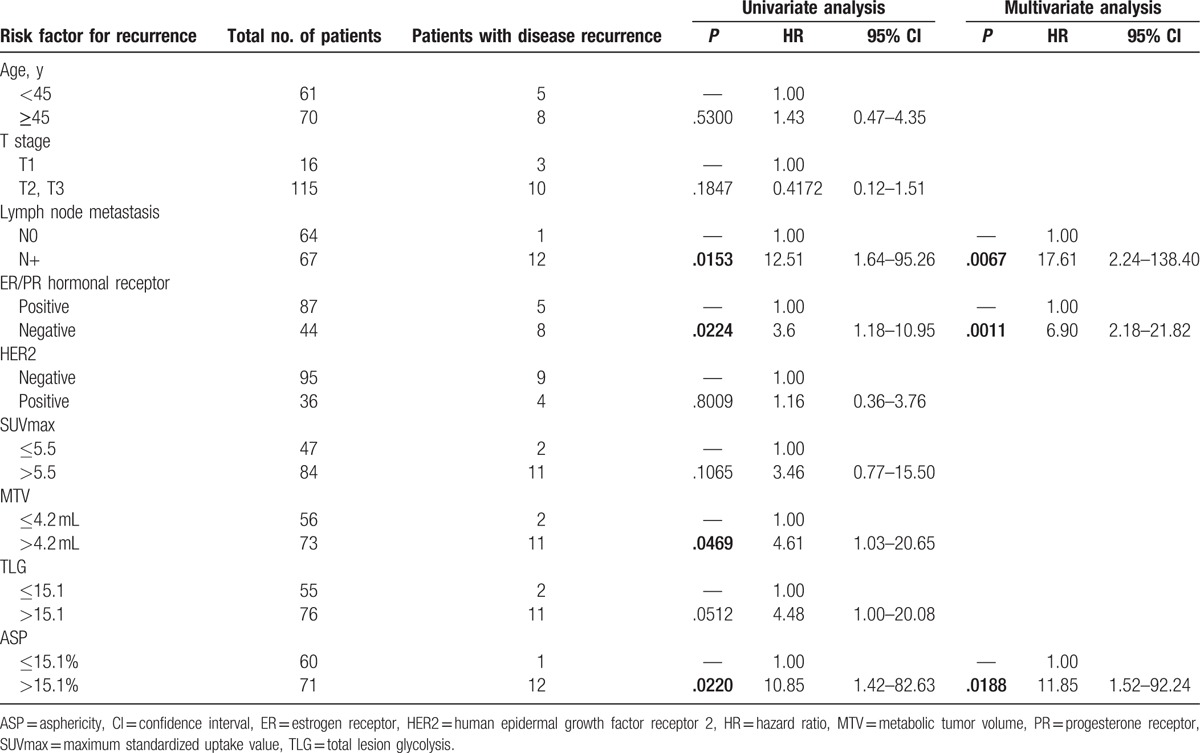
In all patients, univariate Cox regression analysis revealed the presence of metastatic LNs, hormonal receptor status, MTV (≤4.2 vs >4.2 mL), TLG (≤15.1 vs >15.1), and ASP (≤15.1% vs >15.1%) as significant predictors of decreased PFS, whereas age, T stage (T1 vs T2/3) as well as HER2 status showed no significant effect (Table 3). From the multivariate Cox regression analysis, it was seen that the presence of metastatic LNs [hazard ratio (HR) = 17.6; 95% confidence interval (95% CI) = 2.24–138.40; P = .0067], negative hormonal receptor (HR = 6.9; 95% CI = 2.18–21.82; P = .0011), and high ASP (HR = 11.9; 95% CI = 1.52–92.24; P = .0188) were significant predictors of PFS.
Table 3.
Factors associated with progression-free survival.
The status of LN metastasis was the most significant predictor and the ASP was significantly different among the N stage groups. Subgroup analysis for PFS in patients with LN metastasis was performed. Among these 67 patients, 55 (82.1%) were disease-free and 12 (17.9%) had disease recurrence. Univariate analysis by Cox regression analysis revealed that hormonal receptor status, SUVmax, MTV, TLG, and ASP were significant predictors. Among these 5 variables, ASP (HR = 10.9; 95% CI = 1.39–86.41; P = .0240) and hormonal receptor status (HR = 9.1; 95% CI = 2.65–30.95; P = .0005) were found to be predictors of PFS by multivariate analysis (Table 4). Kaplan–Meier curves with respect to PFS for SUVmax, MTV, TLG, and ASP for all the patients and specifically for N+ patients are given in Figs. 2 and 3.
Table 4.
Factors associated with progression-free survival in patients with lymph node metastasis.
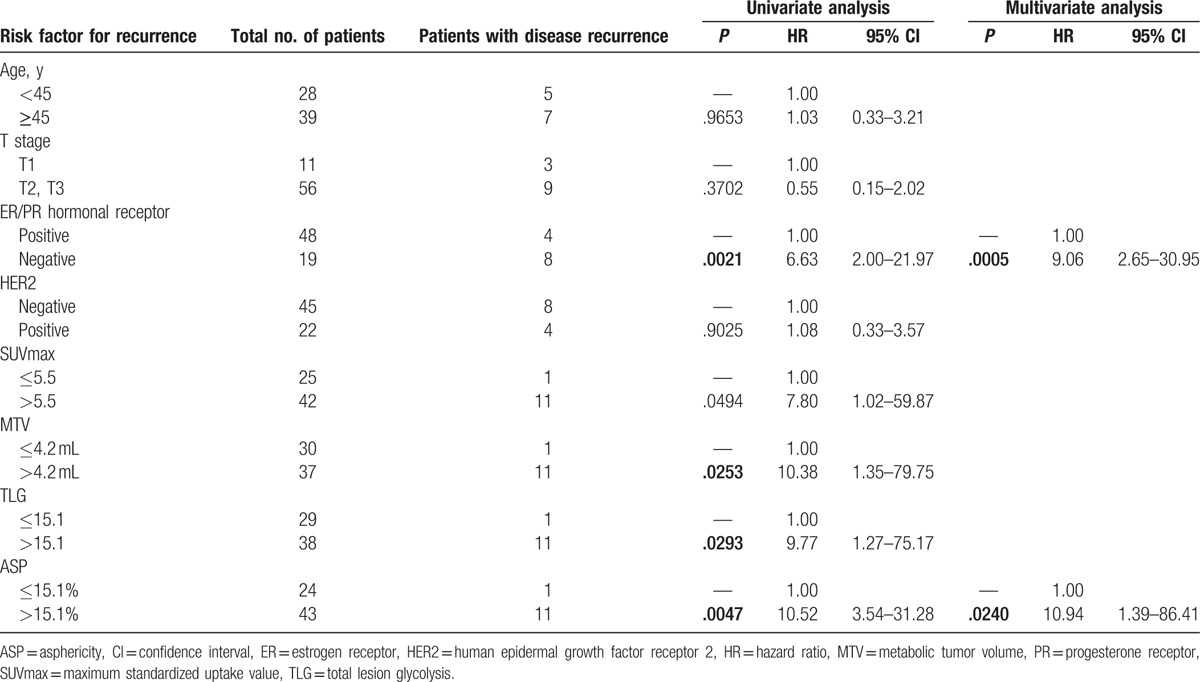
Figure 2.
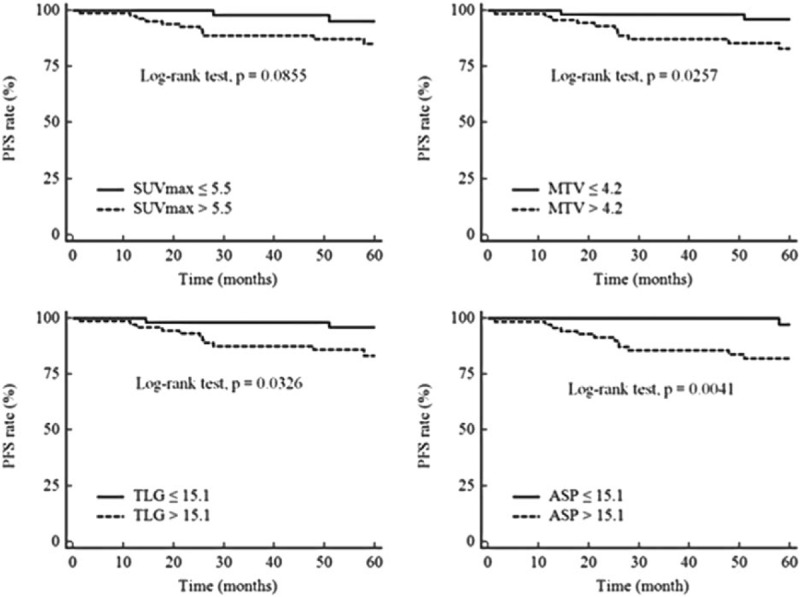
Kaplan–Meier curves with respect to progression-free survival for all patients. Kaplan–Meier curves for the quantitative PET parameters, maximum standardized uptake value (SUVmax), metabolic tumor volume (MTV), total lesion glycolysis (TLG), and asphericity (ASP) with respect to progression-free survival (PFS) for all patients (n = 131). Cut-off values and P values are shown on each panel.
Figure 3.
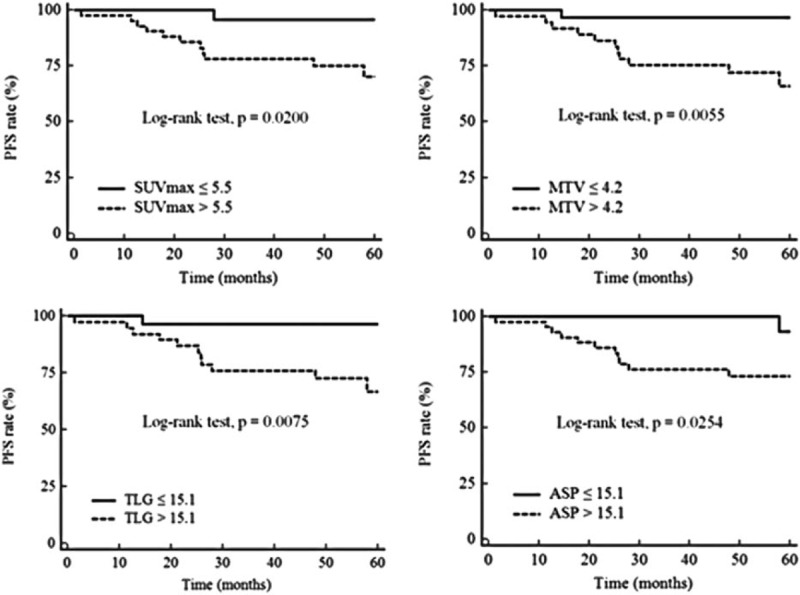
Kaplan–Meier curves with respect to progression-free survival for patients with lymph node metastasis. Kaplan–Meier curves for the quantitative PET parameters, maximum standardized uptake value (SUVmax), metabolic tumor volume (MTV), total lesion glycolysis (TLG), and asphericity (ASP) with respect to progression-free survival (PFS) for patients with lymph node metastasis (n = 67). Cut-off values and P values are shown on each panel.
3.5. Discussion and conclusion
For patients with breast cancer, pathologic determination of tumor size, axillary LN involvement, hormonal receptor status, and HER2 status have been used as prognostic factors. Traditionally, it has long been recognized that breast cancer patients with histologically confirmed LN involvement have a significantly poorer prognosis than those without nodal metastases. This is because LN involvement is closely associated with the development of distant metastases.[3,4,14,27] Our results also show that the presence of metastatic LNs was an independent prognostic factor (HR = 17.61, P = .0067). However, an accurate LN status can be obtained only after surgery and cannot completely explain the extent of variability in the clinical course, as breast cancer is a remarkably heterogeneous disease.
Preoperative 18F FDG-PET/CT is a noninvasive diagnostic modality that can indicate the degree of glucose metabolism in tumors, which represents the aggressiveness of the malignant lesion.[7,28] There have been several reports suggesting that high SUV is associated with poor prognosis, whereas others did not find a similar prognostic power of SUVs in breast cancer patients.[10,11,14] Although several studies indicate that tumor burden, as measured by MTV and TLG, was significantly associated with poor prognosis, it remains controversial.[9,12,13] In the current study, none of these conventional metabolic PET parameters, including SUVmax, MTV, and TLG, were independent prognostic factors for PFS, while the ASP was an independent, significant prognostic factor (HR = 11.85; P = .0188). The probability of 5-year PFS decreased from 98.3% in patients with low ASP (≤15.1%) to 83.1% in the patients with high ASP (>15.1%). Furthermore, ASP was the most important prognostic factor for PFS in patients with LN metastasis (HR = 10.94; P = .0240). Although we cannot evaluate the prognostic power of ASP in patients without LN metastasis, because only 1 patient showed recurrence, this patient had a high ASP (Fig. 4.) The results from the current study demonstrate that the spatial heterogeneity of signal intensity in the PET images, resulting from heterogeneous 18F FDG uptake, is associated with tumor recurrence. Previous studies revealed that relevant improvement in prognosis can be achieved by the ASP, a novel parameter for quantitatively characterizing the spatial heterogeneity in 18F FDG uptake by the primary tumor.[20–22] Apostolova et al[20] reasoned that the observed ASP results from heterogeneous FDG uptake by the tumor, which in turn results from the prominent intratumoral spatial variation in cellularity, angiogenesis, extravascular and extracellular matrices, and necrosis in aggressive and heterogeneous tumors. ASP were correlated with Ki-67 index and EGFR expression and showed a tendency for a significant association with the extent of VEGF expression in lung cancer patients.[29] A high Ki-67 index has been reported to reflect the degree of proliferation of tumors and to predict a poor survival. Activation of EGFR inhibits tumor cell apoptosis and induces angiogenesis. And VEGF expression suggests that angiogenesis of tumors might contribute to increased shape irregularity.[29] It has been shown that high tumor heterogeneity with respect to various biological parameters is known to be associated with aggressive tumor behavior, response to therapy, and survival in a number of cancer types. 18F FDG-PET based measurement of heterogeneity has been found to be superior to SUVs for various indications.[10,15] In a recent study, Son et al[16] quantified intratumoral heterogeneity of FDG uptake by defining the heterogeneity factor as the slope of a straight line obtained from a linear regression of a plot of the MTV as a function of the threshold (% SUVmax) for delineation of the tumor. Low heterogeneity factor was associated with longer PFS in patients with breast cancer.
Figure 4.

18F FDG-PET/CT images of the patient had progression in N0 group. The patient was a 52-year-old woman with invasive ductal carcinoma in the left breast. Maximal intensity projection image of 18F FDG-PET/CT shows focal 18F FDG uptake (black arrow) in the inner portion of the left breast (A). Axial fusion image shows hypermetabolic lesion (white arrow) with maximum standardized uptake value (SUVmax) = 4.5, metabolic tumor volume (MTV) = 2.9 mL, and total lesion glycolysis (TLG) = 12.1 (B). PMOD image shows an ovoid mass with asphericity (ASP) = 34.9% (C). The patient underwent surgery and the tumor was classified as stage 2 (T2N0M0), ER/PR+, and HER2-. However, 51 months after the surgery, bone metastasis in lumbar spine (arrow head) was detected using a whole-body 18F FDG-PET/CT scan (D).
In the current study, we used a fixed threshold of SUV 2.5 for delineation of the tumor. Several segmentation methods have been proposed for the analysis of PET images in breast cancer patients, including a minimum SUV threshold, a fixed percentage threshold of the local SUVmax, and adaptive threshold methods, but no widely accepted guidelines exist.[19,22] Not only MTV but also ASP may range widely even in the same tumor, according to the method used. The adaptive threshold method is more tedious and requires preliminary calibration of the machine. However, commercial tools with a threshold method allows for automated segmentation, limiting inter-observer variability and can enable more rapid and easier measurement of volumetric parameters. The fixed 40% or 50% of local maximum intensity were used as the threshold intensity values in previous studies.[10,16,30] Using the fixed percentage threshold, VOIs were usually contoured by internal portion of tumor diminishing protruding portions. Thus, these thresholds made ASP to be underestimated. For evaluating ASP, it is very important to contain the entire tumor, especially protruding portion. In addition, previous studies reported that ER-positive tumors are usually characterized by rather low SUVs compared with other breast cancer phenotypes.[9,31] Thus, using fixed percentage threshold of the SUVmax may result in overestimation in ER-positive tumors or underestimation in ER-negative tumor. As a result, ASP using fixed percentage threshold did not significantly predict PFS. On the contrary, the minimum SUV 2.0 or 2.5 threshold were also used in many studies.[12,13,32] However, ASP using the fixed SUV 2.0 could not reflect the correct tumor volume. Because breast tissue might show moderate uptake of FDG, normal tissue was contained in VOI.[33] It leads to overestimated MTV and underestimated ASP. Whereas a fixed threshold of SUV 2.5 can contain all malignant lesions and reflect the tumor burden more accurately.[34,35] A fixed threshold of SUV 2.5 has been shown to be a reliable correlation in clinical studies.[12,13] However, as a consensus has yet to be reached, there needs to be further discussion of the most appropriate segmentation method for validation.
Previous studies indicate that HER2 overexpression is strongly associated with increased disease recurrence and a poor prognosis.[36] However, the results of our study did not show a significantly decreased PFS rate in patients who were HER2-positive. The lack of prognostic value for HER2 could be linked to trastuzumab treatment, which was postoperatively administered for 1 year to patients with HER2-positive breast cancer. In addition, the small number of enrolled patients and the relatively short-term follow-up periods can affect the prognostic value for HER2.
Our study has several limitations. First, it had a retrospective design, which may have predisposed to selection bias and the general applicability of our results may therefore be limited. To mitigate this problem, however, we used obviously defined inclusion and exclusion criteria and included all consecutive patients. The exclusion of patients with a primary tumor size less than 2 cm, to overcome the limited spatial resolution of PET, and the resulting inability to characterize tracer distribution for small lesions may limit the generalizability of our results and prevent the risk stratification from being applicable to patients with small primary tumors. We observed that T stage is not a statistically significant prognostic factor. This could be caused by this exclusion and then our sample size of patients with T1 stage does not provide sufficient statistical power to detect such an effect. We are also limited by the use of 2 different imaging systems for data acquisition. This might lead to additional variability in the SUV measures, which possibly resulted in the underestimation of their prognostic power. However, the impact of the 2 different systems on MTV and ASP is expected to be minimal, as the Gaussian filter of 5.0 mm made the spatial resolution be essentially the same for both. Nevertheless, the same cut-off value of ASP, when used at different institutions and for different imaging systems, worked significantly for risk stratification in previous studies.[21] Therefore, ASP appears to provide a significant independent value for the prediction of outcome in breast cancer and is most likely unaffected by this limitation. Finally, we could not perform survival analysis and determine prognostic significance after relapse because of the relatively short follow-up periods. Thus, further prospective multi-institutional studies are required for the acceptance of ASP as a decisive prognostic factor for disease recurrence in IDC patients. Nevertheless, this report is noteworthy because it is the first study to show the prognostic value of ASP of primary tumor in patients with IDC.
In conclusion, the present study shows that ASP calculated from 18F FDG-PET/CT images, acquired before initial treatment, could be an independent prognostic factor for disease recurrence in IDC patients. Therefore, ASP can be useful in the identifying patients with a high-risk for recurrence and in deciding whether IDC patients with a high ASP require either a more aggressive local or systemic therapy or a careful recurrence work up.
Footnotes
Abbreviations: 18F FDG = 18F 2-deoxy-2-fluoro-D-glucose, ASP = asphericity, CI = confidence interval, CT = computed tomography, ER = estrogen receptor, FISH = fluorescence in situ hybridization, HER2 = human epidermal growth factor receptor 2, HR = hazard ratio, IDC = invasive ductal breast cancer, IHC = immunohistochemical, LN = lymph node, MRI = magnetic resonance imaging, MTV = metabolic tumor volume, N- = negative-LN metastasis, PET = positron emission tomography, PET/CT = positron emission tomography/computed tomography, PFS = progression-free survival, positive-LN metastasis, N+, PR = progesterone receptor, ROC = receiver operating characteristic, STE = standard test equipment, SUVmax = maximum standardized uptake value, TLG = total lesion glycolysis, VOI = volumes of interest.
Funding/support: This research was supported by a grant from the Korea health Technology R&D Project through the Korea Health Industry Development Institute (KHIDI), funded by the Ministry of Health & Welfare, Republic of Korea (grant number: HI15C0001).
The study protocol had been approved by the Ethics Committee of the Kyungpook National University Hospital (KNUH 2015–05–013). All procedures performed in studies involving human participants were in accordance with the ethical standards of the institutional research committee and with the 1964 Helsinki declaration and its later amendments.
No informed consent was needed because of the retrospective design of our study.
The authors declare that they have no conflict of interest.
References
- [1].Fitzmaurice C, Dicker D, Pain A, et al. The global burden of cancer 2013. JAMA Oncol 2015;1:505–27. [DOI] [PMC free article] [PubMed] [Google Scholar]
- [2].Song BI, Lee SW, Jeong SY, et al. 18F-FDG uptake by metastatic axillary lymph nodes on pretreatment PET/CT as a prognostic factor for recurrence in patients with invasive ductal breast cancer. J Nucl Med 2012;53:1337–44. [DOI] [PubMed] [Google Scholar]
- [3].Carter CL, Allen C, Henson DE. Relation of tumor size, lymph node status, and survival in 24,740 breast cancer cases. Cancer 1989;63:181–7. [DOI] [PubMed] [Google Scholar]
- [4].Fisher B, Bauer M, Wickerham DL, et al. Relation of number of positive axillary nodes to the prognosis of patients with primary breast cancer. An NSABP update. Cancer 1983;52:1551–7. [DOI] [PubMed] [Google Scholar]
- [5].Demicheli R, Abbattista A, Miceli R, et al. Time distribution of the recurrence risk for breast cancer patients undergoing mastectomy: further support about the concept of tumor dormancy. Breast Cancer Res Treat 1996;41:177–85. [DOI] [PubMed] [Google Scholar]
- [6].Kim CY, Jeong SY, Chong GO, et al. Quantitative metabolic parameters measured on F-18 FDG PET/CT predict survival after relapse in patients with relapsed epithelial ovarian cancer. Gynecol Oncol 2015;136:498–504. [DOI] [PubMed] [Google Scholar]
- [7].Kitajima K, Fukushima K, Miyoshi Y, et al. Association between (18)F-FDG uptake and molecular subtype of breast cancer. Eur J Nucl Med Mol Imaging 2015;42:1371–7. [DOI] [PubMed] [Google Scholar]
- [8].Lee CI, Gold LS, Nelson HD, et al. Comparative effectiveness of imaging modalities to determine metastatic breast cancer treatment response. Breast (Edinburgh, Scotland) 2015;24:3–11. [DOI] [PubMed] [Google Scholar]
- [9].Groheux D, Hatt M, Hindie E, et al. Estrogen receptor-positive/human epidermal growth factor receptor 2-negative breast tumors: early prediction of chemosensitivity with (18)F-fluorodeoxyglucose positron emission tomography/computed tomography during neoadjuvant chemotherapy. Cancer 2013;119:1960–8. [DOI] [PubMed] [Google Scholar]
- [10].Kim TH, Yoon JK, Kang DK, et al. Correlation between F-18 fluorodeoxyglucose positron emission tomography metabolic parameters and dynamic contrast-enhanced MRI-derived perfusion data in patients with invasive ductal breast carcinoma. Ann Surg Oncol 2015;22:3866–72. [DOI] [PubMed] [Google Scholar]
- [11].Ahn S, Park J, Lee H, et al. Standardized uptake value of 18F-fluorodeoxyglucose positron emission tomography for prediction of tumor recurrence in breast cancer beyond tumor burden. Breast Cancer Res 2014;16:3418. [DOI] [PMC free article] [PubMed] [Google Scholar]
- [12].Kim J, Yoo SW, Kang SR, et al. Prognostic significance of metabolic tumor volume measured by (18)F-FDG PET/CT in operable primary breast cancer. Nucl Med Mol Imaging 2012;46:278–85. [DOI] [PMC free article] [PubMed] [Google Scholar]
- [13].Hyun SH, Ahn HK, Park YH, et al. Volume-based metabolic tumor response to neoadjuvant chemotherapy is associated with an increased risk of recurrence in breast cancer. Radiology 2015;275:235–44. [DOI] [PubMed] [Google Scholar]
- [14].Jo I, Zeon SK, Kim SH, et al. Correlation of primary tumor FDG uptake with clinicopathologic prognostic factors in invasive ductal carcinoma of the breast. Nucl Med Mol Imaging 2015;49:19–25. [DOI] [PMC free article] [PubMed] [Google Scholar]
- [15].Kim DH, Jung JH, Son SH, et al. Quantification of intratumoral metabolic macroheterogeneity on 18F-FDG PET/CT and its prognostic significance in pathologic N0 squamous cell lung carcinoma. Clin Nucl Med 2016;41:e70–5. [DOI] [PubMed] [Google Scholar]
- [16].Son SH, Kim DH, Hong CM, et al. Prognostic implication of intratumoral metabolic heterogeneity in invasive ductal carcinoma of the breast. BMC Cancer 2014;14:585. [DOI] [PMC free article] [PubMed] [Google Scholar]
- [17].Doumou G, Siddique M, Tsoumpas C, et al. The precision of textural analysis in (18)F-FDG-PET scans of oesophageal cancer. Eur Radiol 2015;25:2805–12. [DOI] [PubMed] [Google Scholar]
- [18].Cheng NM, Fang YH, Lee LY, et al. Zone-size nonuniformity of 18F-FDG PET regional textural features predicts survival in patients with oropharyngeal cancer. Eur J Nucl Med Mol Imaging 2015;42:419–28. [DOI] [PubMed] [Google Scholar]
- [19].Hatt M, Majdoub M, Vallieres M, et al. 18F-FDG PET uptake characterization through texture analysis: investigating the complementary nature of heterogeneity and functional tumor volume in a multi-cancer site patient cohort. J Nucl Med 2015;56:38–44. [DOI] [PubMed] [Google Scholar]
- [20].Apostolova I, Steffen IG, Wedel F, et al. Asphericity of pretherapeutic tumour FDG uptake provides independent prognostic value in head-and-neck cancer. Eur Radiol 2014;24:2077–87. [DOI] [PubMed] [Google Scholar]
- [21].Hofheinz F, Lougovski A, Zophel K, et al. Increased evidence for the prognostic value of primary tumor asphericity in pretherapeutic FDG PET for risk stratification in patients with head and neck cancer. Eur J Nucl Med Mol Imaging 2015;42:429–37. [DOI] [PubMed] [Google Scholar]
- [22].Apostolova I, Rogasch J, Buchert R, et al. Quantitative assessment of the asphericity of pretherapeutic FDG uptake as an independent predictor of outcome in NSCLC. BMC Cancer 2014;14:896. [DOI] [PMC free article] [PubMed] [Google Scholar]
- [23].Tixier F, Hatt M, Valla C, et al. Visual versus quantitative assessment of intratumor 18F-FDG PET uptake heterogeneity: prognostic value in non-small cell lung cancer. J Nucl Med 2014;55:1235–41. [DOI] [PubMed] [Google Scholar]
- [24].Brooks FJ, Grigsby PW. The effect of small tumor volumes on studies of intratumoral heterogeneity of tracer uptake. J Nucl Med 2014;55:37–42. [DOI] [PMC free article] [PubMed] [Google Scholar]
- [25].Wolff AC, Hammond ME, Schwartz JN, et al. American Society of Clinical Oncology/College of American Pathologists guideline recommendations for human epidermal growth factor receptor 2 testing in breast cancer. J Clin Oncol 2007;25:118–45. [DOI] [PubMed] [Google Scholar]
- [26].Edge SB BD, Compton CC, Fritz AG, Greene FL, Trotti A. AJCC Cancer Staging Manual (7th ed). Springer: New York, NY:2010. [Google Scholar]
- [27].McGale P, Taylor C, Correa C, et al. Effect of radiotherapy after mastectomy and axillary surgery on 10-year recurrence and 20-year breast cancer mortality: meta-analysis of individual patient data for 8135 women in 22 randomised trials. Lancet 2014;383:2127–35. [DOI] [PMC free article] [PubMed] [Google Scholar]
- [28].Jung JH, Kim CY, Son SH, et al. Preoperative prediction of cervical lymph node metastasis using primary tumor SUVmax on 18F-FDG PET/CT in patients with papillary thyroid carcinoma. PLoS One 2015;10:e0144152. [DOI] [PMC free article] [PubMed] [Google Scholar]
- [29].Apostolova I, Ego K, Steffen IG, et al. The asphericity of the metabolic tumour volume in NSCLC: correlation with histopathology and molecular markers. Eur J Nucl Med Mol Imaging 2016;43:2360–73. [DOI] [PubMed] [Google Scholar]
- [30].Park S, Lee E, Rhee S, et al. Correlation between semi-quantitative 18F-FDG PET/CT parameters and Ki-67 expression in small cell lung cancer. Nucl Med Mol Imaging 2016;50:24–30. [DOI] [PMC free article] [PubMed] [Google Scholar]
- [31].Groheux D, Giacchetti S, Moretti JL, et al. Correlation of high 18F-FDG uptake to clinical, pathological and biological prognostic factors in breast cancer. Eur J Nucl Med Mol Imaging 2011;38:426–35. [DOI] [PubMed] [Google Scholar]
- [32].Park J, Chang KJ, Seo YS, et al. Tumor SUVmax normalized to liver uptake on 18F-FDG PET/CT predicts the pathologic complete response after neoadjuvant chemoradiotherapy in locally advanced rectal cancer. Nucl Med Mol Imaging 2014;48:295–302. [DOI] [PMC free article] [PubMed] [Google Scholar]
- [33].Ahmad Sarji S. Physiological uptake in FDG PET simulating disease. Biomed Imaging Interv J 2006;2:e59. [DOI] [PMC free article] [PubMed] [Google Scholar]
- [34].Beggs AD, Hain SF, Curran KM, et al. FDG-PET as a “metabolic biopsy” tool in non-lung lesions with indeterminate biopsy. Eur J Nucl Med Mol Imaging 2002;29:542–6. [DOI] [PubMed] [Google Scholar]
- [35].Hain SF, Curran KM, Beggs AD, et al. FDG-PET as a “metabolic biopsy” tool in thoracic lesions with indeterminate biopsy. Eur J Nucl Med 2001;28:1336–40. [DOI] [PubMed] [Google Scholar]
- [36].Tan M, Yu D. Molecular mechanisms of erbB2-mediated breast cancer chemoresistance. Adv Exp Med Biol 2007;608:119–29. [DOI] [PubMed] [Google Scholar]


