

Abstract
This study aimed to identify the underlying therapeutic targets of angiotensin II (AngII)-induced hypertension, and screen the related drugs.
The gene expression profiles of GSE93579 and GSE75815 were used to identify differentially expressed genes (DEGs) between AngII-induced hypertension and control samples based on meta-analysis. These DEGs were analyzed using Gene-Ontology (GO) function and pathway enrichment methods. Subsequently, the weighed gene coexpression network analysis (WGCNA)-based meta-analysis was applied to determine transcriptional signature with DEGs. Additionally, the functions of the modules were analyzed based on the network, and miRNAs were identified. Finally, small molecule drugs correlation with DEGs was identified.
In total, 346 upregulated DEGs (e.g., Rgs7 bp) and 360 downregulated DEGs (e.g., Ebf3) were identified between AngII and control samples. In addition, a total of 150 DEGs in the brown, red, and yellow modules with higher correlation coefficient according to WGCNA, were used to construct the coexpression network, including Rgs7 bp and Ebf3, etc. in brown modules. Besides, 3 modules were obtained after the functions of the modules analysis. Moreover, 5 miRNAs were integrated in modules, including miR-124A, miR-524, miR-493, miR-323, and miR-203. Finally, anisomycin was the highest correlation with DEGs.
MiR-124a might be involved in the pathogenesis of hypertension via targeting Ebf3 and Rgs7 bp, which possibly represent a novel and effective strategy for treatment of hypertension. Anisomycin might be performed to reduce blood pressure by blocking MAPK signaling pathway.
Keywords: angiotensin II, anisomycin, hypertension, meta-analysis, mitogen-activated protein kinase, weighed gene coexpression network analysis
1. Introduction
Hypertension (systolic blood pressure (BP) ≥140 mm Hg and diastolic BP ≥ 90 mm Hg) is an important public-health challenge and affects over a third of the people worldwide.[1] In China, hypertension is a leading cause of premature death for cardiovascular disease, and its prevalence and mortality are more than 30% and 43%, and costing is about 6.6% of total health expenditure.[2–4] Although the treatment of hypertension has been improved, the treatment rate in China was only about 20%.[4] Thus, more drugs are usually required. However, the pathophysiology processes of hypertension are still complex.
In general, hypertension is caused by the interplay of genetic and environmental factor, such as inheritance, sodium chloride intake, smoking.[5] The rennin–angiotensin system (RAS) has an important role in regulating blood pressure and the homeostasis of sodium and potassium.[6] Angiotensin II (AngII) in RAS is known to have effects beyond the elevation of blood pressure by mitogen-activated protein kinase (MAPK) signaling pathway.[7] Therefore, angiotensin-converting enzyme inhibitor and angiotensin receptor blocker are used to reduce the blood press. Therefore, the study of target biomarker is essential for hypertension.
MicroRNAs (miRNAs or miRs) as small non-coding RNAs, are well-known post-transcriptional regulation of mRNA expression. Some studies find that miRNAs are related to the etiology of hypertension, such as miRs20a-5p, 103a-2-5p, 30c-5p, 4763-5p, 4709-3p, and 4717-3p.[8] In hypertensive patients, miR-126 and miR-9 expression levels display a significant positive correlation.[9] Additionally, miRNA-130/301 members regulated endothelin-1 for pulmonary vascular cross-talk in pulmonary hypertension.[10] However, the therapeutic targets in hypertension remain undefined.
In the present study, we aimed to identify the underlying therapeutic targets of AngII-induced hypertension, and screen the related drugs. The gene expression profiles of GSE93579 and GSE75815 were used to identify differentially expressed genes (DEGs) between AngII-induced hypertension and control samples based on meta-analysis. These DEGs were analyzed using Gene-Ontology (GO) function and pathway enrichment methods. Subsequently, the weighed gene coexpression network analysis (WGCNA)-based meta-analysis was applied to determine transcriptional signature with DEGs in brown, red, and yellow modules. In addition, three modules were obtained after the functions of the modules analysis based on the network, and miRNAs were integrated in the modules. Finally, small molecule drugs correlation with DEGs was identified.
2. Methods
2.1. Microarray data and preprocessing
The gene expression profiles of GSE93579 and GSE75815 were downloaded from the Gene Expression Omnibus (GEO, http://www.ncbi.nlm.nih.gov/geo/) database through retrieving “hypertension and angiotensin.” Overall, the microarray data of 15 aorta samples from hypertensive mice were deposited at GEO server with GSE93579 by Rippe et al,[11] including 8 AngII samples treated with AngII (1 μg/kg/min) and 7 control samples treated with saline. In their study, the protocols were approved by the animal care and use committee in Malmö/Lund (permit numbers M46-13 and M57-14) according to national guidelines and the European Communities’ Council Directive 86/609/EEC. The raw data was background corrected and normalized using oligo package in R software (version 3.3.2, https://cran.r-project.org/bin/windows/base/).[12,13]
In addition, the microarray data of 23 vascular tissue samples from hypertensive mice were deposited at GEO server with GSE75815 by Siedlinski,[14] including 12 AngII samples from AngII-infused hypertensive mice at speed of 490 ng/kg/min and 11 control samples. This study was performed using relevant guidelines and Local Ethics Committee no. 1 in Kraków (Poland) approved the protocols employed (permissions nos. 151/2012, 100/2013, 254/2015, and 157/2016). The probes were corresponded to gene symbol according to the latest annotations file from NCBI gene database. When more than 1 probe was corresponded to the same gene symbol, the median value would be the expression level of gene. Subsequently, these data fitted log-normal distribution using log2 function, and normalized using median function of limma package in R software (Linear Models for Microarray Data, http://www.bioconductor.org/packages/release/bioc/html/limma.html). Finally, heatmap.sig.genes function in MetaDE package (https://cran.r-project.org/web/packages/MetaDE/) was used to show the correlation matrices of DEGs in GSE93597 and GSE75815.
2.2. Identification of DEGs using meta-analysis
DEGs between were identified using MetaDE package, which contains many advanced genomic meta-analysis methods to identify.[15] First, heterogeneity test was performed. The threshold value of homogeneity test was set as tau2 = 0 and Qpval > 0.05, which means that these genes expression levels are homogeneous without bias in each gene expression profile. Then the threshold value of DEGs was set as |log fold change (FC)| > 1 and P value adjustment < 0.05.
2.3. Gene ontology (GO) enrichment function and pathway analysis
GOstat is helpful to analyze biological processes (BP) of genes from high-throughput experiments, such as microarrays.[16] GO as the framework for the model of biology is used to describe gene function, and relationships between these concepts including BP, cellular components (CC), and molecular functions (MF). To comprehend the DEGs involved in BP, CC, and MF, the GO enrichment analyses were performed with GOstat (http://gostat.wehi.edu.au/) using the hypergeometric distribution method. The formula is 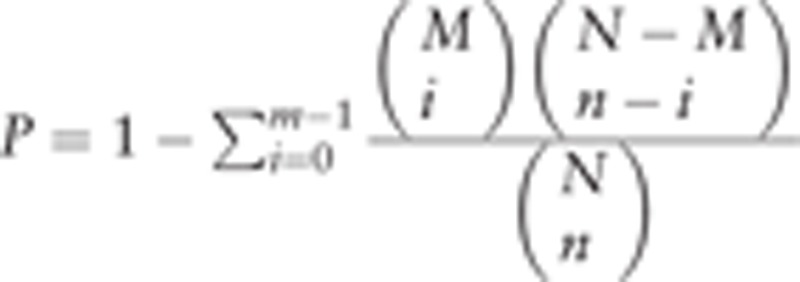 , where N is the total number of genes enriched in all GO terms; n is the number of feature genes enriched in all GO terms; M is the number of genes in a specific GO term; and m is the number of feature genes in a specific GO term. P value < 0.05 was significantly different.
2.4. WGCNA of DEGs based on meta-analysis
WGCNA is a systems method for identifying target gene of disease in bioinformatics applications, which can be used for describing the correlation among genes by finding significant modules in the high-throughput sequencing data.[17] First, meta-analysis was used to integrate the above DEGs expression levels and compare gene–gene correlation in the 2 microarray data. In the present study, GSE93597 as master dataset and GSE75815 as slave dataset were used to identify the modules related to AngII-induced hypertension. As follows: the correlation of the expression values of DEGs in the 2 datasets was analyzed. The higher the correlation, the higher the consistency of gene expression in each dataset. This is a prerequisite for constructing a WGCNA network using meta-analysis. The correlation matrix of gene coexpression was constructed according to Smn = |cor(m,n), where Smn indicates correlation coefficient of coexpression patterns between genes m and n. The adjacency is defined as amn = power(Smnβ), which measures pairwise correlations between gene expressions. Adjacency functions for both weighted and unweighted networks require the user to choose threshold parameters, correlation coefficient between log2 k (node conut) and log2 p(k) (frequency of node) ≥0.9 was set as threshold. The correlation matrix Smn was transformed to adjacency matrix amn. Then adjacency matrix amn was transformed to topological matrix using the following equation:
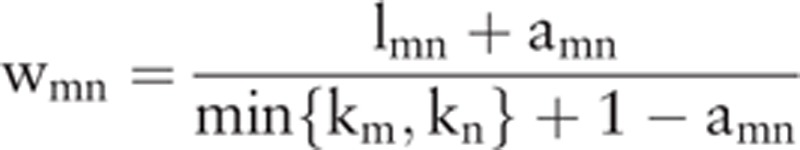 |
where lmn indicates the sum of adjacency coefficient of the common edge between genes m and n; km indicates sum of connection strengths of m with the other network genes. Gene significance (GS) measures were used to incorporate external information into the coexpression network. Module significance is determined through the average absolute GS for all genes in a module. Subsequently, coexpression network was visualized using the Cytoscape 3.3 software.
2.5. Identification of modules in the coexpression network
MCODE (degree cutoff = 2, node score cutoff = 0.2, and K-core = 2) and BINGO (adjusted P < .05) plugin in Cytoscape software (version 3.3, http://cytoscape.org/) were used to analyze the functions of the modules based on the network.[18,19] Modules indicate the topological structures of genes interrelation in the network.[20]
2.6. Identification of miRNA related to DEGs in modules
WebGestalt was performed to search miRNA related to the modules in the coexpression network. The cutoff of P value was less than 0.05. Finally, the miRNA regulatory network was constructed using miRNAs and target genes based on the modules.
2.7. Small molecule drugs related to DEGs in coexpression network
These DEGs were uploaded to connectivity map, and then the small molecule drugs connected disease and DEGs were identified. The threshold value of small molecule drugs was set as |score| > 0.8.[21]
3. Results
3.1. DEGs in hypertension mice exposure to AngII
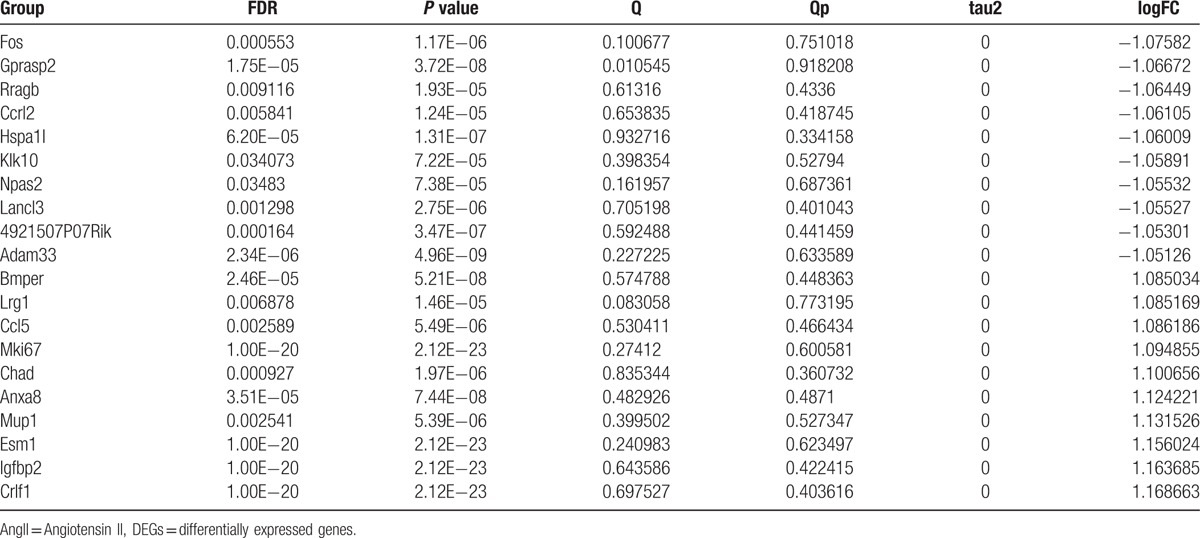
In total, 706 DEGs were identified between AngII and control samples based on meta-analysis, including 346 upregulated DEGs (e.g., Ebf3) and 360 downregulated DEGs. These DEGs could be well distinguished in AngII and control samples (Fig. 1). The top 10 upregulated and downregulated DEGs were shown in Table 1, such as Fos, Gprasp2, Bmper, and Lrg1.
Figure 1.
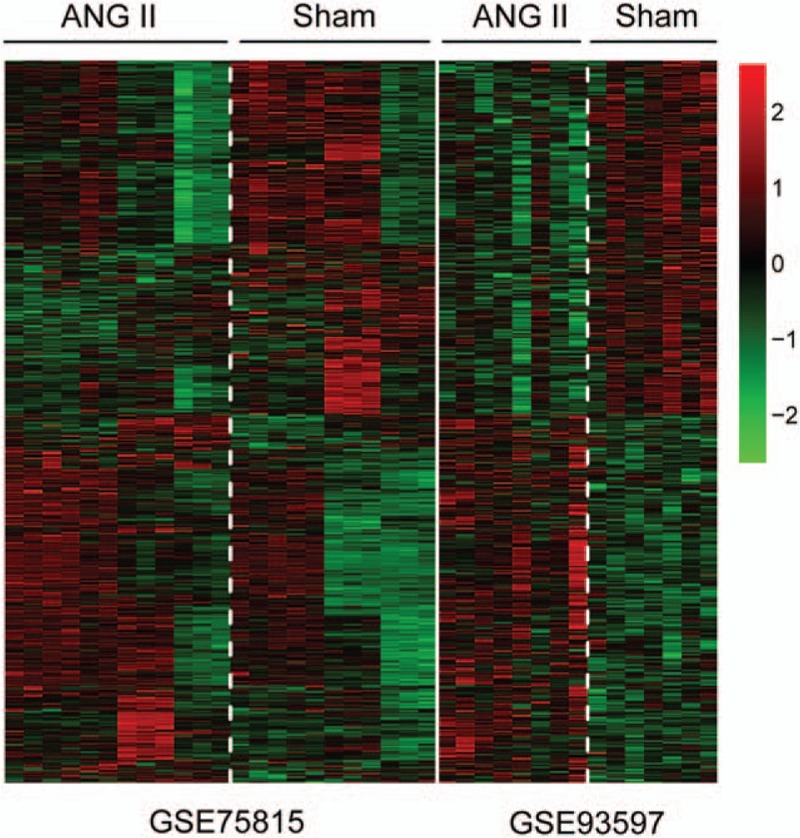
The heatmap of differentially expressed genes (DEGs) between Angiotensin II (AngII)-induced hypertension and control samples. Red colors indicate overexpressed genes and green colors indicate downexpressed genes in AngII-induced hypertension mice compared with the corresponding control samples.
Table 1.
The top 10 upregulated and downregulated DEGs between AngII and control samples based on meta-analysis.
3.2. The result of GO enrichment function and pathway analysis
In total 22 GO terms including 8 BP terms (regulation of transcription and regulation of RNA metabolic process, etc.), 7 CC terms (extracellular region and membrane-enclosed lumen, etc.), and 8 MF terms (ion binding and DNA binding, etc.) were enriched (Fig. 2A). In addition, 13 pathways, such as MAPK signaling pathway, focal adhesion, and regulation of actin cytoskeleton, were also identified (Fig. 2B).
Figure 2.
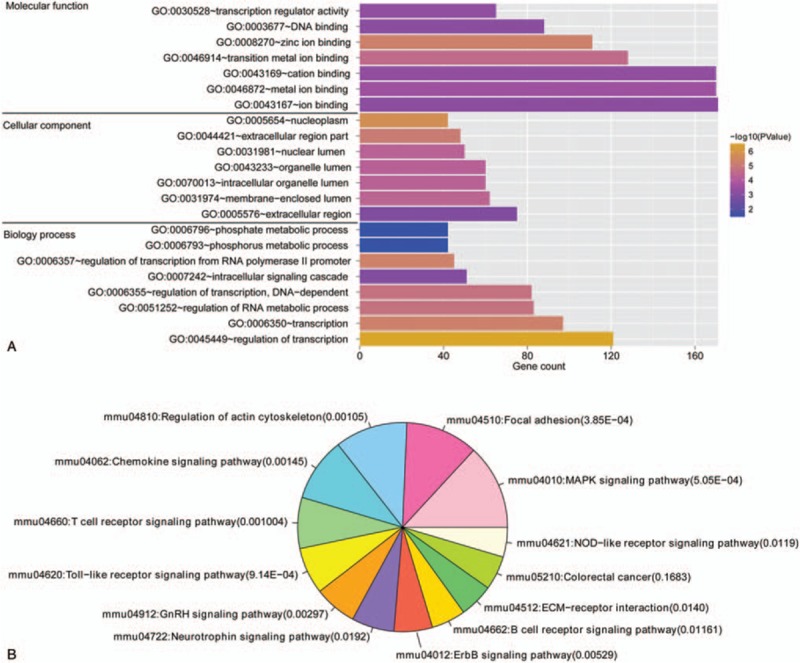
The Gene-Ontology terms and pathway enrichment results of DEGs under the cutoff of P value < .05. A, The biological processes (BP), cellular components (CC), and molecular functions (MF) terms of DEGs were involved in hypertension mice exposure to AngII. The horizontal axis indicates the count of genes. The colors of column indicate the different P value. B, The pathway enrichment results of DEGs.
3.3. The construction of coexpression network
The consistency analysis showed that the correlation between GSE93597 and GSE75815 data was high (correlation coefficient = 0.71 and P = 5.2E−48) (Fig. 3). Gene cluster dendrogram is obtained by average linkage hierarchical clustering (Fig. 4A and B). In addition, the brown, red, and yellow modules had a higher correlation coefficient among these modules (P < .05, correlation coefficient > 0.6) (Fig. 4C and D). Subsequently, a total of 150 DEGs in the 3 modules were used to construct the weighed gene coexpression network, including 67 DEGs in brown modules (42 downregulated DEGs and 25 upregulated DEGs), 40 DEGs in red modules (such as 16 downregulated DEGs and 24 upregulated DEGs), and 43 DEGs in yellow modules (such as 21 downregulated DEGs and 22 upregulated DEGs) (Fig. 5).
Figure 3.
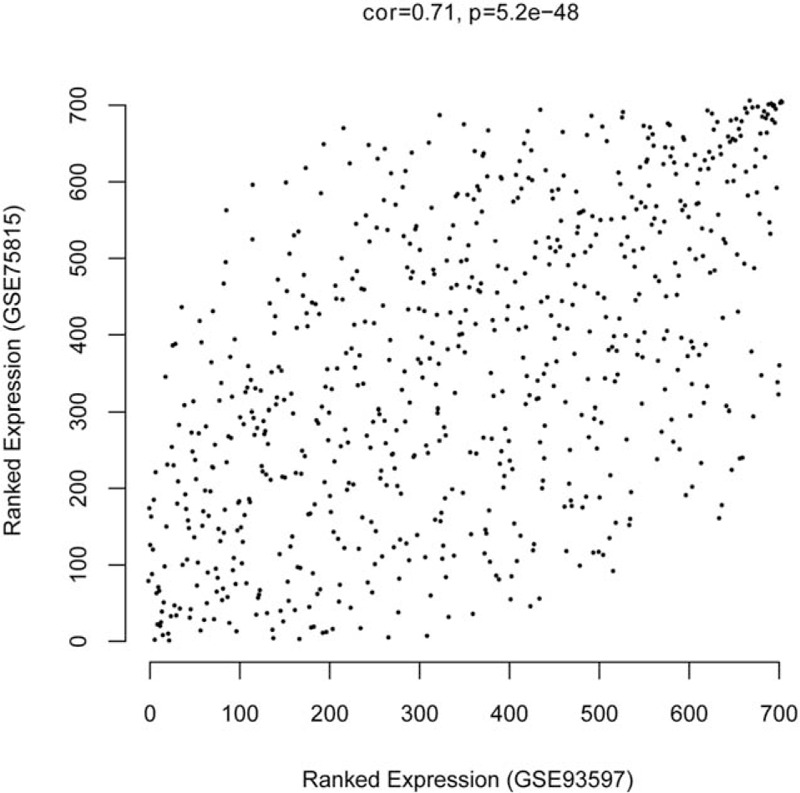
The correlation of DEGs expression value between GSE93597 and GSE75815 data.
Figure 4.
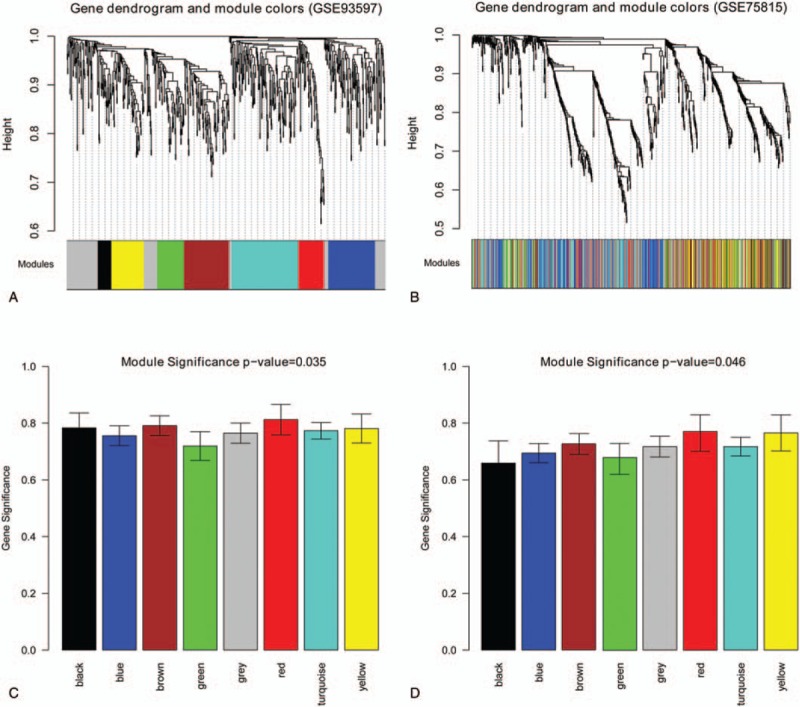
Weighed gene coexpression network analysis of DEGs data in GSE93597 and GSE75815 data. The color row underneath the dendrogram indicates the module in gene cluster dendrogram based on GSE93597 (A) and GSE75815 (B) data. The correlation between modules and hypertension in GSE93597 (C) and GSE75815 (D) data was calculated. The horizontal axis indicates modules with different colors.
Figure 5.
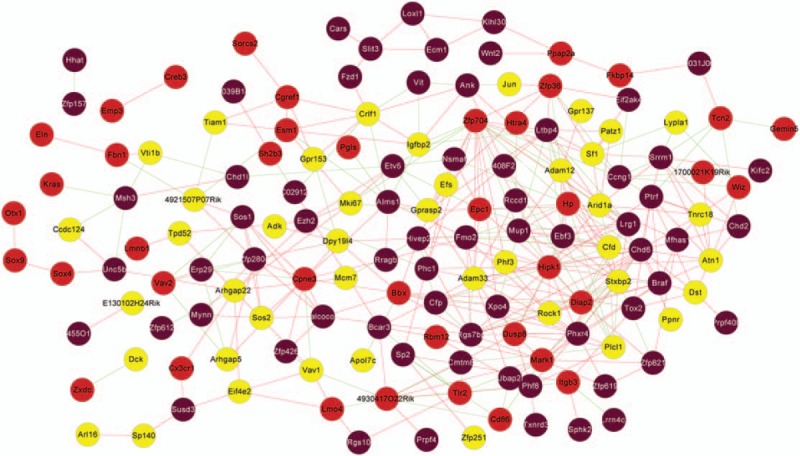
The weighed gene coexpression network. The different colors indicate different modules including 150 DEGs.
3.4. The miRNA regulatory network
Three modules were obtained after the functions of the modules analysis, such as modules 1, 2, and 3 (Fig. 6A–C). In addition, the network on miRNAs and target genes based on the modules was constructed (Fig. 6A), including miR-124A, miR-524, miR-493, miR-323, and miR-203. Besides, the module 1 was involved in cellular process, macromolecule metabolic process, and so on; the module 2 was involved in intracellular signaling pathway, regulation of Rho protein signal transduction, and so on; the module 3 was involved in cobalamin transport, regulation of transcription termination, and so on.
Figure 6.
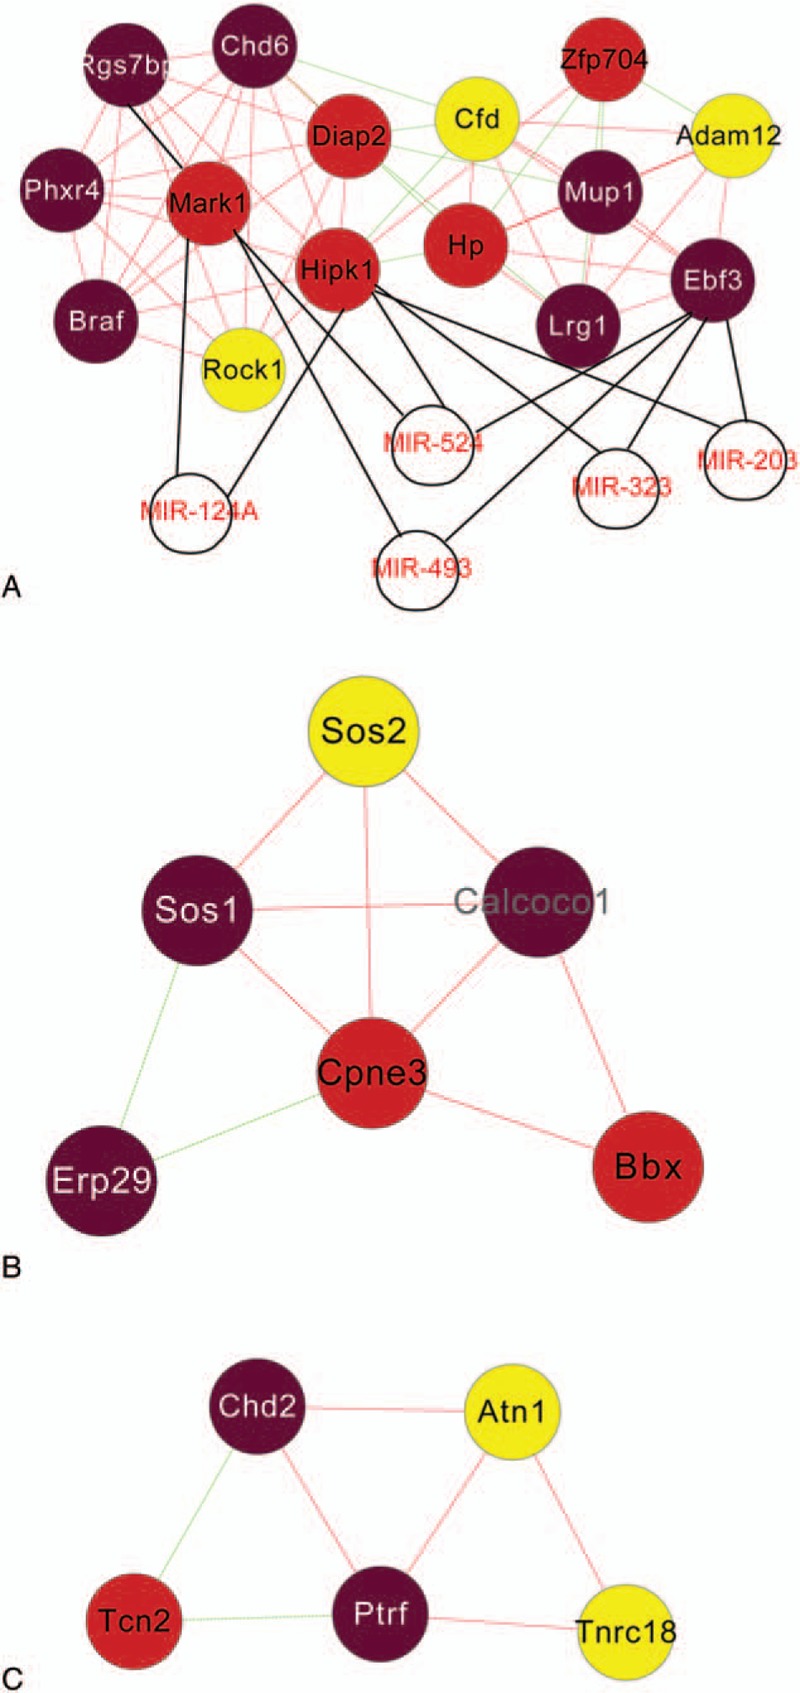
Modules based on coexpression network. The miRNA regulatory network was constructed with miRNAs and target genes in the module 1 (A). The modules 2 (B) and 3 (C) were identified.
3.5. Small molecule drugs competing against AngII
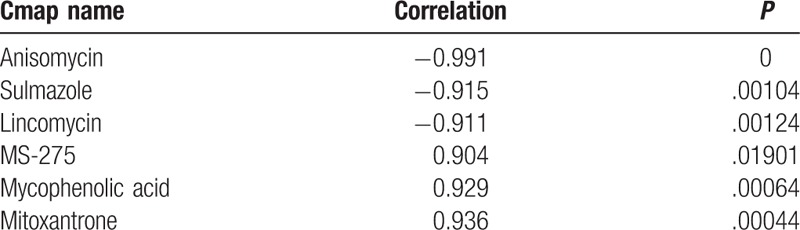
Overall, 3 drugs among total 6 drugs connected DEGs in the coexpression network were negatively correlated with disease (Table 2). In other words, the 3 drugs could compete against the effect of AngII. Anisomycin has the highest correlation in the 3 drugs.
Table 2.
Total 6 drugs connected DEGs in the coexpression network were negatively correlated with hypertension.
4. Discussion
In the present study, a total of 706 DEGs were identified between AngII and control samples based on meta-analysis, including 346 upregulated DEGs (e.g., Rgs7 bp) and 360 downregulated DEGs (e.g., Ebf3). In addition, a total of 150 DEGs in the brown, red, and yellow modules with higher correlation coefficient according to WGCNA were used to construct the weighed gene coexpression network, including 67 DEGs in brown modules (including Rgs7 bp and Ebf3, etc.), 40 DEGs in red modules, and 43 DEGs in yellow modules. Besides, 3 modules (modules 1, 2, and 3) were obtained after the functions of the modules analysis based on the coexpression network. Moreover, 5 miRNAs were integrated in the module 1, including miR-124A, miR-524, miR-493, miR-323, and miR-203. Finally, anisomycin was the highest correlation with DEGs in the coexpression network.
Overexpression of EBF3 has previously been served as tumor suppressors in several cancer types.[22] Since dopamine plays an important role in regulating renal function and blood pressure in humans with essential hypertension, lack of dopamine receptors results in hypertension.[23] In addition, overexpression of Ebf3 induces a significant increase in the terminal differentiation of dopamine neurons.[24] Furthermore, dopamine receptor subtypes, such as D1 receptor (D1R) and D5R, closely related to AngII type 1 receptor (AT1R).[25] For example, the D1R inhibits AT1R function by completing abolition of AT1R signaling in the short term (min) or decreasing the AT1R receptor in the long term (24 h).[26,27] Therefore, overexpression of Ebf3 might be served as a candidate biomarker in AngII-induced hypertension. In addition, Rgs7 bp (or R7 bp) named regulator of G-protein signaling 7 binding protein is expressed in the mammalian nervous system.[28]R7BP strongly inhibits the effect on homo-oligomerization of regulator of G-protein signaling 7 by Tayou.[29] Moreover, in a previous study, G-protein-coupled receptor 7 may be a promising target in hypertension via mediating the PLC/PKC pathway to regulate arterial myogenic tone.[30] Therefore, Rgs7 bp might be served as a candidate biomarker in hypertension.
As reported in the previous studies, miRNAs are involved in the pathogenesis of various cardiovascular diseases, including pulmonary arterial hypertension characterized by profound elevation of blood pressure in the peripheral arteries of the lung.[31,32] In addition, endothelial dysfunction is closely related to pathogenesis of hypertension. Meanwhile, hypertension can lead to endothelial dysfunction.[33] In a review, miRNAs are defined as the potential therapeutic marker in many cardiovascular disorders through the complex interactions linking miRNAs, genes, and pathways leading to endothelial dysfunction.[34] Therefore, miRNAs might be potential therapeutic marker in hypertension. Remarkably, miR-124a expression is regulated by miR-150,[35] and both of them are usually tumor suppressors.[36,37] Cox regression analysis confirms downregulated miR-150 levels are a significant predictor of poor survival in pulmonary arterial hypertension by decreased levels of KLF2.[38] Moreover, miR-124a is reduced and its target genes expression levels (such as PTPB1 and PKM2) are increased in a rat model of pulmonary arterial hypertension.[39] In this study, overexpression of Ebf3 and downexpression of Rgs7 bp were the target genes of miR-124a. Therefore, miR-124a was involved in the pathogenesis of hypertension via targeting Ebf3 and Rgs7 bp.
Anisomycin was the highest correlation with DEGs in the coexpression network. It was an inhibitor of protein synthesis through blocking synthesis of peptide band and was a specific antagonist of JNK (MAPK subfamilies) with a concentration of 25 ng/mL.[40,41] In this study, MAPK signaling pathway was enriched in AngII-induced hypertension mice, including 20 DEGs. Similarly, AngII-induced hypertension production is possibly mediated by p38 MAPK.[42] Thus, MAPK inhibitor might achieve clinical outcome for the treatment of hypertension. Therefore, anisomycin might offer an effective strategy to treat hypertension and prevent the elevation of blood pressure.
However, the study had also several limitations. As follows, sample sizes were not affluent; experimental verification was insufficient. In addition, the human samples should be used instead of mouse samples. All of these were the sources of potential bias or imprecision. However, the algorithms in the study have been identified in many studies and uniform. Therefore, the miR-124a expression levels would be measured, and the PCR of Ebf3 and Rgs7 bp will be used to verify the predicted results, and anisomycin blocked the effect of AngII by MAPK pathway in hypertension will be identified in the next study.
In conclusion, Ebf3 and Rgs7 bp might be served as candidate biomarkers in AngII-induced hypertension. Furthermore, miR-124a might be involved in the pathogenesis of hypertension via targeting Ebf3 and Rgs7 bp. MiR-124a, or its targets, possibly represent a novel and effective strategy for the treatment of hypertension. In addition, anisomycin potentially prevented the elevation of blood pressure by blocking MAPK signaling pathway.
Footnotes
Abbreviations: AngII = Angiotensin II, AT1R = AngII type 1 receptor, BP = biological processes, BP = blood pressure, CC = cellular components, D1R = D1 receptor, DEGs = differentially expressed genes, GEO = Gene Expression Omnibus, GO = Gene-Ontology, GS = gene significance, limma = Linear Models for Microarray Data, MAPK = mitogen-activated protein kinase, MF = molecular functions, RAS = rennin–angiotensin system, WGCNA = weighed gene coexpression network analysis.
The authors have no conflicts of interest to disclose.
References
- [1].Mills KT, Bundy JD, Kelly TN, et al. Global disparities of hypertension prevalence and control. Circulation 2016;134:441–50. [DOI] [PMC free article] [PubMed] [Google Scholar]
- [2].Li W, Gu H, Teo KK, et al. Hypertension prevalence, awareness, treatment, and control in 115 rural and urban communities involving 47 000 people from China. J Hypertens 2016;34:39–46. [DOI] [PubMed] [Google Scholar]
- [3].Lewington S, Lacey B, Clarke R, et al. The burden of hypertension and associated risk for cardiovascular mortality in China. JAMA Intern Med 2016;176:524–32. [DOI] [PubMed] [Google Scholar]
- [4].Chen W-W, Gao R-L, Liu L-S, et al. China cardiovascular diseases report 2015: a summary. J Geriatr Cardiol 2017;14:1–0. [DOI] [PMC free article] [PubMed] [Google Scholar]
- [5].Zanchetti A. Genetic and environmental factors in development of hypertension. J Hypertens 2016;34:2109–10. [DOI] [PubMed] [Google Scholar]
- [6].Gralinski M, Neves LA, Tiniakova O. Renin–Angiotensin System. Drug Discovery Evaluation: Pharmacological Assays. 2016;665–707. ISBN: 978-3-319-05391-2 (Print) 978-3-319-05392-9 (Online). [Google Scholar]
- [7].Zhuo JL, Kobori H, Li XC, et al. Augmentation of angiotensinogen expression in the proximal tubule by intracellular angiotensin II via AT 1a/MAPK/NF-кB signaling pathways. Am J Physiol Renal Physiol 2016;310:F1103–12. [DOI] [PMC free article] [PubMed] [Google Scholar]
- [8].Dluzen DF, Hooten NN, Zhang Y, et al. Differential mRNA and MicroRNA Expression is Influenced by Race in Hypertensive and Non-hypertensive Women. Am Heart Assoc 2015;35:A435. [Google Scholar]
- [9].Kontaraki JE, Marketou ME, Zacharis EA, et al. MicroRNA-9 and microRNA-126 expression levels in patients with essential hypertension: potential markers of target-organ damage. J Am Soc Hypertens 2014;8:368–75. [DOI] [PubMed] [Google Scholar]
- [10].Bertero T, Cottrill K, Krauszman A, et al. The microRNA-130/301 family controls vasoconstriction in pulmonary hypertension. J Biol Chem 2015;290:2069–85. [DOI] [PMC free article] [PubMed] [Google Scholar]
- [11].Rippe C, Zhu B, Krawczyk KK, et al. Hypertension reduces soluble guanylyl cyclase expression in the mouse aorta via the Notch signaling pathway. Sci Rep 2017;7:1334. [DOI] [PMC free article] [PubMed] [Google Scholar]
- [12].Troyanskaya O, Cantor M, Sherlock G, et al. Missing value estimation methods for DNA microarrays. Bioinformatics 2001;17:520–5. [DOI] [PubMed] [Google Scholar]
- [13].Rao Y, Lee Y, Jarjoura D, et al. A comparison of normalization techniques for microRNA microarray data. Stat Appl Genet Mol Biol 2008;7: Article 22. [DOI] [PubMed] [Google Scholar]
- [14].Siedlinski M, Nosalski R, Szczepaniak P, et al. Vascular transcriptome profiling identifies Sphingosine kinase 1 as a modulator of angiotensin II-induced vascular dysfunction. Sci Rep 2017;7:44131. [DOI] [PMC free article] [PubMed] [Google Scholar]
- [15].Wang X, Kang DD, Shen K, et al. An R package suite for microarray meta-analysis in quality control, differentially expressed gene analysis and pathway enrichment detection. Bioinformatics 2012;28:2534–6. [DOI] [PMC free article] [PubMed] [Google Scholar]
- [16].Beißbarth T, Speed TP. GOstat: find statistically overrepresented Gene Ontologies within a group of genes. Bioinformatics 2004;20:1464–5. [DOI] [PubMed] [Google Scholar]
- [17].Langfelder P, Horvath S. WGCNA: an R package for weighted correlation network analysis. BMC Bioinformatics 2008;9:559. [DOI] [PMC free article] [PubMed] [Google Scholar]
- [18].Ardakani MJE, Safaei A, Oskouie AA, et al. Evaluation of liver cirrhosis and hepatocellular carcinoma using Protein-Protein Interaction Networks. Gastroenterol Hepatol Bed Bench 2016;9(suppl 1):S14–22. [PMC free article] [PubMed] [Google Scholar]
- [19].Maere S, Heymans K, Kuiper M. BiNGO: a Cytoscape plugin to assess overrepresentation of gene ontology categories in biological networks. Bioinformatics 2005;21:3448–9. [DOI] [PubMed] [Google Scholar]
- [20].Holtman IR, Raj DD, Miller JA, et al. Induction of a common microglia gene expression signature by aging and neurodegenerative conditions: a co-expression meta-analysis. Acta Neuropathol Commun 2015;3:31. [DOI] [PMC free article] [PubMed] [Google Scholar]
- [21].Lamb J. The Connectivity Map: a new tool for biomedical research. Nat Rev Cancer 2007;7:54–60. [DOI] [PubMed] [Google Scholar]
- [22].Bennett KL, Karpenko M, Lin M-T, et al. Frequently methylated tumor suppressor genes in head and neck squamous cell carcinoma. Cancer Res 2008;68:4494–9. [DOI] [PubMed] [Google Scholar]
- [23].Banday AA, Lokhandwala MF. Dopamine receptors and hypertension. Curr Hypertens Rep 2008;10:268–75. [DOI] [PubMed] [Google Scholar]
- [24].Baek S, Choi H, Kim J. Ebf3-miR218 regulation is involved in the development of dopaminergic neurons. Brain Res 2014;1587:23–32. [DOI] [PubMed] [Google Scholar]
- [25].Armando I, Villar VAM, Jose PA. Dopamine and renal function and blood pressure regulation. Compr Physiol 2011;1:1075–117. [DOI] [PMC free article] [PubMed] [Google Scholar]
- [26].Khan F, Špicarová Z, Zelenin S, et al. Negative reciprocity between angiotensin II type 1 and dopamine D1 receptors in rat renal proximal tubule cells. Am J Physiol Renal Physiol 2008;295:F1110–6. [DOI] [PubMed] [Google Scholar]
- [27].Zeng C, Wang Z, Hopfer U, et al. Rat strain effects of AT1 receptor activation on D1 dopamine receptors in immortalized renal proximal tubule cells. Hypertension 2005;46:799–805. [DOI] [PubMed] [Google Scholar]
- [28].Looney AP, Han R, Stawski L, et al. Synergistic role of endothelial ERG and FLI1 in mediating pulmonary vascular homeostasis. Am J Respir Cell Mol Biol 2017;57:121–31. [DOI] [PMC free article] [PubMed] [Google Scholar]
- [29].University of Miami, Tayou J. Homo-oligomerization of the Gb5-RGS7 Complex and its Regulation by R7BP and G Protein Activation. 2016;1–73. [Google Scholar]
- [30].Ji L, Zhu H, Chen H, et al. Modulation of CaV1.2 calcium channel by neuropeptide W regulates vascular myogenic tone via G protein-coupled receptor 7. J Hypertens 2015;33:2431–42. [DOI] [PubMed] [Google Scholar]
- [31].Romaine SP, Charchar FJ, Samani NJ, et al. Circulating microRNAs and hypertension—from new insights into blood pressure regulation to biomarkers of cardiovascular risk. Curr Opin Pharmacol 2016;27:1–7. [DOI] [PubMed] [Google Scholar]
- [32].Bátkai S, Thum T. MicroRNAs in hypertension: mechanisms and therapeutic targets. Current hypertension reports 2012;14:79–87. [DOI] [PubMed] [Google Scholar]
- [33].Perticone F, Ceravolo R, Pujia A, et al. Prognostic significance of endothelial dysfunction in hypertensive patients. Am J Hypertens 2001;14:191–6. [DOI] [PubMed] [Google Scholar]
- [34].Zoghi M, Nalbantgil I. Hypertension and endothelial dysfunction. Anatolian J Cardiol 2002;2:142–7. [PubMed] [Google Scholar]
- [35].Manoharan P, Basford JE, Pilcher-Roberts R, et al. Reduced miR-124a and miR-150 levels are associated with increased pro-inflammatory mediator expression in KLF2-deficient macrophages. J Biol Chem 2014. [DOI] [PMC free article] [PubMed] [Google Scholar]
- [36].Jeong D, Kim J, Nam J, et al. MicroRNA-124 links p53 to the NF-κB pathway in B-cell lymphomas. Leukemia 2015;29:1868–74. [DOI] [PubMed] [Google Scholar]
- [37].Qu Y, Pan S, Kang M, et al. MicroRNA-150 functions as a tumor suppressor in osteosarcoma by targeting IGF2BP1. Tumor Biol 2016;37:5275–84. [DOI] [PubMed] [Google Scholar]
- [38].Rhodes CJ, Wharton J, Boon RA, et al. Reduced microRNA-150 is associated with poor survival in pulmonary arterial hypertension. Am J Respir Crit Care Med 2013;187:294–302. [DOI] [PubMed] [Google Scholar]
- [39].Caruso P, Dunmore BJ, Schlosser K, et al. Identification of MIR-124a as a Major Regulator of Enhanced Endothelial Cell Glycolysis in Pulmonary Arterial Hypertension. Thorax 2016;71: A48.2–A49. [DOI] [PMC free article] [PubMed] [Google Scholar]
- [40].Cohen H, Kaplan Z, Matar MA, et al. Anisomycin, a protein synthesis inhibitor, disrupts traumatic memory consolidation and attenuates posttraumatic stress response in rats. Biol Psychiatry 2006;60:767–76. [DOI] [PubMed] [Google Scholar]
- [41].Jiang J, Liu Y, Fang W, et al. Sperm-associated antigen 9 promotes astrocytoma cell invasion through the upregulation of podocalyxin. Mol Med Rep 2014;10:417. [DOI] [PubMed] [Google Scholar]
- [42].Bao W, Behm DJ, Nerurkar SS, et al. Effects of p38 MAPK Inhibitor on angiotensin II-dependent hypertension, organ damage, and superoxide anion production. J Cardiovasc Pharmacol 2007;49:362–8. [DOI] [PubMed] [Google Scholar]