

Abstract
Importance
Longitudinal studies of delinquent youth have focused on criminal recidivism, not on psychosocial outcomes in adulthood. This omission is critical because most youth return to the community where they become the responsibility of pediatric health care providers.
Objective
To investigate 8 positive outcomes among delinquent youth 5 and 12 years after detention, focusing on sex and racial/ethnic differences.
Design
The Northwestern Juvenile Project, the first comprehensive longitudinal US study of long-term outcomes of delinquent youth after detention (n=1829). Youth were interviewed in detention and reinterviewed up to 9 times over 12 years.
Setting
Project staff conducted face-to-face structured interviews at the Cook County Juvenile Temporary Detention Center (Chicago, Illinois) between November 20, 1995, and June 14, 1998. At follow-ups, participants were interviewed wherever they were living, in the community or in correctional facilities.
Participants
Stratified random sample, 1172 males and 657 females (1005 African Americans, 524 Hispanics, 296 non-Hispanic whites, and 4 of other race/ethnicity). At baseline, median age was 15 years. Twelve years later, at median age 28 years, 1520 (83.1%) of the original sample remained.
Main Outcome and Measures
Achievement of positive outcomes in 8 domains: educational attainment, residential independence, gainful activity, desistance from criminal activity, mental health, abstaining from substance abuse, interpersonal functioning, and parenting responsibility. Outcomes were assessed with widely used measures supplemented by correctional records.
Results
Females were significantly more likely than males to achieve most positive outcomes. Twelve years after detention, only 21.9% of males and 54.7% of females had achieved more than half of the outcomes. As youth aged, the number of positive outcomes increased only modestly. Among males, non-Hispanic whites were significantly more likely to achieve most positive outcomes compared with minorities, but less likely to abstain from substance abuse. Latent class analysis shows that African American males fared the worst, with lives characterized by incarceration, criminal activity, and few positive outcomes.
Conclusions and Relevance
Findings highlight racial/ethnic disparities in achieving positive outcomes. To improve outcomes, pediatric health care professionals should recognize the importance of psychosocial health, facilitate access to services in the community, and partner with on-site systems of care.
The United States has the highest incarceration rate of any developed country.1 Each year, approximately 1.5 million youth are arrested.2 More than 54,000 juveniles—disproportionately racial/ethnic minorities—were incarcerated on an average day in 2013.3 Nearly all of these youth eventually return to their communities.
Delinquent youth are at great risk for poor outcomes in adulthood, having limited social support,4 adult guidance,4 educational attainment,5 and cognitive resources.6 The stigma of prior criminality limits opportunities for employment.7 Moreover, the experience of incarceration may impair psychosocial development.8,9
Despite these adversities, some delinquent youth desist from crime, pursue an education, and become employed. However, little is known about positive outcomes among youth after detention. The most comprehensive study—conducted in England—has limited generalizability to addressing health disparities in the United States.10 Investigations conducted in the United States also have limitations. The classic Glueck and Glueck study11–13—conducted in the 1940s—examined a variety of outcomes, but did not include racial/ethnic minorities (now two-thirds of US juvenile detainees3). More recent studies also have unrepresentative samples, examining only serious or adjudicated (convicted) offenders,14–16 who represent a fraction of youth in the juvenile justice system. One study oversampled youth referred to group homes and sentenced to drug treatment, further reducing generalizability.15 Finally, studies have examined outcomes only to the early 20s14–16 and assessed only recidivism and gainful activity.16,17
These omissions are critical. Hispanics, now the largest minority group in the United States,18 are disproportionately confined in a number of states.19 Disproportionate minority confinement especially affects African American males, who comprise approximately 17% of youth in the United States20 but 40% of youth in correctional facilities.21 Data on females are needed because females are a growing proportion of youth in the juvenile justice system, comprising 27.9% of youth processed in juvenile court and 13.6% of incarcerated youth.21 Data on positive outcomes of delinquent youth will inform the development of gender-specific preventive interventions, and address racial/ethnic health disparities.
This is the first comprehensive US study of long-term outcomes of delinquent youth after detention. Using data from the Northwestern Juvenile Project, we examined the achievement of positive outcomes in 8 domains: educational attainment, residential independence, gainful activity, desistance from criminal activity, mental health, abstaining from substance abuse, interpersonal functioning, and parenting responsibility. We examine: (1) prevalence of specific outcomes 5 and 12 years after detention (at median ages 20 and 28 years, respectively), focusing on sex and racial/ethnic differences; (2) overall counts of positive outcomes; and, (3) common patterns of outcomes, using a latent class analysis.
METHODS
An overview appears below. Additional information is available in eMethods and is published elsewhere.22
Sample, Procedures, and Measures
We recruited a stratified random sample of 1829 youth at intake to the Cook County Juvenile Temporary Detention Center (CCJTDC) in Chicago, Illinois, between November 20, 1995, and June 14, 1998. The CCJTDC is used for pretrial detention and for offenders sentenced for fewer than 30 days. Consistent with data on juvenile detainees nationwide,3,23 nearly 90% of detainees at CCJTDC were male; most were racial/ethnic minority youth. To ensure adequate representation of key subgroups, we stratified our sample by sex, race/ethnicity (African American, non-Hispanic white, Hispanic, or other), age (10–13 years or 14–18 years), and legal status (processed in juvenile or adult court). Face-to-face structured interviews were conducted at the detention center in a private area, most within 2 days of intake. The stratified random sample included 1172 males and 657 females (1005 African Americans, 524 Hispanics, 296 non-Hispanic whites, and 4 of other race/ethnicity). At baseline, youth had a median age of 15 years (mean 14.9; SD 1.4 years).
We conducted follow-up interviews at approximately 3, 5, 6, 8, and 12 years after the baseline interview (hereafter referred to as “after detention”) for the entire sample; subsamples were interviewed more frequently. Participants were interviewed whether they lived in the community or in correctional facilities. We present outcomes at 2 time points, which, for simplicity, we refer to as 5 and 12 years after detention. As in our prior work,22 the 5-year time point consists of 1561 (85.3% of 1829) participants interviewed an average of 4.9 years after detention (SD, 0.4; median 4.7 years). The 12-year time point consists of 1519 (83.1% of 1829) participants interviewed an average of 12.3 years after detention (SD, 0.3; median 12.2 years). eTable 1 summarizes demographics and retention at 5 and 12 years after after detention, when participants were median ages 20 and 28 years, respectively Table 1 shows definitions and measures for the 8 positive outcomes at the 5- and 12-year follow-ups.
Table 1.
Definitions and Measures of Positive Outcome by Domain
| Domain | 5-Year Follow-up (Median Age, 20.5 years) |
12-Year Follow-up (Median Age, 27.9 years) |
Measure |
|---|---|---|---|
| Educational Attainment | High school degree (or equivalent) | High school degree (or equivalent) | Diagnostic Interview Schedule IV51 |
| Gainful Activity* | Currently in school or employed at least 20 hours a week | Currently in school or employed at least 35 hours a week | Multisite Epidemiologic Catchment Area Study52 |
| Desistance From Criminal Activity* | No detected or undetected criminal offenses (past 3 months), no arrests (past 1.5 years), and no incarcerations (past year) | No detected or undetected criminal offenses (past 3 months), no arrests (past year), and no incarcerations (past year) | Denver Youth Survey53; NIDA Risk Behavior Assessment54 Correctional records from the Illinois Department of Corrections adult and youth divisions, the Cook County Department of Corrections, the Cook County Juvenile Temporary Detention Center, and the Clerk of the Court of Cook County supplemented by self-report. |
| Interpersonal Functioning* | Neither a victim nor perpetrator of domestic violence (past 3 months) and no more than minimal impairment on a “behavior towards others” scale (past 3 months) | Neither a victim nor perpetrator of domestic violence (past 3 months), ≥2 people in social support network, and relationship rated 7+ (on a scale of 1–10; if they currently have a spouse or live-in partner) | National Violence Against Women Survey55; National Comorbidity Survey Replication56; Indiana Consortium for Mental Health Service and Research Central State Hospital Discharge Study57; Child and Adolescent Functional Assessment Scale58 |
| Parenting Responsibility* | Biological parent who (with or without a partner) cares for his/her child(ren); has not left a child <6 years unattended nor had a child removed by the state (past 1.5 years); and has no more than minimum impairment on a “youth as caregiver” scale (past 3 months) | Biological parent who (with or without a partner) cares for his/her child(ren) and has not had a child removed by the state (past 4 years) | Child and Adolescent Functional Assessment Scale58; Questions on removal of children by the state were created for the Northwestern Juvenile Project |
| Residential Independence* | Not transient or homeless (past 3 months) | Lives independently, either self-supporting or currently with a partner | Multisite Epidemiologic Catchment Area Study52 |
| Mental Health | No psychotic, mood, anxiety, or behavioral disorders (past year) | No psychotic, mood, anxiety, or behavioral disorders (past year) | Diagnostic Interview Schedule for Children IV59; Diagnostic Interview Schedule IV51; World Mental Health Composite International Diagnostic Interview60 |
| Abstaining From Substance Abuse | No substance use disorder (past year), no illicit drug use (past 30 days), and, if <21 years, no drinking (past 30 days) | No substance use disorder (past year) and no illicit drug use (past 30 days) | Diagnostic Interview Schedule IV51; NIDA Risk Behavior Assessment54 |
Participants incarcerated during the referenced time period were automatically coded as not having achieved this outcome.
Statistical Analysis
All analyses were conducted using STATA statistical software, version 12 (StataCorp) with its survey routines. To generate prevalence estimates and inferential statistics that reflect CCJTDC’s population, each participant was assigned a sampling weight augmented with a nonresponse adjustment to account for missing data. Because minorities are disproportionately incarcerated, weighted estimates for males and females overall are similar to those for African American males and females.
We present prevalence estimates for participants who were still living at follow-up. (Five and 12 years after detention, 50 and 97 participants had died, respectively.) Because incarceration prevents people from achieving many positive outcomes, we also present prevalence only for participants living in the community during the recall period (see eMethods). We used logistic regression to examine sex and racial/ethnic differences in outcomes, adjusting for age at detention and legal status. We used the Latent Class Analysis Stata plugin24 to empirically identify “classes” of participants who exhibited similar patterns of positive outcomes 12 years after detention. Three participants who self-identified as “other” race/ethnicity were excluded from all analyses. We conducted separate analyses for males and females because combining them could obfuscate important differences.
RESULTS
Prevalence of Positive Outcomes in Specific Domains
Figure 1 illustrates sex differences 5 and 12 years after detention. For each positive outcome, Figure 1 shows prevalence among males, prevalence among females, and the corresponding odds ratios and 95% confidence intervals (CI) comparing females with males. Figures 2–3 show racial/ethnic differences in positive outcomes among males and females, respectively (see also eTables 2–4). eFigures 1 and 2 show the prevalence of achieving positive outomes at both time points (see also eTable 5).
Figure 1. Prevalence of Positive Outcomes 5 and 12 Years After Detention: Sex Differences.
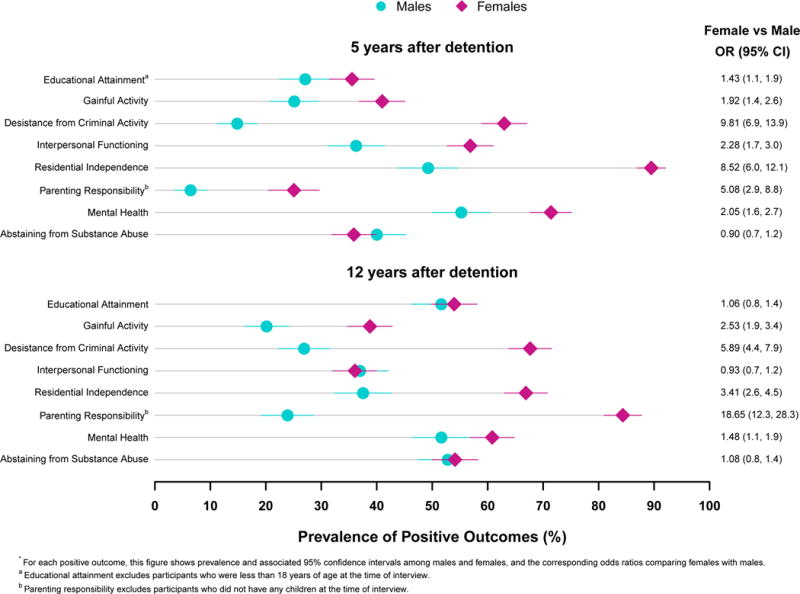
For each positive outcome, the figure shows prevalence among males (circles) and females (diamonds), and the associated 95% confidence intervals (colored lines). Odds ratios comparing females with males are shown in the right column.
Figure 2. Prevalence of Positive Outcomes 5 and 12 Years After Detention Among Males: Racial/Ethnic Differences.
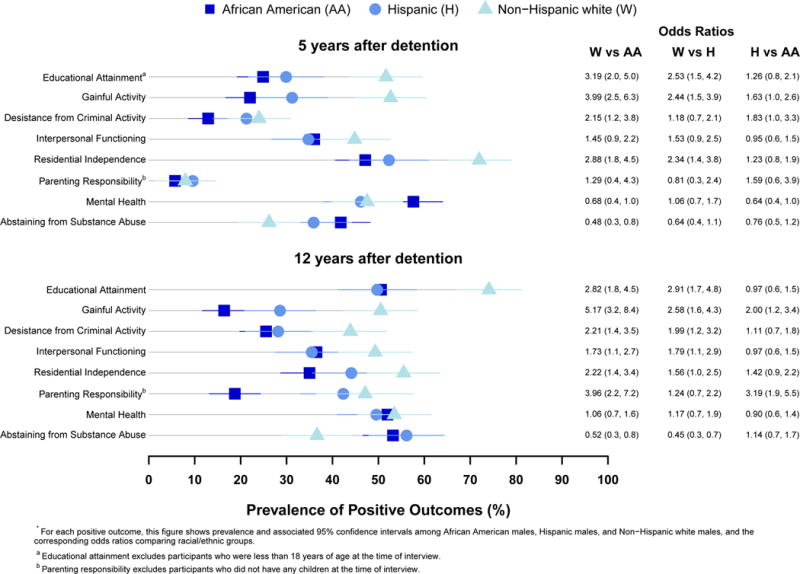
For each positive outcome, the figure shows prevalence among African American males (squares), Hispanic males (circles), and non-Hispanic white males (triangles), and the associated 95% confidence intervals (colored lines). Odds ratios comparing racial/ethnic groups among males are shown in the right column.
Figure 3. Prevalence of Positive Outcomes 5 and 12 Years After Detention Among Females: Racial/Ethnic Differences.
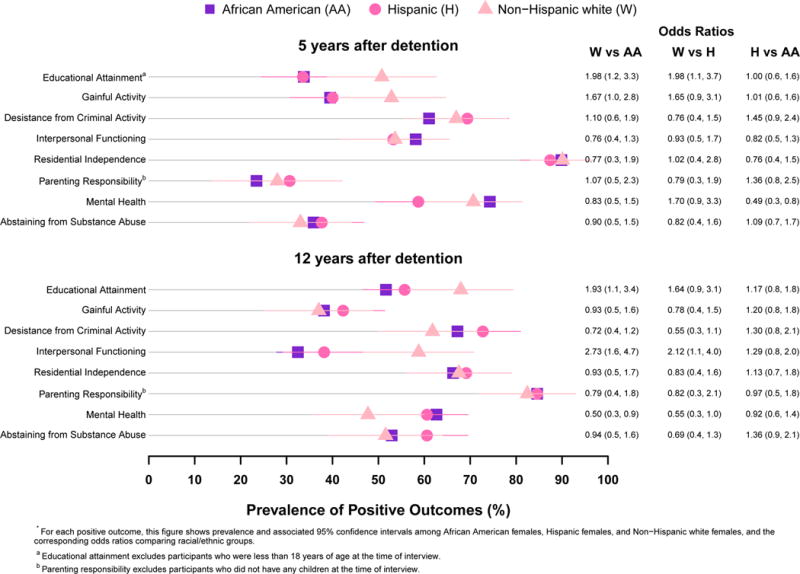
For each positive outcome, the figure shows prevalence among African American females (squares), Hispanic females (circles), and non-Hispanic white females (triangles), and the associated 95% confidence intervals (colored lines). Odds ratios comparing racial/ethnic groups among females are shown in the right column.
Sex Differences
Five years after detention, females were more likely than males to have positive outcomes in every domain except abstaining from substance abuse; the largest sex differences were in desistance from criminal activity, residential independence, and parenting responsibility. Twelve years after detention, there were fewer sex differences; females, however, were still more likely than males to have most positive outcomes. Notably, two-thirds of females had desisted from criminal activity compared with one-quarter of males; more than three-quarters of females had a positive outcome in parenting responsibility compared with less than one-quarter of males. Females were more likely than males to have positive outcomes at both time points for educational attainment, desistance from criminal activity, interpersonal functioning, residential independence, parenting responsibility, and mental health.
Racial/Ethnic Differences
Males
Non-Hispanic whites were more likely than African Americans and Hispanics to have positive outcomes in many domains, especially at the 12-year follow-up (Figure 2). For example, 12 years after detention, non-Hispanic whites had more than 5 times the odds of gainful activity than African Americans and more than 2 times the odds of Hispanics. However, African Americans and Hispanics were more likely to be abstaining from substance abuse compared with non-Hispanic whites.
Females
There were far fewer racial/ethnic differences among females at either time point (Figure 3). Notably, as with males, non-Hispanic whites had greater odds of educational attainment than minorities.
Positive Outcomes Among Persons Living in the Community
Because incarceration prevents people from achieving some of the outcomes assessed (Table 1), we also examined sex and racial/ethnic differences only among participants who lived in the community during the entire recall period. Findings were substantially similar (eMethods).
Counts of Positive Outcomes
eFigure 3 shows sex differences in the total counts of positive outcomes 5 and 12 years after detention. The number of positive outcomes increased only modestly between 5 and 12 years (eTable 6). Twelve years after detention, 21.9% of males and 54.7% of females had achieved more than half of the outcomes (5 or more); only 1 in 10 males and one-third of females had achieved 6 or more positive outcomes. At both time points, females had more positive outcomes than males: at 5 years, the mean difference was 1.6 (95% CI, 1.3–1.8); at 12 years, 1.5 (95% CI, 1.2–1.7).
eFigures 4 and 5 show racial/ethnic differences in the total counts of positive outcomes for males and females, respectively. Among males 12 years after detention, nearly 1 in 2 non-Hispanic whites had achieved more than half of the outcomes, compared with only 1 in 4 Hispanics and only 1 in 5 African Americans. Non-Hispanic white males had more positive outcomes than minority males: at 5 years, the mean difference was 1.0 (95% CI, 0.7–1.4) versus African Americans and 0.9 (95% CI, 0.5–1.3) versus Hispanics. At 12 years, the differences were 1.3 (95% CI, 0.9–1.6) and 0.9 (95% CI, 0.5–1.3), respectively. Among females, there were no significant racial/ethnic differences.
Patterns of Positive Outcomes
We used latent class analyses to empirically identify “classes” of participants who exhibited similar patterns of positive outcomes 12 years after detention. Table 2 shows the percentage of participants in each class for males and females, the probability of attaining a particular positive outcome in each class, and the racial/ethnic distribution and incarceration characteristics of each class. Among males, we found 5 classes: (1) poor overall functioning (24.4%): unlikely to have positive outcomes in any domain; (2) incarcerated (28.1%): positive outcome in only 1 domain, abstaining from substance abuse; (3) living independently but struggling (20.7%): positive outcomes in only 1 domain, residential independence; (4) family men but struggling (5.9%): high probability of achieving interpersonal functioning, parenting responsibility, and abstaining from substance abuse; and (5) functioning independently (21.0%): likely to attain positive outcomes in nearly all domains. Among males who had been incarcerated in the past year, 81.0% were in the poorest functioning classes (Classes 1–3) (Table 2). Minorities—especially African Americans—were overrepresented in the classes with the fewest positive outcomes (Classes 1–3) (eTable 7).
Table 2.
| Assigned Label | Latent Class for Males (n = 933)
|
Latent Class for Females (n = 574)
|
|||||||
|---|---|---|---|---|---|---|---|---|---|
| Class 1 | Class 2 | Class 3 | Class 4 | Class 5 | Class 1 | Class 2 | Class 3 | Class 4 | |
|
Poor Overall Functioning |
Incarcerated |
Living Independently but Struggling |
Family Men, but Struggling |
Functioning Independently |
Unstable Moms |
Substance Free but Struggling |
At-Home Moms |
Positive Overall Functioning |
|
|
|
|
||||||||
| % in Latent Class | 24.4 | 28.1 | 20.7 | 5.9 | 21.0 | 14.4 | 10.1 | 59.9 | 15.6 |
|
|
|
||||||||
| Conditional Probability of a Positive Outcome (%)* | |||||||||
| Educational attainment | 37.9 | 52.1 | 45.7 | 52.5 | 73.7 | 35.8 | 46.9 | 53.7 | 76.7 |
| Gainful activity | 4.8 | 0.3 | 26.4 | 7.0 | 63.5 | 12.2 | 14.7 | 35.4 | 91.2 |
| Desistance from criminal activity | 16.7 | 0.9 | 22.6 | 8.7 | 84.8 | 9.5 | 28.8 | 79.9 | 99.4 |
| Interpersonal functioning | 43.4 | 4.3 | 42.7 | 98.5 | 50.3 | 37.1 | 7.7 | 38.4 | 44.9 |
| Residential independence | 1.6 | 1.8 | 86.9 | 57.7 | 72.5 | 45.8 | 17.6 | 76.2 | 82.6 |
| Parenting responsibility | 0.2 | 0.0 | 44.7 | 70.7 | 41.8 | 60.0 | 29.4 | 96.9 | 88.2 |
| Mental health | 30.5 | 58.9 | 31.4 | 45.2 | 87.1 | 30.1 | 48.3 | 60.5 | 98.2 |
| Abstaining from substance abuse | 28.5 | 99.0 | 0.9 | 95.3 | 59.4 | 1.2 | 79.5 | 55.6 | 79.8 |
| Prevalence Across Class (%)c,d | |||||||||
| Incarceration | |||||||||
| None | 21.0 | 1.5 | 27.9 | 2.4 | 47.2 | 9.9 | 6.0 | 65.7 | 18.4 |
| Any incarceration | 26.7 | 46.1 | 8.3 | 15.8 | 3.2 | 39.2 | 33.2 | 27.4 | 0.2 |
| In/out | 35.7 | 21.8 | 24.7 | 12.9 | 4.9 | 44.1 | 25.9 | 29.9 | 0.2 |
| Entire past year | 10.9 | 88.6 | 0.1 | 0.1 | 0.3 | 4.7 | 85.0 | 10.3 | 0.0 |
| Race/ethnicity | |||||||||
| African American | 26.2 | 29.4 | 19.4 | 5.9 | 19.1 | 15.1 | 10.3 | 58.8 | 15.8 |
| Hispanic | 17.5 | 27.6 | 24.4 | 6.4 | 24.1 | 10.2 | 10.1 | 63.3 | 16.4 |
| Non-Hispanic white | 18.4 | 10.4 | 27.5 | 3.9 | 39.9 | 16.7 | 8.3 | 62.1 | 12.9 |
To facilitate interpretation, bolding indicates probability of a positive outcome ≥ 60%.
Latent class models are weighted to adjust for sampling design and to reflect the demographic characteristics of the Cook County Juvenile Temporary Detention Center.
The 5-class model for males minimized adjusted BIC (4-class = 551.2; 5-class = 527.3; 6-class = 528.7), had reasonable entropy (4-class = 0.68; 5-class = 0.72; 6-class = 0.74), and provided the most interpretable groups. Although a 3-class model for females minimized the adjusted BIC (3-class = 319.0; 4-class = 325.2; 5-class = 342.2), the 4-class model had substantially better entropy (3-class = 0.51; 4-class = 0.66; 5-class = 0.61) and yielded more meaningful groups.
Prevalence across latent classes sum over each characteristic. For example, 26.2% of African American males are in Poor Overall Functioning, 29.4% are in Incarcerated, 19.4% are in Living Independently but Struggling, 5.9% are in Family Men, but Struggling, and 19.1% are in Functioning Independently.
Percentages across rows may not sum to 100% due to rounding error.
Among females, we found 4 classes: (1) unstable moms (14.4%): positive outcomes in only 1 domain: parenting responsibility; (2) substance free but struggling (10.1%): positive outcomes in only 1 domain: abstaining from substance abuse; (3) at-home moms (59.9%): especially likely to be positive in parenting responsibility, desistance from criminal activity, and residential independence, but unlikely to have gainful activity or interpersonal functioning; and (4) positive overall functioning (15.6%): likely to have positive outcomes in every domain except interpersonal functioning. Among females who had been incarcerated in the past year, 72.4% were in the poorest functioning classes (Classes 1 and 2) (Table 2). There were no racial/ethnic differences (see eTable 7).
DISCUSSION
Twelve years after detention, only 1 in 5 males and nearly 1 in 2 females had attained positive outcomes in more than half of the domains assessed, which included gainful activity, educational attainment, interpersonal functioning, and parenting responsibility. Moreover, the numbers of positive outcomes increased only slightly between late adolescence and young adulthood. The socioeconomic picture was bleak. Only half of our participants had a high school degree or its equivalent, rates substantially lower than among comparably aged persons nationwide (88.4%).25,26 Only one-fifth of males and approximately one-third of females in our sample were working full time or in school. In contrast, 77% of the general population is socioeconomically self-sufficient by 29 to 30 years of age27; in one study, 67% of males and 52% of females, aged 22 to 32 years, were employed full-time in 2011–2013.28
This study is the first to document the dearth of long-term positive outcomes in multiple domains among delinquent youth after detention. Outcomes are even worse than those found by Ramchand and colleagues,15 who found that 7 years later (ages 20–24 years), 58% of serious offenders sampled from group homes had completed high school or its equivalent, and 32% were employed full time.
Why do females function substantially better than males in nearly every domain? First, delinquency among females is largely confined to adolescence.29 Even in the general population, males are more likely than females to have static and enduring risk factors for delinquent behavior, such as nervous system dysfunctions, difficult temperaments, delayed achievement of verbal and motor milestones, and hyperactivity.29,30 Males’ more extensive involvement with correctional systems during the transition to adulthood limits opportunities to achieve adult roles, such as employment.
Second, delinquent females are more likely than males to be involved in prosocial activities and relationships.31 Prosocial involvement, including parenting, is critical to positive functioning. In our study, females were over 18 times more likely to be parenting their children than males.
The latent class analysis demonstrated that African American males fared the worse, with lives characterized by incarceration, criminal activity, and few positive outcomes. Hispanic males functioned more poorly overall than non-Hispanic white males. Racial/ethnic disparities among delinquent youth appear to be even greater than disparities in the general population.32 The cycle of disadvantage may be most profound for racial/ethnic minorities,33 who have fewer resources and opportunities to fulfill adult responsibilities.
Limitations
Our data are subject to the limitations of self-report. Generalizability may be limited to youth in urban detention centers with similar sociodemographic characteristics. We did not control for social class because nearly all youth who enter detention are poor. Participants lost to follow-up may have biased the sample. Of course, we could not examine the outcomes of deceased participants; however, including them in computations (defined as negative on all outcomes) did not alter findings substantially (see eMethods). Outcome data are a snapshot of functioning at 2 time points. Although counts of positive outcomes provide a useful summary of overall functioning, their utility is limited because it gives equal weight to each outcome. We likely overestimated residential independence at 12 years because we were unable to determine the number of “householders” in our sample as defined by the US Census Bureau (whether participants’ residences were legally in their name).34 To define gainful activity, we followed the decision rules set forth by the US Department of Labor that defines full-time homemakers as unemployed. Although homemakers would not score a positive outcome in this category, they could score as positive in “parenting responsibility.” Note that although this decision could make females appear to have worse outcomes, they actually had better outcomes than males. Finally, detention is the outcome of multiple risk factors and developmental processes. We cannot determine that detention caused poor outcomes independently of those risk factors.
Implications
1. Expand the scope of services for delinquent youth, focusing on minority males
Our findings demonstrate that programs must be improved for males, who, based on US Department of Justice statistics, comprise 72% of cases handled by juvenile courts35 and 86% of youth in residential placement.3 Although re-entry programs that focus on reducing criminal recidivism are critical for public safety, other needs of delinquent youth must be addressed. To improve outcomes, pediatric health care professionals should recognize the importance of psychosocial health, facilitate access to services in the community, and partner with on-site systems of care.36 Programs are most effective when they implement services flexibly, based on individual need and developmental stage.4
Providing services for delinquent males is challenging. Compared with females, males may be less amenable to intervention for delinquent behavior; they generally have lower levels of interpersonal agreeableness,30 greater susceptibility to deviant peer influence,37 and, in many cases, longer histories of oppositional behavior and aggression.38 Moreover, adolescent males are less likely than females to seek mental health services,39 and their mental health needs are less likely to be detected in correctional settings.40 Racial/ethnic minorities are even less likely to receive services than non-Hispanic whites.41
Despite these challenges, expanding services may improve the outcomes of many racial/ethnic minority males who have been incarcerated. The potential impact cannot be overstated. The US Department of Justice estimates that among infants born in 2001, 1 in 3 African American males and 1 in 6 Hispanic males will be incarcerated in a state or federal prison at some point during their lifetime.42
2. Support policies that reduce the collateral consequences of criminal records
Delinquent youth have many risk factors that reduce the likelihood of positive outcomes.4–6 However, involvement with the justice system presents additional obstacles to positive outcomes as youth—especially minorities—age. First, delinquent youth may find it difficult to return to school after release. Many have cognitive deficits6 and low expectations of success.43 Delinquent youth—particularly minorities—experience harsher disciplinary actions than nondelinquent peers.44,45 Punitive discipline may have the unintended consequence of increasing delinquency and fostering the “school-to-prison pipeline.”46 Second, use of criminal records to make employment decisions impedes hiring of ex-offenders. Finally, in many states, convicted felons may be banned from voting, public housing, college/university admissions, child custody, and public aid.47,48 Convicted felons may also be barred from certain occupations, including working in health care facilities, insurance agencies, hair-dressing, and cosmetology.49 These consequences increase the likelihood of recidivism.50
Conclusions
Positive adult outcomes are the exception and not the rule, particularly for racial/ethnic minorities. To succeed, delinquent youth must be helped not only to desist from crime but also to overcome barriers to social stability and employment.
Supplementary Material
Acknowledgments
This work was supported by National Institute on Drug Abuse grants R01DA019380, R01DA022953, and R01DA028763, National Institute of Mental Health grants R01MH54197 and R01MH59463 (Division of Services and Intervention Research and Center for Mental Health Research on AIDS) and grants 1999-JE-FX-1001, 2005-JL-FX-0288 and 2008-JF-FX-0068 from the Office of Juvenile Justice and Delinquency Prevention. Major funding was also provided by the National Institute on Alcohol Abuse and Alcoholism, the NIH Office of Behavioral and Social Sciences Research, Substance Abuse and Mental Health Services Administration (Center for Mental Health Services, Center for Substance Abuse Prevention, Center for Substance Abuse Treatment), the NIH Center on Minority Health and Health Disparities, the Centers for Disease Control and Prevention (National Center for Injury Prevention and Control and National Center for HIV/AIDS, Viral Hepatitis, STD and TB Prevention), the NIH Office of Research on Women’s Health, the NIH Office of Rare Diseases, Department of Labor, Department of Housing and Urban Development, The William T. Grant Foundation, and The Robert Wood Johnson Foundation. Additional funds were provided by The John D. and Catherine T. MacArthur Foundation, The Open Society Institute, and The Chicago Community Trust. No funding source had a role in the design and conduct of the study; collection, management, analysis, and interpretation of the data; preparation, review, or approval of the manuscript; or decision to submit the manuscript for publication.
Celia Fisher, Ph.D, provided invaluable advice on the project. Zaoli Zhang, M.S., and Lynda Carey, M.A. provided data assistance (staff). We thank our participants for their time and willingness to participate, as well as the Cook County Juvenile Temporary Detention Center, Cook County Department of Corrections, and Illinois Department of Corrections for their cooperation. We also thank Cathy Widom, Ph.D., (compensated) and Wes Skogan, Ph.D., for their helpful comments on the manuscript.
Footnotes
No author has financial relationships to disclose that are relevant to this manuscript or other conflicts of interest to disclose.
Specific author contributions:
Study concept and design: Abram, Teplin, Azores-Gococo, Emanuel, Rosenbaum
Acquisition, analysis, or interpretation of data: All authors
Drafting of the manuscript: Abram, Teplin, Azores-Gococo, Emanuel, Welty, Aaby
Critical revision of the manuscript for important intellectual content: All authors.
Final approval of version to be published: All authors.
Agreement to be accountable for all aspects of the work in ensuring that questions related to the accuracy or integrity of any part of the work are appropriately investigated and resolved: All authors
Statistical analysis: Welty, Aaby, Azores-Gococo, Emanuel
Obtained funding: Teplin, Abram, Welty
Study supervision: Abram, Teplin
Dr. Teplin had full access to all of the data in the study and takes responsibility for the integrity of the data and the accuracy of the data analysis.
References
- 1.International Centre for Prison Studies. Highest to Lowest - Prison Population Rate. [Online]. http://www.prisonstudies.org/highest-to-lowest/prison_population_rate?field_region_taxonomy_tid=All. Accessed July 15, 2015.
- 2.Arrest in the United States, 1980–2011. Bureau of Justice Statistics; 2013. http://www.bjs.gov/index.cfm?ty=datool&surl=/arrests/index.cfm#. Accessed Oct. 21, 2013. [Google Scholar]
- 3.Easy Access to the Census of Juveniles in Residential Placement. National Center for Juvenile Justice. 2015 http://www.ojjdp.gov/ojstatbb/ezacjrp/ Accessed October 14, 2015.
- 4.Anthony EK, Samples MD, de Kervor DN, Ituarte S, Lee C, Austine MJ. Coming back home: The reintegration of formerly incarcerated youth with service implications. Children and Youth Services Review. 2010;32:1271–1277. [Google Scholar]
- 5.Kirk DS, Sampson RJ. Juvenile Arrest and Collateral Educational Damage in the Transition to Adulthood. Sociology of Education. 2013;86:36–61. doi: 10.1177/0038040712448862. [DOI] [PMC free article] [PubMed] [Google Scholar]
- 6.Lansing AE, Washburn JJ, Abram KM, Thomas UC, Welty LJ, Teplin LA. Cognitive and academic functioning of juvenile detainees: Implications for correctional populations and public health. Journal of Correctional Health Care. 2014;20(1):18–30. doi: 10.1177/1078345813505450. [DOI] [PMC free article] [PubMed] [Google Scholar]
- 7.Wiesner M, Kim HK, Capaldi DM. History of Juvenile Arrests and Vocational Career Outcomes for At-Risk Young Men. Journal of Research in Crime & Delinquency. 2010;47(1):91–117. doi: 10.1177/0022427809348906. [DOI] [PMC free article] [PubMed] [Google Scholar]
- 8.Dmitrieva J, Monahan KC, Cauffman E, Steinberg L. Arrested development: the effects of incarceration on the development of psychosocial maturity. Dev Psychopathol. 2012;24(3):1073–1090. doi: 10.1017/S0954579412000545. [DOI] [PubMed] [Google Scholar]
- 9.Steinberg L, Chung HL, Little M. Reentry of young offenders from the justice system: A developmental perspective. Youth Violence Juv. Justice. 2004;2(1):21–38. doi: 10.1177/1541204003260045. [DOI] [PMC free article] [PubMed] [Google Scholar]
- 10.Nagin DS, Farrington DP, Moffitt T. Life-course trajectories of different types of offenders. Criminology. 1995;33(1):111–139. [Google Scholar]
- 11.Sampson RJ, Laub JH. Crime in the making : pathways and turning points through life. Cambridge, Mass: Harvard University Press; 1993. [Google Scholar]
- 12.Laub JH, Nagin DS, Sampson RJ. Trajectories of change in criminal offending: good marriages and the desistance process. American Sociological Review. 1998;63:225–238. [Google Scholar]
- 13.Glueck S, Glueck E. Delinquents and Nondelinquents in Perspective. Cambridge, Massachusetts: Harvard University Press; 1968. [Google Scholar]
- 14.Monahan KC, Steinberg L, Cauffman E, Mulvey EP. Trajectories of Antisocial Behavior and Psychosocial Maturity From Adolescence to Young Adulthood. Dev Psychol. 2009;45(6):1654–1668. doi: 10.1037/a0015862. [DOI] [PMC free article] [PubMed] [Google Scholar]
- 15.Ramchand R, Morral AR, Becker K. Seven-year life outcomes of adolescent offenders in Los Angeles. Am J Public Health. 2009;99(5):863–870. doi: 10.2105/AJPH.2008.142281. [DOI] [PMC free article] [PubMed] [Google Scholar]
- 16.Schubert CA, Mulvey EP, Glasheen C. Influence of mental health and substance use problems and criminogenic risk on outcomes in serious juvenile offenders. J Am Acad Child Adolesc Psychiatry. 2011;50(9):925–937. doi: 10.1016/j.jaac.2011.06.006. [DOI] [PubMed] [Google Scholar]
- 17.Iselin A-MR, Mulvey EP, Loughran TA, Chung HL, Schubert CA. A longitudinal examination of serious adolescent offenders’ perceptions of chances for success and engagement in behaviors accomplishing goals. Journal of Abnormal Child Psychology. 2012;40(2):237–249. doi: 10.1007/s10802-011-9561-z. [DOI] [PMC free article] [PubMed] [Google Scholar]
- 18.Brown A, Lopez MH. Mapping the Latino Population, By State, County, and City. Washington, D.C: Pew Research Center’s Hispanic Trends Project; Aug 29, 2013. [Google Scholar]
- 19.Kempf-Leonard K. Minority Youths and Juvenile Justice: Disproportionate Minority Contact After Nearly 20 Years of Reform Efforts. Youth Violence and Juvenile Justice. 2007;5:71–86. [Google Scholar]
- 20.Easy Access to Juvenile Populations: 199–2012. 2013 http://www.ojjdp.gov/ojstatbb/ezapop/. Accessed February 1, 2015.
- 21.Easy Access to the Census of Juveniles in Residential Placement. 2013 http://www.ojjdp.gov/ojstatbb/ezacjrp/. Accessed October 1, 2014.
- 22.Teplin LA, Welty LJ, Abram KM, Dulcan MK, Washburn JJ. Prevalence and persistence of psychiatric disorders in youth after detention: a prospective longitudinal study. Arch Gen Psychiatry. 2012;69(10):1031–1043. doi: 10.1001/archgenpsychiatry.2011.2062. [DOI] [PMC free article] [PubMed] [Google Scholar]
- 23.Snyder HN, Sickmund M. Juvenile Offenders and Victims: 2006 National Report. Washington, DC: U.S Department of Justice, Office of Justice Programs, Office of Juvenile Justice and Delinquency Prevention; 2006. [Google Scholar]
- 24.LCA Stata Plugin [Software] [computer program] University Park: The Methodology Center, Penn State; 2014. [Google Scholar]
- 25.U.S. Census Bureau. Table 231 Educational Attainment by Selected Characteristics: 2010 Statistical Abstract of the United States. U.S. Department of Commerce, United States Census Bureau; 2012. [Google Scholar]
- 26.State and County QuickFacts. Data derived from Population Estimates, American Community Survey, Census of Population and Housing, County Business Patterns, Economic Census, Survey of Business Owners, Building Permits, Census of Governments. U.S. Census Bureau; 2015. http://quickfacts.census.gov/qfd/states/17/1714000.html. Accessed October 16, 2015. [Google Scholar]
- 27.Massoglia M, Uggen C. Settling Down and Aging Out: Toward an Interactionist Theory of Desistance and the Transition to Adulthood. American Journal of Sociology. 2010;116(2):543–582. doi: 10.1086/653835. [DOI] [PMC free article] [PubMed] [Google Scholar]
- 28.Public Use Microdata Sample. U.S. Census Bureau’s American Community Survey Office. 2015 http://www2.census.gov/acs2013_3yr/. Accessed November 6, 2015.
- 29.Moffitt TE. A Review of Research on the Taxonomy of Life-Course Persistent Versus Adolescence-Limited Antisocial Behavior. In: Cullen FT, Wright JP, Blevins KR, editors. Taking Stock: The Status of Criminological Theory. New Brunswick: Transaction Publishers; 2006. pp. 278–309. [Google Scholar]
- 30.Vecchione M, Alessandri G, Barbaranelli C, Caprara G. Gender differences in the Big Five personality development: A longitudinal investigation from late adolescence to emerging adulthood. Personality and Individual Differences. 2012;53:740–746. [Google Scholar]
- 31.Giordano PC, Cernkovich SA, Rudolph JL. Gender, crime, and desistance: toward a theory of cognitive transformation. American Journal of Sociology. 2002;107:990–1064. [Google Scholar]
- 32.Bureau of Labor Statistics. Household Data Annual Averages, 3. Employment status of the civilian noninstitutional population by age, sex, and race. Labor Force Statistics from the Current Population Survey. United States Department of Labor; 2014. [Google Scholar]
- 33.Decker SH, Spohn C, Ortiz NR. Criminal Stigma, Race, Gender, and Employment: An Expanded Assessment of the Consequences of Imprisonment for Employment. National Instiutute of Justice; 2010. [Google Scholar]
- 34.Vespa J, Lewis JM, Kreider RM. America’s Families and Living Arrangements: 2012. Washington, D.C: U.S. Department of Commerce, Economics and Statistics Administration, U.S. Census Bureau; 2013. [Google Scholar]
- 35.Easy Access to Juvenile Court Statistics: 1985–2011. 2014 NCJJ [producer] http://www.ojjdp.gov/ojstatbb/ezajcs/. Accessed October 14, 2015.
- 36.Tolan P, Dodge K. Children’s mental health as a primary care and concern. American Psychologist. 2005;60(6):601–614. doi: 10.1037/0003-066X.60.6.601. [DOI] [PMC free article] [PubMed] [Google Scholar]
- 37.Heinze HJ, Toro PA, Urberg KA. Antisocial Behavior and Affiliation With Deviant Peers. Journal of Clinical Child and Adolescent Psychology. 2004;33(2):336–346. doi: 10.1207/s15374424jccp3302_15. [DOI] [PubMed] [Google Scholar]
- 38.Kokko K, Pulkkinen L, Huesmann LR, Dubow EF, Boxer P. Intensity of Aggression in Childhood as a Predictor of Different Forms of Adult Aggression: A Two-Country(Finland and the United States) Analysis. Journal of Research on Adolescence. 2009;19(1):9–34. doi: 10.1111/j.1532-7795.2009.00579.x. [DOI] [PMC free article] [PubMed] [Google Scholar]
- 39.Ojeda VD, McGuire TG. Gender and Racial/Ethnic Differences in Use of Outpatient Mental Health and Substance Use Services by Depressed Adults. Psychiatric Q. 2006;77:211–222. doi: 10.1007/s11126-006-9008-9. [DOI] [PubMed] [Google Scholar]
- 40.Teplin LA, Abram KM, McClelland GM, Washburn JJ, Pikus AK. Detecting mental disorder in juvenile detainees: Who receives services. American Journal of Public Health. 2005;95(10):1773–1780. doi: 10.2105/AJPH.2005.067819. [DOI] [PMC free article] [PubMed] [Google Scholar]
- 41.Alegria M, Greif Green J, McLaughlin KA, Loder S. Disparities in child and adolescent mental health and mental health services in the U.S. A William T. Grant Foundation Inequality Paper. New York: William T. Grant Foundation; 2015. [Google Scholar]
- 42.Bonczar TP. Prevalence of Imprisonment in the U.S. Population, 1974–2001. Washington, D.C: Bureau of Justice Statistics; 2003. Special Report. [Google Scholar]
- 43.Chung HL, Mulvey EP, Steinberg L. Understanding the School Outcomes of Juvenile Offenders: An Exploration of Neighborhood Influences and Motivational Resources. J Youth Adolescence. 2011;40:1025–1038. doi: 10.1007/s10964-010-9626-2. [DOI] [PubMed] [Google Scholar]
- 44.Hjalmarsson R. Criminal justice involvement and high school completion. Journal of Urban Economics. 2008;63:613–630. [Google Scholar]
- 45.Skiba RJ, Horner RH, Chung C, Rausch MK, May SL, Tobin T. Race is not neutral: A national investigation of African American and Latino disproportionality in school discipline. School Psychology Review. 2011;40(1):85–107. [Google Scholar]
- 46.Gonzalez T. Keeping Kids in Schools: Restorative Justice, Punitive Discipline, and the School to Prison Pipeline. Journal of Law & Education. 2012;41(2) [Google Scholar]
- 47.Pogorzelski W, Wolff N, Pan K, Blitz CL. Behavioral Health Problems, Ex-Offender Reentry Policies, and the "Second Chance Act". American Journal of Public Health. 2005;95(10):1718–1724. doi: 10.2105/AJPH.2005.065805. [DOI] [PMC free article] [PubMed] [Google Scholar]
- 48.The Sentencing Project. Felony Disenfranchisement Laws in the United States. Collateral Consequences. Washington, D.C.: The Sentencing Project; 2013. [Google Scholar]
- 49.National Inventory of Collateral Consequences of Conviction, Illinois. American Bar Association; 2013. http://www.abacollateralconsequences.org/search/?jurisdiction=18. Accessed November 1, 2015. [Google Scholar]
- 50.Justice.gov. Attorney General Eric Holder Delivers Remarks on Criminal Justice Reform at Georgetown University Law Center. Justice News. 2014 Apr 11; 2014. http://www.justice.gov/iso/opa/ag/speeches/2014/ag-speech-140211.html Accessed October 15, 2014.
- 51.Robins LN, Cottler LB, Bucholz KK, Compton WM. Diagnostic Interview Schedule for DSM-IV (DIS-IV) St. Louis, MO: Washington University; 1995. [Google Scholar]
- 52.Lahey BB, Flagg EW, Bird HR, et al. The NIMH methods for the epidemiology of child and adolescent mental disorders (MECA) study: background and methodology. Journal of the American Academy of Child & Adolescent Psychiatry. 1996;35(7):855–864. doi: 10.1097/00004583-199607000-00011. [DOI] [PubMed] [Google Scholar]
- 53.Institute of Behavioral Science. Denver Youth Survey Youth Interview Schedule. Boulder: University of Colorado; 1991. [Google Scholar]
- 54.Dowling S, Johnson ME, Fisher DG. Reliability of drug users’ self-reported recent drug use. Assess. 1994;1:382–392. [Google Scholar]
- 55.Tjaden P. Violence and Threats of Violence Against Women in America: Female Questionnaire. Denver, CO: Center for Policy Research; 1996. [Google Scholar]
- 56.National Comorbidity Survey. National Comorbidity Survey: Instruments. 2008 http://www.hcp.med.harvard.edu/ncs/instruments.php. Accessed October 15, 2014.
- 57.Indiana Consortium for Mental Health Services Research. The Central State Hospital Discharge Study. 1994 http://www.indiana.edu/~icmhsr/instruments.html. Accessed Feb. 16, 2015.
- 58.Hodges K. The Child and Adolescent Functional Assessment Scale. Ypsilanti: Department of Psychology, Eastern Michigan University; 1994. [Google Scholar]
- 59.Shaffer D, Fisher P, Lucas C. The Diagnostic Interview Schedule for Children (DISC) In: Hilsenroth MJ, Segal DL, editors. Comprehensive Handbook of Psychological Assessment (Vol. 2) Hoboken, NJ: John Wiley & Sons; 2003. pp. 256–270. [Google Scholar]
- 60.Kessler RC, Üstün TB. The World Mental Health (WMH) survey initiative version of the World Health Organization (WHO) Composite International Diagnostic Interview (CIDI) International Journal of Methods in Psychiatric Research. 2004;13(2):93–121. doi: 10.1002/mpr.168. [DOI] [PMC free article] [PubMed] [Google Scholar]
Associated Data
This section collects any data citations, data availability statements, or supplementary materials included in this article.