

Abstract
The lysosome degrades and recycles macromolecules, signals to the cytosol and nucleus, and is implicated in many diseases. Here we describe a method for the rapid isolation of mammalian lysosomes and use it to quantitatively profile lysosomal metabolites under various cell states. Under nutrient replete conditions, many lysosomal amino acids are in rapid exchange with those in the cytosol. Loss of lysosomal acidification through inhibition of the vacuolar H+ATPase (V-ATPase) increased the luminal concentrations of most metabolites, but had no effect on those of the majority of essential amino acids. Instead, nutrient starvation regulates the lysosomal concentrations of these amino acids, an effect we traced to regulation of the mTOR pathway. Inhibition of mTOR strongly reduced the lysosomal efflux of most essential amino acids, converting the lysosome into a cellular depot for them. These results reveal the dynamic nature of lysosomal metabolites and that V-ATPase- and mTOR-dependent mechanisms exist for controlling lysosomal amino acid efflux.
Lysosomes are membrane-bound organelles best known for their capacity to degrade macromolecules and recycle their constituent metabolites, and for their dysfunction in a group of rare metabolic disorders known as lysosomal storage diseases (1, 2). Lysosomes also participate in signal transduction (3), particularly in nutrient sensing by the mechanistic target of rapamycin complex 1 (mTORC1) pathway (4, 5), and are often deregulated in common diseases, such as cancer (6). Given the critical roles of lysosomes in producing and sensing many metabolites, a better understanding of lysosomal function requires uncovering its metabolite content, and its regulation in diverse cell states.
Traditional techniques for purifying lysosomes, such as density-based centrifugation, are too slow to preserve what is likely a labile lysosomal metabolome (“lysobolome”). To overcome this issue, we used insights from a recently reported method for the rapid isolation of mitochondria (7) to develop an analogous approach for lysosomes. Our “LysoIP” method uses anti-human Influenza virus hemagglutinin (HA) magnetic beads to immunopurify lysosomes from human embryonic kidney (HEK-293T) cells expressing transmembrane Protein 192 (TMEM192) fused to three tandem HA-epitopes (HA-Lyso cells) (Fig. 1A and B). TMEM192 is a transmembrane protein (8) that we find retains its lysosomal localization upon overexpression better than other such proteins, like lysosomal-associated membrane protein 1 (LAMP1). Starting with live cells, it takes ~10 minutes to isolate lysosomes that are highly pure and intact, as judged by the absence of markers for other cellular compartments (Fig. 1C), retention of Cathepsin D activity (Fig. 1D), and capacity to take up radiolabeled arginine in vitro (Fig. 1E). Moreover, tracking of either a lysosomal membrane protein (LAMP2), a luminal protein (Cathepsin D), or a small molecule (LysoTracker Red), yielded the same value for the fraction of total cellular lysosomes purified (Fig. 1F), indicating that the lysosomes do not leak soluble contents during the purification. Importantly, the LysoIP method uses buffers compatible with subsequent analyses of the lysosomal metabolome by liquid chromatography and mass spectrometry (LC/MS).
Fig. 1. LysoIP method for rapid immunoisolation of intact lysosomes for absolute quantification of their metabolite content.
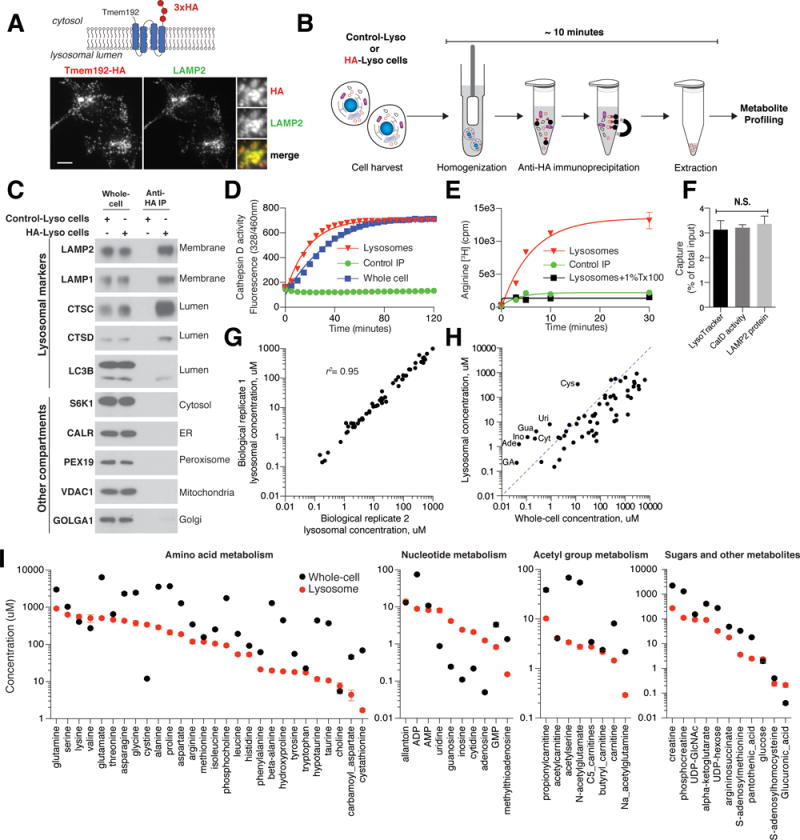
A) Localization of Tmem192-3xHA fusion protein to lysosomes. Tmem192-3xHA and lysosomes were detected by immunofluorescence with antibodies to the HA epitope tag and the lysosomal marker LAMP2, respectively. Scale bars, 10 μm. Insets represent selected fields that were magnified 3.24X.
B) Schematic of the workflow for the LysoIP method. Control-Lyso and HA-Lyso cells refer to cells stably expressing 2xFlag-tagged TMEM192 or 3xHA-tagged Tmem192, respectively.
C) The LysoIP method isolates pure lysosomes. Immunoblotting for protein markers of various subcellular compartments in whole cell (whole-cell) lysates, purified lysosomes, or control immunoprecipitates. Lysates were prepared from cells expressing the 2xFlag-tagged TMEM192 (Control-Lyso cells) or 3xHA-tagged Tmem192 (HA-Lyso cells). ER, endoplasmic reticulum.
D, E and F) Purified lysosomes are intact and retain their contents. (D) Cathepsin D activity was measured in whole-cell lysates and lysosomes, and immunoprecipitates from Control-Lyso cells served as a negative control (Control IP) (mean ± SEM, n=3). (E) Purified lysosomes take up radiolabeled arginine (Arginine [3H]). Lysosomes treated with a detergent were used as a control (mean ± SEM, n=3). (F) Calculations of the amounts of captured lysosomes (mean ± SEM, n=6, p > 0.05, N.S., not significant, ANOVA) were similar whether determined by tracking a membrane protein (LAMP2), the activity of the lysosomal protease cathepsin D (CatD), or a lysosome-specific small molecule (LysoTracker). Data are presented as the fraction of the material in the initial cell lysate.
G) Absolute quantification of lysosomal metabolites. Comparison of concentrations of lysosomal metabolites across two biological replicates, with R-squared value shown.
H) Metabolite concentrations in lysosomes and whole cells. Metabolites above the dotted blue line are enriched in lysosomes. Cys, cystine; Uri, uridine; Gua, guanosine; Ade, adenosine; Cyt, cytidine; Ino, inosine; GA, glucuronic acid.
I) Whole-cell and lysosomal concentrations of 57 metabolites in HEK-293T cells (mean ± SEM, n=5). n indicates the number of independent biological replicates.
Because the metabolite content of human lysosomes is not established, we used LC/MS to determine the relative abundances of ~150 polar small molecules in lysosomes versus control anti-HA immunoprecipitates from cells stably expressing Flag-tagged TMEM192 (Control-Lyso cells) (Fig. S1A and Supplementary Table 1). Of these, 57 were twice as abundant in the isolated lysosomes and thus deemed lysosomal metabolites (Fig. S1A and Supplementary table 1). The lysosomes did not contain metabolites characteristic of other compartments, such as the cytosolic glycolytic intermediates fructose 1,6-bisphosphate and lactate or the mitochondrially-enriched Coenzyme A (7) (Fig. S1B).
We quantified the concentrations of the 57 metabolites in lysosomal and whole-cell samples using standard curves for each and the volumes of lysosomes and intact cells (see methods). Lysosomal metabolite concentrations correlated highly across biological replicates (r2 = 0.95; Fig. 1G) and even with those obtained using the less preferable LAMP1-RFP-3xHA as the lysosomal antigen tag (r2 = 0.95; Fig. S1C), mitigating concerns that expression of TMEM192, whose function is unknown, might have effects on the lysosomal metabolome. In the proliferating cells used in these experiments, the concentrations of metabolites tended to be, with a few exceptions, lower in lysosomes than in whole cells (Fig. 1H,I and Supplementary table 2). Two molecules previously predicted to be stored in lysosomes, cystine (the oxidized dimeric form of cysteine) and glucuronic acid (9, 10), were indeed enriched in lysosomes, with concentrations 28- and 5.5-fold greater than those of whole cells, respectively (Fig. 1H,I and Supplementary table 2). All nucleosides (guanosine, adenine, cytidine, uridine, and inosine) were lysosomally enriched (9 to 25 fold), consistent with the lysosome also being a depot for these metabolites, at least in HEK-293T cells (Fig. 1H,I). The lysosomal concentrations of proteinogenic amino acids varied widely and did not correlate well with those in whole cells (Fig. 1I), suggesting that while some lysosomal amino acids are in equilibrium with the rest of the cell, others are either sequestered in a different compartment or undergo preferred transport out of the lysosome, and thus show higher concentrations in the whole-cell samples. Lysosomes also contained metabolites that are not thought to result from the degradation of macromolecules, and thus are likely transported into lysosomes (Fig. 1I). These include non-proteinogenic amino acids, like beta-alanine (20 uM), taurine (11 uM), and hypotaurine (12 uM); cofactors and vitamins, like choline (7 uM) and phosphocholine (94 uM); creatine (274 uM) and phosphocreatine (111 uM); and multiple species of carnitines (Fig. 1I). The metabolomic landscape of the human lysosome is consistent with its role as a recycling center, but also indicates that the transport of metabolites into lysosomes may influence lysosomal biology more than is widely appreciated.
The multicomponent vacuolar H+-ATPase (V-ATPase) maintains the lysosomal lumen at a pH of ~4.5 (11), which is thought to be required for the optimal activity of lysosomal hydrolases and to set up a proton gradient with the cytosol that provides energy for transporters to move metabolites across the lysosomal membrane. To directly ask how loss of the acidic pH impacts lysosomal metabolites, we profiled lysosomes from cells acutely treated with the V-ATPase inhibitors Bafilomycin A1 (BafA1) or Concanamycin A (ConA) (12, 13), at concentrations that do not inhibit mTORC1 signaling (4) (Fig. S2A). Although neither had a major impact on the whole-cell metabolome, both caused large changes in the metabolome of the lysosome (Fig. 2A and Fig. S2B). This emphasizes the value of LysoIP for studying an organelle that in HEK-293T cells occupies only 2 to 3% of the total cell volume. V-ATPase inhibition caused the accumulation of many metabolites in lysosomes (Fig. 2B and Supplementary table 3), and only the concentration of cystine dropped significantly (P ≤ 0.01 in either treatment, two-tailed t test) (Fig. S2C), consistent with in vitro work showing that the lysosomal entry of cysteine requires the pH gradient (14). Although all the non-essential amino acids accumulated in lysosomes upon V-ATPase inhibition (Fig. 2C), with proline, alanine, and glycine being the most affected (Fig. 2C), 7 of the 9 essential amino acids did not, with histidine and threonine being the exceptions (Fig. 2D). Given that lysosomes harbor several well-characterized proton-dependent amino acid transporters, such as lysosomal amino acid transporter 1 (LYAAT-1) (15), lysosomal accumulation of the non-essential amino acids caused by V-ATPase inhibition may result from their decreased efflux. We therefore undertook pulse-chase experiments using 15N-labeled alanine, a representative pH-dependent amino acid, and isoleucine, a non-pH-dependent one (Fig. 2C–F). In live cells both entered lysosomes, with isoleucine doing so more rapidly than alanine (Fig. 2E). ConA treatment slowed the efflux of alanine, but not that of isoleucine, from lysosomes (Fig. 2F), consistent with proton-dependent transporters mediating the efflux of this and other non-essential amino acids from lysosomes. Furthermore, the failure of V-ATPase inhibition to impact the lysosomal levels of most essential amino acids, particularly the non-polar ones, raises the question of what, if anything, regulates their abundance.
Fig. 2. The efflux from lysosomes of most non-essential, but not essential, amino acids requires the proton gradient.

A) Changes in metabolite concentrations in whole-cells and lysosomes upon V-ATPase inhibition. Principal component analyses of changes in metabolite concentrations in whole-cells (circle) or lysosomes (square) after treatment for 1 hour with 200 nM Bafilomycin A1 (BafA1, blue) or Concanamycin A (ConA, purple). DMSO vehicle-treated cells were used as control (vehicle, green).
B) Most metabolites accumulate in lysosomes upon V-ATPase inhibition while their levels in whole-cells are not affected. P-values are for comparisons between metabolite concentrations in whole-cell (triangle) or lysosome (circle) samples shown in (A) (n=3 for each treatment; dotted line represents p-value = 0.05). Lower panel, heat map of fold changes (log2) in metabolite concentrations after V-ATPase inhibition relative to vehicle-treatment. Gray boxes indicate undetected metabolites.
C and D) Accumulation of most non-essential, but not essential, amino acids in lysosomes upon V-ATPase inhibition. Fold changes in whole-cell and lysosomal concentrations of amino acids in BafA1- or ConA-treated cells relative to vehicle-treated cells (mean ± SEM, n=3, *p<0.05).
E) Tracing of exogenously added alanine and isoleucine in live cells. Cells were incubated in medium containing 15N-labeled alanine and isoleucine for the indicated time points and then subjected to LysoIP. Data are presented as the fraction of the total pool of the amino acid that is 15N-labeled in whole-cells (black) or lysosomes (red) (mean ± SEM, n=3 in each time point).
F) Dependence of lysosomal efflux of alanine but not that of isoleucine on the proton-gradient. Cells treated with or without ConA were incubated in medium containing 15N-labeled alanine and isoleucine for 1 hour (pulse period), which was then replaced with medium containing the natural 14N-containing isotope for the indicated time points (chase period). The fold change in the fraction of 15N-labeled amino acid remaining in the whole cells (circle) or lysosomes (square) was measured (mean ± SEM, n=3; k (in min−1) is the rate constant for the decay of the 15N-labeled amino acid from the lysosome and * indicates non-overlapping 95% confidence intervals of the calculated k values between the treatments). Two-tailed t tests were used for comparisons between groups.
To investigate this, we examined other conditions that might affect lysosomal metabolites, including nutrient starvation. We starved cells of all amino acids for 60 minutes and measured the concentrations of amino acids in lysosomes and in whole cells. Concentrations of most non-essential amino acids did not drop in either sample, consistent with the capacity of cells to synthesize them. In contrast, the concentrations of most essential amino acids, including those that were insensitive to V-ATPase inhibition, diminished in the whole-cell samples, but most showed little if any change, in lysosomes (Fig. 3A and supplementary table 4). Thus, amino acid starvation appears to inhibit the lysosomal egress of many essential amino acids.
Fig. 3. mTOR regulates the lysosomal levels of essential non-polar amino acids in an autophagy-independent manner.

A) mTORC1 regulates the abundance of amino acids in lysosomes upon amino acid starvation. A heat map shows fold changes (log2) in amino acid (AA) concentrations in whole cell samples or lysosomes of wild-type and DEPDC KO cells after amino acid starvation for 60 minutes relative to cells cultured in medium with all amino acids (n=2 for each time point).
B) Amino acid starvation inhibits mTORC1 signaling. Immunoblotting was used to monitor the levels and phosphorylation state of S6 kinase (S6K1) in the same samples as in (A). Raptor served as a loading control.
C) Pharmacological inhibition of mTOR leads to the accumulation of many metabolites in lysosomes. Cells were treated with 250 nM Torin1 or DMSO (vehicle) for 1 hour and the lysosomal metabolite concentrations were determined and compared (n=3). Red lines indicate three-fold change in lysosomal concentration in Torin1- relative to vehicle-treated cells.
D) Lysosomal accumulation of non-polar essential amino acids and tyrosine in an autophagy-independent manner after mTOR inhibition. Fold changes in the whole-cell and lysosomal concentrations of amino acids in wild-type and Atg7-null cells treated with Torin1 relative to vehicle-treated cells (mean ± SEM, n=3, *p<0.05; N.S, non significant). Histidine and serine served as examples of autophagy-dependent amino acids.
E) Upon mTOR inhibition, nucleosides accumulate in lysosomes in a mostly autophagy-dependent manner. Fold changes in whole-cell and lysosomal concentrations of nucleosides in the same cells as in (D) (mean ± SEM, n=3, *p<0.05).
F) Proteasome activity is dispensable for the lysosomal accumulation of amino acids upon mTOR inhibition. Fold changes in the whole-cell and lysosomal concentrations of amino acids in cells treated with 250 nM Torin1 or Torin1 together with 5 uM Bortezomib relative to DMSO- or Bortezomib-treated cells, respectively (mean ± SEM, n=3, *p<0.05; N.S, non significant).
G) Proteogenic amino acids can be divided into those whose lysosomal levels are regulated by V-ATPase- or mTOR-dependent mechanisms.
Two-tailed t tests were used for comparisons between groups.
Given that a major consequence of amino acid starvation is inhibition of mTORC1 (Fig. 3B) (16, 17), we asked if mTORC1 regulates the abundance of amino acids in lysosomes. Consistent with this possibility, in cells that lack functional GATOR1 (DEPDC5 KO cells) and thus have amino acid-insensitive mTORC1 signaling (18), amino acid starvation did decrease the concentrations of lysosomal amino acids (Fig. 3A and 3B). Moreover, inhibition of the kinase activity of mTOR with Torin1 (19) increased the lysosomal concentrations of 6 of the 7 V-ATPase-insensitive amino acids (leucine, phenylalanine, isoleucine, tryptophan, methionine and valine) and of tyrosine, while having small effects on most other amino acids, including histidine and serine, as well as many additional metabolites (Fig. 3C, 3D, Fig. S3A and supplementary table 5). Torin1 also increased the lysosomal concentrations of nucleosides, although in this case the effect was also seen in whole cells (Fig. 3E). Of the 7 amino acids most strongly affected by Torin1, all are non-polar and essential, with the exception of tyrosine, which is generated from the essential amino acid phenylalanine (20). Importantly, other chemically distinct ATP-competitive inhibitors of mTOR, including AZD8055 and WYE-132 (21, 22), also increased the concentration of these 7 amino acids (Fig. S3B) and mTOR inhibition had similar effects across multiple cell lines (Fig. S3C). Although Torin1, AZD8055, and WYE-132, inhibit both mTORC1 and mTOR Complex 2 (mTORC2), inhibition of only mTORC1 with the allosteric inhibitor rapamycin or with lower concentrations of Torin1 also increased the concentration of these amino acids, albeit to smaller extents (Fig. S3B, Fig. S3D). mTORC1 is essential for cell survival but it is possible to generate cells lacking rictor, a critical mTORC2-specific component needed for phosphorylation of the protein kinase Akt (23). Loss of rictor did not increase lysosomal amino acid concentrations, and, importantly, Torin1 increased the abundance of the 7 amino acids in lysosomes even more in cells lacking rictor than in wild-type cells (Fig. S3E). Thus, mTORC1 appears to mediate the effects of mTOR inhibition on lysosomal amino acids.
Because mTORC1 inhibits autophagy (24–28), a potential explanation for the effects of Torin1 is that it activates autophagic flux to such a degree that the production of metabolites by lysosomal macromolecular degradation exceeds the capacity of lysosomes to export them. We tested this possibility in cells lacking ATG7 (Fig. S3F), which encodes a key component of the autophagy machinery (29). For most metabolites, loss of autophagy almost completely eliminated the Torin1-induced increases in their lysosomal concentrations, but it had only minor effects on those of the 7 strongly affected amino acids (leucine, tyrosine, phenylalanine, isoleucine, tryptophan, methionine, and valine) (Fig. 3D, 3E, Fig. S3G and supplementary table 5). mTOR inhibition also activates the proteasome (30), but Bortezomib, a proteasomal inhibitor (31), had no effect on the capacity of Torin1 to increase abundance of lysosomal amino acids (Fig. 3F and Fig. S3H). Lastly, mTORC1 inhibition suppresses mRNA translation (32), but the protein synthesis inhibitor cycloheximide did not mimic the effects of the mTOR inhibitors on lysosomal amino acid levels, although it did mildly increase whole-cell and lysosomal pools of the mTOR-regulated amino acids (Fig. S3L). Thus, mTORC1 regulates the lysosomal concentrations of a largely distinct set of amino acids from those affected by the V-ATPase (Fig. 3G) through a mechanism that does not involve autophagy, the proteasome, or protein synthesis (Fig. 3G).
Given that mTORC1 does not impact the 7 amino acids through established downstream processes, we considered the possibility that it controls their flux across the lysosomal membrane. We used 15N-labeled amino acids to monitor the transport of four of the mTOR-regulated amino acids (leucine, tyrosine, phenylalanine, and isoleucine) and a control amino acid (serine) into lysosomes in live cells. When added to the culture media the labeled amino acids rapidly exchanged with the 14N-containing amino acids already in lysosomes (Fig. 2E and Fig. 4A). In cells treated with or without cycloheximide, Torin1 caused lysosomal accumulation of 15N-labeled leucine, tyrosine, phenylalanine, and isoleucine, but not serine (Fig. S4A, S4B and Fig. 4B), demonstrating that mTOR regulates the movement of free amino acids across the lysosomal membrane independently of their incorporation into protein. Pulse-chase experiments revealed that mTOR inhibition slows the efflux of leucine, tyrosine, phenylalanine, and isoleucine, but not that of serine, from lysosomes but not from whole cells (Fig. 4C and Fig. S4C).
Fig. 4. mTOR controls the efflux of non-polar essential amino acids and tyrosine from lysosomes.

A) Tracing of exogenously added leucine, tyrosine, phenylalanine, and serine in live cells. Cells were incubated in medium containing the indicated 15N-labeled amino acids for various times and subjected to the LysoIP method. Data are presented as the fraction of the total pool of the amino acid in whole cells (black) or lysosomes (red) that is 15N-labeled (mean ± SEM, n=3 in each time point).
B) Independently of protein synthesis, mTOR inhibition leads to the accumulation in lysosomes of leucine, tyrosine, phenylalanine, and isoleucine, but not serine. Data are presented as the fold change in the whole-cell and lysosomal abundance of the indicated 15N-labeled amino acid after Torin1-treatment relative to the DMSO vehicle treatment. The experiment was performed as indicated in the figure in the presence of 50 ug/mL cycloheximide (CHX) (mean ± SEM, n=3, p<0.005). This experiment was performed using Atg7-null cells.
C) mTOR controls the lysosomal efflux of non-polar essential amino acids as well as tyrosine. Cells treated with 250 nM Torin1 or DMSO (vehicle) were incubated in medium containing the indicated 15N-labeled amino acids for 1 hour (pulse period). This medium was then replaced with media containing the natural 14N-isotope of the amino acid for the indicated time points (chase period). Data are presented as the fold change in the fraction of 15N-labeled amino acid remaining in whole cells (triangle) or lysosomes (circle) at each time point (mean ± SEM, n≥3; k (in min−1) is the rate constant for the decay of the 15N-labeled amino acid from lysosomes and * indicates non-overlapping 95% confidence intervals of the calculated k between the treatments). This experiment was performed using Atg7-null cells.
D) mTORC1 regulates the lysosomal abundance of essential non-polar amino acids and tyrosine in an SLC38A9-dependent manner. Fold changes in the lysosomal concentrations of indicated amino acids in wild-type and SLC38A9-null cells treated with Torin1 relative to vehicle-treated wild-type cells (mean ± SEM, n=3).
E) Loss of SLC38A9 impairs the fitness of cells under starvation conditions. Wild-type, SLC38A9-null, and SLC38A9-null addback (SLC38A9-null+SLC38A9) cells were seeded in medium containing all amino acids (full media) or lacking leucine, isoleucine, tyrosine, and phenylalanine (-LIYF) for 3 days at which point cell numbers were measured (mean ± SD, n=3, *p<0.001).
F) SLC38A9 is required for inhibiting the GCN2 pathway after a prolonged amino acid starvation period. Immunoblotting was used to monitor the levels and phosphorylation state of eIF2α. Raptor served as a loading control. LIYF indicates leucine, isoleucine, tyrosine, and phenylalanine.
G) A model proposing a role for mTORC1 in regulating the efflux of amino acids from lysosomes.
Two-tailed t tests were used for comparisons between two groups.
We recently identified the multi-pass protein SLC38A9 as a lysosomal effluxer of many essential non-polar amino acids (Wyant GA, Cell, in press). Its loss led to the accumulation in lysosomes of the 7 amino acids most impacted by mTOR inhibition and greatly reduced their efflux from lysosomes (Fig. 4D and Fig. S4D). In cells lacking SLC38A9, Torin1 did not boost the already high lysosomal concentrations of the 7 amino acids (Fig. 4D). Thus, mTOR inhibition and loss of SLC38A9 do not have additive effects on lysosomal amino acids, suggesting that mTORC1 regulates the lysosomal abundance of amino acids through a mechanism that involves SLC38A9. Loss of SLC38A9 greatly impaired the capacity of cells to survive amino acid starvation, and of the GCN2 pathway, which senses uncharged tRNAs, to return to baseline activity levels upon prolonged starvation (Fig. 4E and Fig 4F). Thus, the efflux of the mTORC1-regulated essential amino acids from lysosomes is important for the cellular response to starvation.
Our data show that mTORC1 has a previously unknown role in promoting the efflux of essential amino acids from the lysosome into the cytosol (Fig. 4G). mTORC1 inhibition leads to the sequestration of these amino acids in the lysosome by slowing their movement across the lysosomal membrane, in effect converting it into a storage compartment for them. We speculate that this function of mTORC1 is important for preventing the inappropriate use of essential amino acids during amino acid starvation, a state in which lysosomal and proteasomal protein degradation are thought to be a major source of amino acids (30, 33, 34). One can imagine the following scenario: early in a starvation period mTORC1 becomes profoundly inhibited, which, by suppressing SLC38A9 and perhaps other transporters, prevents the exit from lysosomes of essential amino acids. Over time, as proteolysis partially restores amino acid levels, mTORC1 becomes sufficiently reactivated so that essential amino acids are released into the cytosol at a faster rate to be used to execute the ongoing gene expression program that cells induce to adapt to starvation (3, 33). In this regard, it is interesting that Torin1, which completely inhibits mTORC1, causes a greater accumulation of amino acids in lysosomes than rapamycin, which only partially inhibits it (19, 35–37). This pattern is also true for several other processes downstream of mTORC1, such as autophagy and protein synthesis (19, 35–37), and may indicate that the mechanisms through which mTORC1 regulates lysosomal amino acid efflux, such as through SLC38A9, are also sensitive to the exact amount of mTORC1 activity, allowing for distinct outcomes at different levels. How mTORC1 impacts SLC38A9 function is unknown and it may do so indirectly or directly. Activated mTORC1 resides on the lysosomal surface (5, 38), so it has the correct localization to control SLC38A9 or its regulators. The fact that SLC38A9 also signals arginine levels to mTORC1 (39–41) suggests that SLC38A9 is part of sophisticated system for coordinating mTORC1 activity and lysosomal amino acid efflux with the concentrations of cytosolic and lysosomal amino acids. Our findings provide an example of the utility of LysoIP for uncovering a new function for lysosomes—the sequestering of essential amino acids upon mTORC1 inhibition. The method we described may be useful for studying the emerging roles of lysosomes and for probing the metabolic state of the lysosome in the various diseases in which it is implicated.
Supplementary Material
Acknowledgments
We thank all members of the Sabatini Laboratory for helpful insights, particularly J.R. Cantor, W.W. Chen, and J.M. Orozco; C.A. Lewis and T. Kunchok from the Whitehead Institute Metabolite Profiling Core Facility; and N.S. Gray (DFCI) for Torin1. This work was supported by grants from the NIH (R01 CA103866, R01 CA129105, and R37 AI47389) and Department of Defense (W81XWH-15-1-0230) to D.M.S., from Department of Defense (W81XWH-15-1-0337) to E.F., from the EMBO Long-Term Fellowship to M.A.-R, Saudi Aramco Ibn Khaldun Fellowship for Saudi Women to N.N.L., and a fellowship support from the National Defense Science & Engineering Graduate Fellowship (NDSEG) Program to G.A.W. D.M.S. is an investigator of the Howard Hughes Medical Institute.
References and Notes
- 1.Ballabio A, Gieselmann V. Lysosomal disorders: from storage to cellular damage. Biochimica et biophysica acta. 2009 Apr;1793:684. doi: 10.1016/j.bbamcr.2008.12.001. [DOI] [PubMed] [Google Scholar]
- 2.Platt FM, Boland B, van der Spoel AC. The cell biology of disease: lysosomal storage disorders: the cellular impact of lysosomal dysfunction. The Journal of cell biology. 2012 Nov 26;199:723. doi: 10.1083/jcb.201208152. [DOI] [PMC free article] [PubMed] [Google Scholar]
- 3.Settembre C, Fraldi A, Medina DL, Ballabio A. Signals from the lysosome: a control centre for cellular clearance and energy metabolism. Nature reviews Molecular cell biology. 2013 May;14:283. doi: 10.1038/nrm3565. [DOI] [PMC free article] [PubMed] [Google Scholar]
- 4.Zoncu R, et al. mTORC1 senses lysosomal amino acids through an inside-out mechanism that requires the vacuolar H(+)-ATPase. Science. 2011 Nov 04;334:678. doi: 10.1126/science.1207056. [DOI] [PMC free article] [PubMed] [Google Scholar]
- 5.Sancak Y, et al. Ragulator-Rag complex targets mTORC1 to the lysosomal surface and is necessary for its activation by amino acids. Cell. 2010 Apr 16;141:290. doi: 10.1016/j.cell.2010.02.024. [DOI] [PMC free article] [PubMed] [Google Scholar]
- 6.Davidson SM, Vander Heiden MG. Critical Functions of the Lysosome in Cancer Biology. Annual review of pharmacology and toxicology. 2017 Jan 06;57:481. doi: 10.1146/annurev-pharmtox-010715-103101. [DOI] [PubMed] [Google Scholar]
- 7.Chen WW, Freinkman E, Wang T, Birsoy K, Sabatini DM. Absolute Quantification of Matrix Metabolites Reveals the Dynamics of Mitochondrial Metabolism. Cell. 2016 Aug 25;166:1324. doi: 10.1016/j.cell.2016.07.040. [DOI] [PMC free article] [PubMed] [Google Scholar]
- 8.Schroder B, Wrocklage C, Hasilik A, Saftig P. Molecular characterisation of ‘transmembrane protein 192’ (TMEM192), a novel protein of the lysosomal membrane. Biological chemistry. 2010 Jun;391:695. doi: 10.1515/BC.2010.062. [DOI] [PubMed] [Google Scholar]
- 9.Mancini GM, Beerens CE, Aula PP, Verheijen FW. Sialic acid storage diseases. A multiple lysosomal transport defect for acidic monosaccharides. The Journal of clinical investigation. 1991 Apr;87:1329. doi: 10.1172/JCI115136. [DOI] [PMC free article] [PubMed] [Google Scholar]
- 10.Schulman JD, Bradley KH, Seegmiller JE. Cystine: compartmentalization within lysosomes in cystinotic leukocytes. Science. 1969 Nov 28;166:1152. doi: 10.1126/science.166.3909.1152. [DOI] [PubMed] [Google Scholar]
- 11.Mindell JA. Lysosomal acidification mechanisms. Annual review of physiology. 2012;74:69. doi: 10.1146/annurev-physiol-012110-142317. [DOI] [PubMed] [Google Scholar]
- 12.Bowman EJ, Siebers A, Altendorf K. Bafilomycins: a class of inhibitors of membrane ATPases from microorganisms, animal cells, and plant cells. Proceedings of the National Academy of Sciences of the United States of America. 1988 Nov;85:7972. doi: 10.1073/pnas.85.21.7972. [DOI] [PMC free article] [PubMed] [Google Scholar]
- 13.Huss M, et al. Concanamycin A, the specific inhibitor of V-ATPases, binds to the V(o) subunit c. The Journal of biological chemistry. 2002 Oct 25;277:40544. doi: 10.1074/jbc.M207345200. [DOI] [PubMed] [Google Scholar]
- 14.Pisoni RL, Acker TL, Lisowski KM, Lemons RM, Thoene JG. A cysteine-specific lysosomal transport system provides a major route for the delivery of thiol to human fibroblast lysosomes: possible role in supporting lysosomal proteolysis. The Journal of cell biology. 1990 Feb;110:327. doi: 10.1083/jcb.110.2.327. [DOI] [PMC free article] [PubMed] [Google Scholar]
- 15.Sagne C, et al. Identification and characterization of a lysosomal transporter for small neutral amino acids. Proceedings of the National Academy of Sciences of the United States of America. 2001 Jun 19;98:7206. doi: 10.1073/pnas.121183498. [DOI] [PMC free article] [PubMed] [Google Scholar]
- 16.Hara K, et al. Amino acid sufficiency and mTOR regulate p70 S6 kinase and eIF-4E BP1 through a common effector mechanism. The Journal of biological chemistry. 1998 Jun 05;273:14484. doi: 10.1074/jbc.273.23.14484. [DOI] [PubMed] [Google Scholar]
- 17.Kim DH, et al. mTOR interacts with raptor to form a nutrient-sensitive complex that signals to the cell growth machinery. Cell. 2002 Jul 26;110:163. doi: 10.1016/s0092-8674(02)00808-5. [DOI] [PubMed] [Google Scholar]
- 18.Bar-Peled L, et al. A Tumor suppressor complex with GAP activity for the Rag GTPases that signal amino acid sufficiency to mTORC1. Science. 2013 May 31;340:1100. doi: 10.1126/science.1232044. [DOI] [PMC free article] [PubMed] [Google Scholar]
- 19.Thoreen CC, et al. An ATP-competitive mammalian target of rapamycin inhibitor reveals rapamycin-resistant functions of mTORC1. The Journal of biological chemistry. 2009 Mar 20;284:8023. doi: 10.1074/jbc.M900301200. [DOI] [PMC free article] [PubMed] [Google Scholar]
- 20.Udenfriend S, Cooper JR. The enzymatic conversion of phenylalanine to tyrosine. The Journal of biological chemistry. 1952 Feb;194:503. [PubMed] [Google Scholar]
- 21.Chresta CM, et al. AZD8055 is a potent, selective, and orally bioavailable ATP-competitive mammalian target of rapamycin kinase inhibitor with in vitro and in vivo antitumor activity. Cancer research. 2010 Jan 01;70:288. doi: 10.1158/0008-5472.CAN-09-1751. [DOI] [PubMed] [Google Scholar]
- 22.Yu K, et al. Beyond rapalog therapy: preclinical pharmacology and antitumor activity of WYE-125132, an ATP-competitive and specific inhibitor of mTORC1 and mTORC2. Cancer research. 2010 Jan 15;70:621. doi: 10.1158/0008-5472.CAN-09-2340. [DOI] [PubMed] [Google Scholar]
- 23.Sarbassov DD, Guertin DA, Ali SM, Sabatini DM. Phosphorylation and regulation of Akt/PKB by the rictor-mTOR complex. Science. 2005 Feb 18;307:1098. doi: 10.1126/science.1106148. [DOI] [PubMed] [Google Scholar]
- 24.Ganley IG, et al. ULK1.ATG13.FIP200 complex mediates mTOR signaling and is essential for autophagy. The Journal of biological chemistry. 2009 May 01;284:12297. doi: 10.1074/jbc.M900573200. [DOI] [PMC free article] [PubMed] [Google Scholar]
- 25.Hosokawa N, et al. Nutrient-dependent mTORC1 association with the ULK1-Atg13-FIP200 complex required for autophagy. Molecular biology of the cell. 2009 Apr;20:1981. doi: 10.1091/mbc.E08-12-1248. [DOI] [PMC free article] [PubMed] [Google Scholar]
- 26.Jung CH, et al. ULK-Atg13-FIP200 complexes mediate mTOR signaling to the autophagy machinery. Molecular biology of the cell. 2009 Apr;20:1992. doi: 10.1091/mbc.E08-12-1249. [DOI] [PMC free article] [PubMed] [Google Scholar]
- 27.Kim J, Kundu M, Viollet B, Guan KL. AMPK and mTOR regulate autophagy through direct phosphorylation of Ulk1. Nature cell biology. 2011 Feb;13:132. doi: 10.1038/ncb2152. [DOI] [PMC free article] [PubMed] [Google Scholar]
- 28.Amaravadi R, Kimmelman AC, White E. Recent insights into the function of autophagy in cancer. Genes & development. 2016 Sep 01;30:1913. doi: 10.1101/gad.287524.116. [DOI] [PMC free article] [PubMed] [Google Scholar]
- 29.Komatsu M, et al. Impairment of starvation-induced and constitutive autophagy in Atg7-deficient mice. The Journal of cell biology. 2005 May 09;169:425. doi: 10.1083/jcb.200412022. [DOI] [PMC free article] [PubMed] [Google Scholar]
- 30.Zhao J, Zhai B, Gygi SP, Goldberg AL. mTOR inhibition activates overall protein degradation by the ubiquitin proteasome system as well as by autophagy. Proceedings of the National Academy of Sciences of the United States of America. 2015 Dec 29;112:15790. doi: 10.1073/pnas.1521919112. [DOI] [PMC free article] [PubMed] [Google Scholar]
- 31.Adams J, et al. Proteasome inhibitors: a novel class of potent and effective antitumor agents. Cancer research. 1999 Jun 01;59:2615. [PubMed] [Google Scholar]
- 32.Ma XM, Blenis J. Molecular mechanisms of mTOR-mediated translational control. Nature reviews Molecular cell biology. 2009 May;10:307. doi: 10.1038/nrm2672. [DOI] [PubMed] [Google Scholar]
- 33.Yu L, et al. Termination of autophagy and reformation of lysosomes regulated by mTOR. Nature. 2010 Jun 17;465:942. doi: 10.1038/nature09076. [DOI] [PMC free article] [PubMed] [Google Scholar]
- 34.Zhao J, Goldberg AL. Coordinate regulation of autophagy and the ubiquitin proteasome system by MTOR. Autophagy. 2016 Oct 02;12:1967. doi: 10.1080/15548627.2016.1205770. [DOI] [PMC free article] [PubMed] [Google Scholar]
- 35.Kang SA, et al. mTORC1 phosphorylation sites encode their sensitivity to starvation and rapamycin. Science. 2013 Jul 26;341:1236566. doi: 10.1126/science.1236566. [DOI] [PMC free article] [PubMed] [Google Scholar]
- 36.Choo AY, Yoon SO, Kim SG, Roux PP, Blenis J. Rapamycin differentially inhibits S6Ks and 4E-BP1 to mediate cell-type-specific repression of mRNA translation. Proceedings of the National Academy of Sciences of the United States of America. 2008 Nov 11;105:17414. doi: 10.1073/pnas.0809136105. [DOI] [PMC free article] [PubMed] [Google Scholar]
- 37.Feldman ME, et al. Active-site inhibitors of mTOR target rapamycin-resistant outputs of mTORC1 and mTORC2. PLoS biology. 2009 Feb 10;7:e38. doi: 10.1371/journal.pbio.1000038. [DOI] [PMC free article] [PubMed] [Google Scholar]
- 38.Sancak Y, et al. The Rag GTPases bind raptor and mediate amino acid signaling to mTORC1. Science. 2008 Jun 13;320:1496. doi: 10.1126/science.1157535. [DOI] [PMC free article] [PubMed] [Google Scholar]
- 39.Wang S, et al. Metabolism. Lysosomal amino acid transporter SLC38A9 signals arginine sufficiency to mTORC1. Science. 2015 Jan 09;347:188. doi: 10.1126/science.1257132. [DOI] [PMC free article] [PubMed] [Google Scholar]
- 40.Jung J, Genau HM, Behrends C. Amino Acid-Dependent mTORC1 Regulation by the Lysosomal Membrane Protein SLC38A9. Molecular and cellular biology. 2015 Jul;35:2479. doi: 10.1128/MCB.00125-15. [DOI] [PMC free article] [PubMed] [Google Scholar]
- 41.Rebsamen M, et al. SLC38A9 is a component of the lysosomal amino acid sensing machinery that controls mTORC1. Nature. 2015 Mar 26;519:477. doi: 10.1038/nature14107. [DOI] [PMC free article] [PubMed] [Google Scholar]
- 42.Wolfson RL, et al. Sestrin2 is a leucine sensor for the mTORC1 pathway. Science. 2016 Jan 01;351:43. doi: 10.1126/science.aab2674. [DOI] [PMC free article] [PubMed] [Google Scholar]
- 43.Pisoni RL, Thoene JG, Lemons RM, Christensen HN. Important differences in cationic amino acid transport by lysosomal system c and system y+ of the human fibroblast. The Journal of biological chemistry. 1987 Nov 05;262:15011. [PubMed] [Google Scholar]
- 44.Xia J, Wishart DS. Using MetaboAnalyst 3.0 for Comprehensive Metabolomics Data Analysis. Current protocols in bioinformatics. 2016 Sep 07;55:14 10–1. doi: 10.1002/cpbi.11. [DOI] [PubMed] [Google Scholar]
- 45.Saldanha AJ. Java Treeview–extensible visualization of microarray data. Bioinformatics. 2004 Nov 22;20:3246. doi: 10.1093/bioinformatics/bth349. [DOI] [PubMed] [Google Scholar]
Associated Data
This section collects any data citations, data availability statements, or supplementary materials included in this article.