

Abstract
This brief account traces the development of a “competition dialysis” method used to characterize the structural and sequence selectivity of DNA binding compounds. The method was inspired by a simple “differential dialysis” method pioneered by Don Crothers to explore base-selective intercalator binding. Results from compiled competition dialysis studies provide a small-molecule DNA binding landscape that shows a rich diversity of interactions and molecular recognition.
Introduction
Don Crothers changed the landscape of drug-DNA binding studies forever and for the better. His 1968 publication in the Journal of Molecular Biology (with Werner Mueller) on the binding of actinomycin D to DNA brought rigorous physical chemistry into the field and established new standards for the characterization of drug-DNA interactions1. The paper is remarkable for its scope and breadth as it uses spectroscopic, hydrodynamic and kinetics methods, along with extensive chemical synthesis. Actinomycin D and some 29 derivatives were studied. It is arguably the single best drug-DNA interaction paper ever published and justifiably ranks among the 100 most cited JMB papers. His 1968 Biopolymers paper2 used elegant statistical mechanics to develop and articulate the neighbor exclusion model for drug-DNA interactions, six years before the more widely cited and used McGhee-von Hippel model3 that was derived using simpler probability considerations. Don had failed to provide a convenient closed-form equation to use to fit drug-DNA binding isotherms to the neighbor exclusion model, although a little algebra can be used to show that his approach yields an equation identical to that obtained by McGhee and von Hippel. These two classic papers of his are landmarks in studies of drug binding to DNA.
As influential as those two papers are it is another, less appreciated, paper by Don that has had a perhaps greater impact on my own studies of drug-DNA interactions. This is a 1975 publication in the European Journal of Biochemistry (now the FEBS Journal), again with the redoubtable Werner Mueller as a co-author4. The paper sought to understand the base specificity of DNA intercalating compounds using a series of proflavine and acradine orange derivatives. It must be recalled that at this time DNA sequencing methods were only in their infancy and that DNase footprinting methods for drug-DNA interactions would not be developed until seven years later, in 1982–83. Don and Werner devised an elegant differential dialysis method for the determination of base specificity in which a three-chambered dialysis cell was used to measure partitioning of ligand between DNA samples of different GC content. (This same device was used two years earlier in a paper that also included Michael Waring5, but it was used in a conventional way to obtain data for binding isotherms, not in a differential mode.) Don derived an analytical approach for the exact specification of ligand binding selectivity from the experimentally determined ratio of the amount of compound bound to the two DNA samples of differing base composition. Remarkably, the approach allowed for the specification of not only simple AT or GC base pair binding preferences, but also for more complex binding site preferences requiring different combinations of adjacent base pairs. Berenil, for example, was found to require at least two adjacent AT base pairs for binding, while actinomycin showed an absolute selectivity of GC base pairs. Unfortunately the method was not widely adopted, and was soon supplanted by footprinting methods which, although of higher resolution, are experimentally much more difficult and labor intensive. I pointed out the power of the simple differential dialysis method in a 1992 review6, in which I showed its power to reveal very complex drug binding site preferences, for example the mixed-triplet preference of daunorubicin for a site composed of adjacent GC base pairs flanked by an AT base pair. The mutual consistency between footprinting and differential dialysis results for daunorubicin was also emphasized.
While the differential dialysis approach was largely ignored between 1980–2000, it was used in another way during that period to demonstrate structural selective binding to DNA. Becker and Dervan used it to show that bis(methidium)spermine, a bisintercalator, strongly preferred binding to the RNA:DNA hybrid duplex poly rA-poly dT over its DNA counterpart poly dA-poly dT7. I used the method to demonstrate the strong preference of daunorubicin for binding to right-handed duplex DNA over left-handed Z DNA8. These studies eventually inspired a more ambitious effort to characterize structural selective drug binding to DNA in my laboratory, leading to what we called “competition dialysis”.
Competition Dialysis
Along with Jinsong Ren, then a talented postdoctoral researcher in my laboratory, we realized that the dialysis approach could be expanded in a very simple way to study binding to a much broader array of nucleic acid structures and sequences9. The specialized 3-chamber dialysis cell could be dispensed with in favor of a much more malleable experimental set up. A simple beaker containing a drug solution could be used into which nucleic acid samples contained in commercially available microdialysis units could be placed. This allowed for a broader array of different structures and sequences to be placed in contact with the same dialysate solution. Instead of two nucleic acid receptor samples, tens of different samples could be easily studied and their binding preferences studied. At equilibrium, all structures and sequences would be equilibrated against the identical free drug concentration and the amount bound to each type of “receptor” would clearly and simply reflect the relative binding affinity and selectivity of the ligand toward each structure compared to all others. After the initial presentation of the method9, a series of papers were published that investigated a wide variety of nucleic acid binders from our own laboratory and those that were provided by an international group of collaborators9–24. The first generation of the method used 13 different structures and sequences, but the method quickly evolved to include 19 then 46 nucleic acid types. Detailed protocols of the method, sample preparation and analysis were published in several places as the technique evolved14,25–30.
Figure 1 shows representative examples of first-generation competition dialysis data9. The binding of actinomycin D, distamycin and a napthyl quinoline compound MHQ15 (a compound designed and synthesized by Lucjan Strekowski18). These data show the advantage of the method. At a glance, the GC base pair preference of actinomycin and the AT base pair preference of distamycin is clearly evident. The striking preference of MHQ15 for triplex DNA over all other forms jumps out. The actinomycin and distamycin results are not surprising; the compounds were in fact used as refererence compounds to validate the method. They behaved exactly as they were supposed to, although the apparent binding of distamycin to triplex DNA was an initial surprise. Additional experiments showed that distamycin was in fact displacing the third strand and binding to the underlying A-T duplex. I recall that Don was fond of quoting Mark Twain’s adage that “supposin’ is good but findin’ out is better”. In our case “findin’ out” that the method worked as intended with these well-known compounds fueled further studies.
Figure 1.
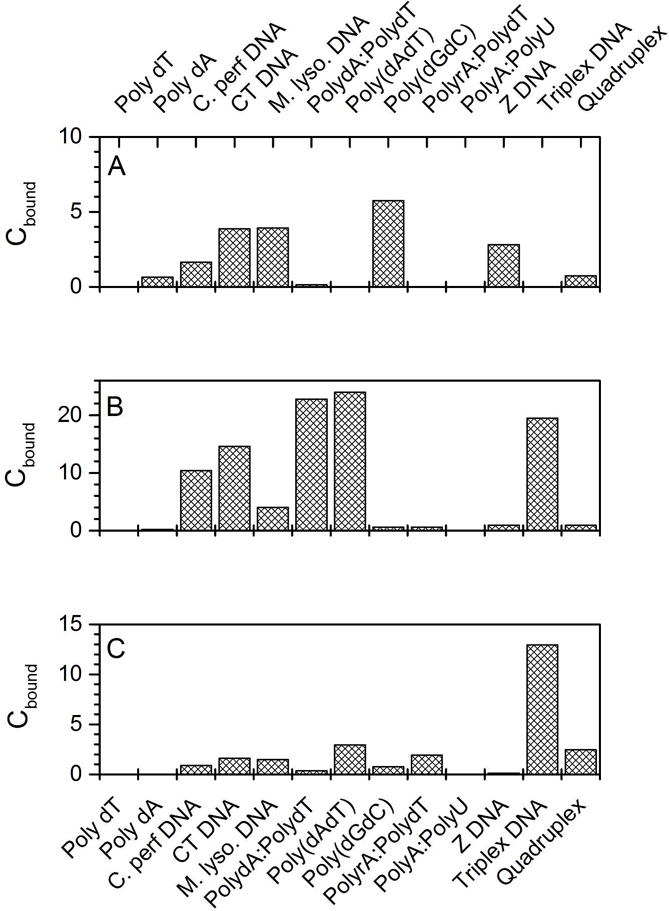
Example of competition dialysis data for selected DNA binding ligands. (A) Actinomycin d. (B) Distamycin, a groove-binder. (C) The naphthylquinoline MHQ15.
In the initial implementation of the method data were eventually collected for the binding of 126 compounds to the 13 different nucleic acid structures and sequences. The dataset thus reports on 1,638 individual binding interactions, as complete a description of a binding landscape as was (and still is) available for small molecule and nucleic acids. The data were published somewhat piecemeal, reporting on particular groups of compounds as data were gathered and depending on the interests of particular collaborators who were attempting to design particular structural or sequence selective ligands. It is instructive, however, to view the data collectively as a binding landscape. That is the purpose of this contribution. It is possible to examine the 1,638 binding interactions either qualitatively or by using chemometric approaches to identify trends and often subtle binding behavior. This paper compiles and reexamines existing and published competition dialysis data in new ways. Interesting features of a complex landscape emerge. The data used are compiled in an Excel file available as Supplemental Material. Experimental methods were fully described in published papers14,25–30.
The Structural Landscape
The thirteen nucleic acid structures and sequences used represent binding possibilities to a variety of groove geometries and to potential intercalation sites. The preparation and physical properties of the structures was fully described9 Single-stranded poly dA and poly dT represent minimally structured DNA with possible binding to bases or to the phosphate backbone. Natural DNA samples of varying GC content (C. perfringens, calf thymus, M. lysodeikticus) were used a representative of “normal” B-DNA with varying base pair content. Synthetic polynucleotides (poly dA-poly dT, poly (dAdT), poly (dGdC)) represent more homogenous base pair compositions and also subtly different right-hand DNA conformations. A DNA-RNA hybrid (largely A-form) and A-form RNA are represented by poly rA-poly dT and by poly rA-ploy rU, respectively. Left-handed Z DNA is represented by brominated poly (dGdC). Finally, multistranded triplex and quadruplex DNA forms are represented by poly dA-(poly dT)2 and (dTG20T)4, respectively. The latter (colloquially known in the lab as “Big Mamou”) is a tetramolecular parallel form that is a somewhat unusual representative of quadruplexes that features a unique groove geometry, intercalation sites and two “end pasting” sites – the exposed terminal quartets. At the time, the rich polymorphism of unimolecular folded quadruplexes was not yet fully appreciated. These were included in successive generations of the dialysis method28, but will not be discussed here. The structural array of the first-generation dialysis assay thus featured the major A-, B-, and Z-DNA geometries, a wide variety of major and minor groove structures and sequences, a wide variety of potential intercalation sites, and mutistranded groove and intercalation sites. The compound library of 126 compounds was built using commercially available samples and newly synthesized compounds provided by a number of collaborators. A complete list of the compounds and their structures can be found as freely available supplemental materials to published articles15.
The Binding Landscape
Figure 2 show the complete binding landscape for the first-generation structure and compound arrays, offering an unprecedented glimpse into the variety of nucleic acid binding interactions. Data is shown as the amount bound of each of the126 compounds to each of the 13 sequences and structures, under conditions where the free compound concentration is 1 μM and the total nucleic acid concentration is 75 μM. A wide variety of binding affinities are evident, including a large number of cases where there is no binding at all to particular structures. Compounds have been ordered from the most (compound 1) to least (compound 126) selective. Figure 3 shows the extremes of behavior for the landscape. The porphyrin NMM (compound 1, N-methyl mesoporphyrin IX) binds only to the representative quadruplex structure (figure 3 A) and is the most selective compound. Its binding is weak, but it is absolutely selective for the quadruplex. In contrast, compound 126 (the quinacridine MMQ131,32) is highly promiscuous and binds with measurable affinity to every nucleic acid in the array, including single-stranded forms (figure 3B). Figure 2 shows that binding to single-strand forms is rare, although one compound (compound 67, coralyne) is seen to bind avidly to poly dA. (Subsequent studies from the Hud laboratory later showed that this apparent high affinity in fact resulted from coralyne-induced duplex formation into an unusual (poly dA)2 structure33–35.) Complex patterns of binding are evident for interactions with the remaining nucleic acids. Binding to triplex DNA is seen to be strong for many compounds. This, in part, reflects a bias in the compound array used which contains a large number of compounds designed to target triplex structures, which were of great interest at the time the competition dialysis assay was implemented.
Figure 2.
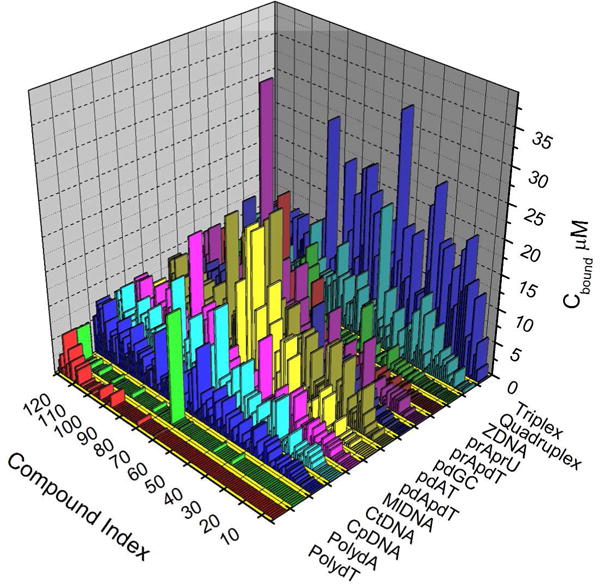
The DNA binding landscape of 126 compounds. The results from competition dialysis experiments showing the amount of each compound bound to 13 different nucleic acid sequences and structures. Bind data are ranked from the most selective binding (compound 1) to the least selective binding (compound 126).
Figure 3.
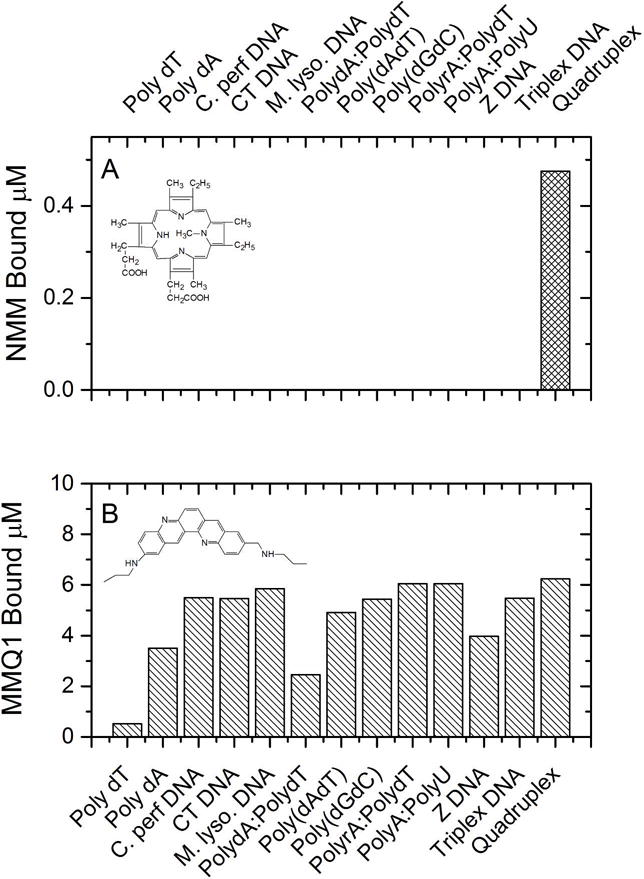
Competition dialysis data for the most selective (A) and least selective (B) compounds in the binding landscape. The amount of each compound bound to each of 13 structures and sequences is shown.
The dataset can be used in many ways, for example to look at pairwise specificity as was done originally by Mueller and Crothers4. Figure 4 shows two examples of this. In Figure 4A the ratio of the amount of ligand bound to M. lysodieticus DNA (72% GC) and C. perfringens DNA (31% GC) is shown for all 126 compounds. The data are ranked by magnitude of the ratio. These data are analogous to the original differential dialysis approach used by Mueller and Crothers to evaluate base specificity, but include a much larger compound library. Highly GC-selective compounds (α > 3) are indicated in blue. Among these are the groove-binder chromomycin and a series of polyintercalating naphthalenetetracaboxilic diimide compounds that were rationally design in the Iverson laboratory11. In constrast, a group of AT-selective compounds (α < 0.5) are indicated in red. These include the classic minor groove-binders berenil, netropsin, DAPI and distamycin. Figure 4B shows the ratio of compound binding to triplex and duplex DNA to provide an example of structural selectivity. Note first of all that the selectivity of binding is much more pronounced than was the case for base selectivity, with α values reaching 50. Low selectivity for triplex is shown in red, a group that, interestingly, is heavily populated by Iverson’s polyintercalators11. The group shown in blue shows striking selectivity for triplex DNA. This group is heavily populated by designed napthyl quinolone18 and diaryldiamidines19 compounds from the Strekowski and Boykin/Wilson laboratories, respectively. These compounds were designed to be selective for triplex, and the designs quite clearly succeeded.
Figure 4.
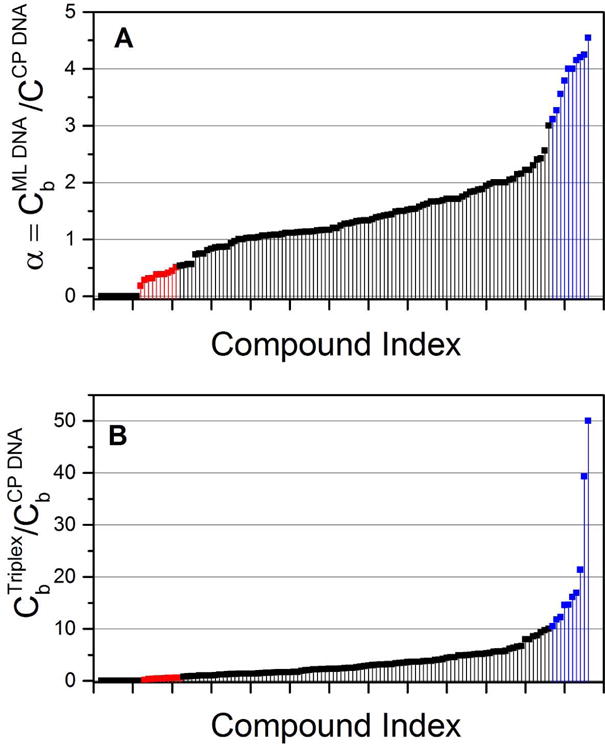
Base (A) and structural (B) selectivity of DNA binding compounds. (A) The GC base selectivity is shown as the ratio of the amount of compound bound to M. lysodieticus DNA (“ML”; 72% GC) and C. perfringens DNA (“CP”;31% GC). The 10 most GC selective compounds are indicated in blue. The 10 most AT selective compounds are indicated in red. (B) Triplex selectivity is shown as the ratio of the amount of compound bound to the poly dA-(poly dT)2 triple helix and C. perfringens duplex DNA. The 10 most triplex selective compound are shown in blue, the least selective shown in red.
While the binding landscape can be qualitatively or quantitatively examined in this way to ferret out interesting behaviors, chemometric methods offer approaches to mine the dataset to identify global trends and relationships not easily visualized. The results of such methods provide a more unbiased quantitative analysis and reveal more subtle features of the landscape.
PCA and Cluster Analysis
The matrix of data shown in figure 2 was analyzed by principle component analysis and hierarchical cluster analysis to characterize the landscape. Multivariate analysis was done using the program OriginPro 9.0 (OriginLab Corporation, Northampton, MA) Figure 5 shows the dendrogram for the clustering of the variables, the nucleic acid structures. The dendrogram shows a logical grouping of the nucleic acid receptors, as might be expected. Single-stranded forms are grouped. Natural DNA samples and deoxypolynucleotides are grouped as right-handed helices. Multistranded triplex and quadruplex structures are grouped. Finally, RNA and RNA-DNA hybrids structures are grouped, with a somewhat surprising inclusion of left-handed Z-DNA. The key point of figure 5 is that the binding landscape in fact has an underlying structure based on properties and similarities of the nucleic acid receptor array.
Figure 5.
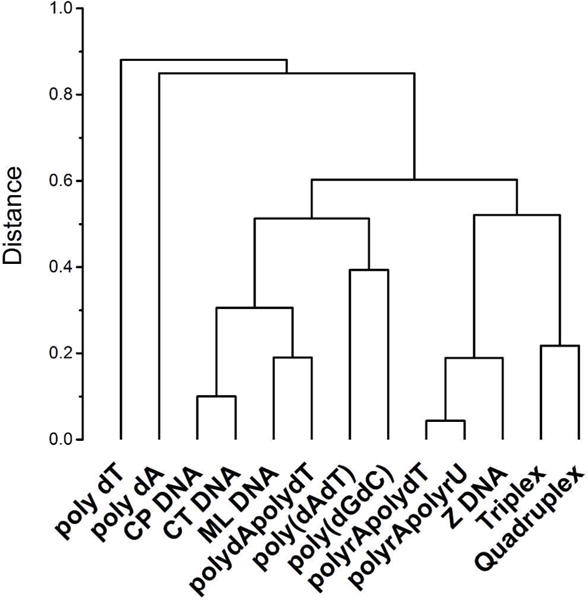
Dendrogram for the hierarchical clustering of the binding landscape shown in figure 2 with respect to the variables, the nucleic acid structures and sequences.
Figure 6 shows the much more complex dendrogram obtained for the hierarchical cluster of the observations, the 126 compounds. Compounds with similar binding profiles do indeed cluster. There are 7–8 clusters each containing a variable number of members, and on the far right of the dendrogram several groupings with only 1–2 members each. A few examples are labeled for discussion.
Figure 6.
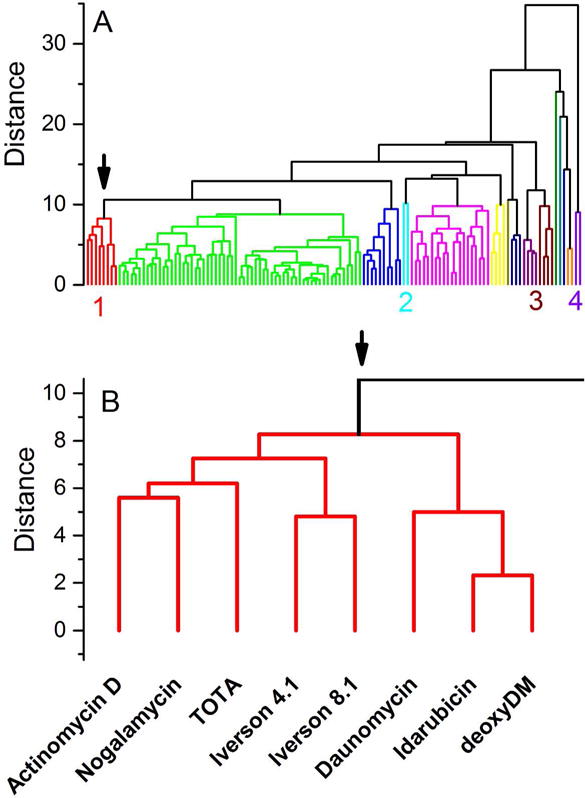
Dendrogram for the hierarchical clustering of the binding landscape shown in figure 2 with respect to the observations, the 126 compounds studied. (A) Dendrogram derived for the complete set of compounds. Clusters are identified by separate colors. The labels 1, 2, 3 and 4 identify clusters discussed in the text. (B) Enlargement of cluster 1 colored red in panel (A), now including the compound names for each arm of the dendrogram.
The red cluster in figure 6A labeled “1” is expanded in figure 6B to show the member compounds. These eight compounds all are intercalators bind selectively to GC-rich binding sites and all have moieties that protrude into either the major or minor grooves (or both). Actinomycin is well-known and was the object of the epic Mueller and Crothers study1. Nogalamycin is well-known as a “threading” agent with moieties extending from its intercalation site into both the major and minor grooves36 The Iverson compounds11 are designed polyintercalating threading agents while nogalamycin is a monomeric threading agent. Nogalamycin, daunomycin, idarubicin and deoxydaunomycin (deoxyDM) are anthracycline antibiotics that feature an anthraquinone ring system that intercalates and daunosamine moieties that lie in the minor groove. One ring of TOTA (Trioxatriangulenium ion) extrudes into the major groove from its intercalation site, within bonding range of the DNA backbone and adjacent base pairs16. The key point in examining this cluster is that it arose from the impartial analysis of the complex landscape in figure 2 to reveal related compounds. Each cluster in the dendrogram could be similarly rationalized or analyzed to reveal unappreciated relationships between compounds. Interestingly, cluster “2” colored cyan shows a grouping of ethidium and propidium. These are classic intercalators that are distinguished from the members of cluster 1 by their lack of bulky groove-binding moieties and their weaker GC base pair selectivity.
Classic AT-selective groove-binding agents37 are clustered in the region labeled “3”. This region includes netropsin, berenil, and a large number of diamidine compounds from the Boykin/Wilson laboratory38. Other groove-binders cluster separately, evidently reflecting some subtle differences. For example, the cluster labeled “4” contains distamycin and DAPI which are commonly thought of as groove binders. Inspection of their individual binding profiles reveals that they differ from the compounds in cluster “3” only by their slightly higher affinities for GC-rich DNA, perhaps a consequence of their ability to switch to an intercalative binding mode to bind to GC base pairs39.
What is the utility of this analysis of the DNA binding landscape? First, it reveals sometimes subtle binding similarities among diverse compounds. The clusters might be further analyzed to produce pharmacophores characteristic of certain patterns of binding to provide fundamental information of use in the design of new nucleic acids binding agents with desired selectivity. Second, the analysis could be used to understand and classify newly discovered DNA binding compounds. By obtaining the new compounds binding profile in a competition dialysis experiment, it could then be clustered to compounds with similar properties in this library to provide clues about its probable binding mode and mechanism. The point here is not to analyze the dendrogram in figure 6 in exhaustive detail or to mine it for the extensive information that it contains. Rather, the point is to show how the simple concept and experiment devised by Mueller and Crothers has evolved to expand our understanding of DNA binding interactions.
Final Thoughts
Don Crothers was one of the smartest scientists I have ever known. It was a privilege to have benefited from his mentorship at a formative stage in career. His scientific and personal standards were impeccable and provided a model I tried to emulate. This brief account shows how one of Don’s simple ideas provided the seed for a fruitful line of research in my own laboratory, and continued to fuel insights into drug-DNA interactions long after he had left that field to move on to bigger and better things.
Supplementary Material
Acknowledgments
Supported by grants CA35635 and GM077422 from the National Institutes of Health.
References
- 1.Muller W, Crothers DM. J Mol Biol. 1968;35:251–290. doi: 10.1016/s0022-2836(68)80024-5. [DOI] [PubMed] [Google Scholar]
- 2.Crothers DM. Biopolymers. 1968;6:575–584. doi: 10.1002/bip.1968.360060411. [DOI] [PubMed] [Google Scholar]
- 3.McGhee JD, Hippel PH., v J Mol Biol. 1974;86:469–489. doi: 10.1016/0022-2836(74)90031-x. [DOI] [PubMed] [Google Scholar]
- 4.Muller W, Crothers DM. Eur J Biochem. 1975;54:267–277. doi: 10.1111/j.1432-1033.1975.tb04137.x. [DOI] [PubMed] [Google Scholar]
- 5.Muller W, Crothers DM, Waring MJ. Eur J Biochem. 1973;39:223–234. doi: 10.1111/j.1432-1033.1973.tb03120.x. [DOI] [PubMed] [Google Scholar]
- 6.Chaires JB. In: Advances in DNA Sequence Specific Agents. Hurley LH, editor. JAI Press, Inc.; Greenwich, CT: 1992. pp. 3–23. [Google Scholar]
- 7.Becker MM, Dervan PB. Journal of the American Chemical Society. 1979;101:3664–3666. [Google Scholar]
- 8.Chaires JB. J Biol Chem. 1986;261:8899–8907. [PubMed] [Google Scholar]
- 9.Ren J, Chaires JB. Biochemistry. 1999;38:16067–16075. doi: 10.1021/bi992070s. [DOI] [PubMed] [Google Scholar]
- 10.Alberti P, Ren J, Teulade-Fichou MP, Guittat L, Riou JF, Chaires J, Helene C, Vigneron JP, Lehn JM, Mergny JL. J Biomol Struct Dyn. 2001;19:505–513. doi: 10.1080/07391102.2001.10506758. [DOI] [PubMed] [Google Scholar]
- 11.Murr MM, Harting MT, Guelev V, Ren J, Chaires JB, Iverson BL. Bioorg Med Chem. 2001;9:1141–1148. doi: 10.1016/s0968-0896(00)00335-7. [DOI] [PubMed] [Google Scholar]
- 12.Ren J, Bailly C, Chaires JB. FEBS Lett. 2000;470:355–359. doi: 10.1016/s0014-5793(00)01335-1. [DOI] [PubMed] [Google Scholar]
- 13.Ren J, Chaires JB. Journal of the American Chemical Society. 2000;122:424–425. [Google Scholar]
- 14.Ren J, Chaires JB. Methods Enzymol. 2001;340:99–108. doi: 10.1016/s0076-6879(01)40419-8. [DOI] [PubMed] [Google Scholar]
- 15.Ren J, Qu X, Dattagupta N, Chaires JB. J Am Chem Soc. 2001;123:6742–6743. doi: 10.1021/ja015649y. [DOI] [PubMed] [Google Scholar]
- 16.Reynisson J, Schuster GB, Howerton SB, Williams LD, Barnett RN, Cleveland CL, Landman U, Harrit N, Chaires JB. J Am Chem Soc. 2003;125:2072–2083. doi: 10.1021/ja0211196. [DOI] [PubMed] [Google Scholar]
- 17.Murphy PM, Phillips VA, Jennings SA, Garbett NC, Chaires JB, Jenkins TC, Wheelhouse RT. Chemical communications. 2003:1160–1161. doi: 10.1039/b301554h. [DOI] [PubMed] [Google Scholar]
- 18.Chaires JB, Ren J, Henary M, Zegrocka O, Bishop GR, Strekowski L. Journal of the American Chemical Society. 2003;125:7272–7283. doi: 10.1021/ja034181r. [DOI] [PubMed] [Google Scholar]
- 19.Chaires JB, Ren J, Hamelberg D, Kumar A, Pandya V, Boykin DW, Wilson WD. J Med Chem. 2004;47:5729–5742. doi: 10.1021/jm049491e. [DOI] [PubMed] [Google Scholar]
- 20.Song G, Xing F, Qu X, Chaires JB, Ren J. J Med Chem. 2005;48:3471–3473. doi: 10.1021/jm050131g. [DOI] [PubMed] [Google Scholar]
- 21.Xing F, Song G, Ren J, Chaires JB, Qu X. FEBS letters. 2005;579:5035–5039. doi: 10.1016/j.febslet.2005.07.091. [DOI] [PubMed] [Google Scholar]
- 22.Wheelhouse RT, Jennings SA, Phillips VA, Pletsas D, Murphy PM, Garbett NC, Chaires JB, Jenkins TC. Journal of medicinal chemistry. 2006;49:5187–5198. doi: 10.1021/jm060315a. [DOI] [PubMed] [Google Scholar]
- 23.Holt PA, Ragazzon P, Strekowski L, Chaires JB, Trent JO. Nucleic Acids Research. 2009;37:1280–1287. doi: 10.1093/nar/gkn1043. [DOI] [PMC free article] [PubMed] [Google Scholar]
- 24.Wheelhouse RT, Garbett NC, Buurma NJ, Chaires JB. Angewandte Chemie. 2010;49:3207–3210. doi: 10.1002/anie.200907235. [DOI] [PMC free article] [PubMed] [Google Scholar]
- 25.Chaires JB. In: Current Protocols in Nucleic Acid Chemistry. Beaucage SL, Bergstrom DE, Glick GD, Jones RA, editors. John Wiley & Sons, Inc.; New York: 2002. pp. 8.3.1–8.3.8. [Google Scholar]
- 26.Chaires JB. Curr Med Chem Anti-Canc Agents. 2005;5:339–352. doi: 10.2174/1568011054222292. [DOI] [PubMed] [Google Scholar]
- 27.Chaires JB. In: DNA Binders and Related Subjects. Waring MJA, C JB, editors. Springer-Verl;ag; Berlin: 2005. pp. 33–54. [Google Scholar]
- 28.Ragazzon P, Chaires JB. Methods (San Diego, Calif) 2007;43:313–323. doi: 10.1016/j.ymeth.2007.08.003. [DOI] [PMC free article] [PubMed] [Google Scholar]
- 29.Ragazzon PA, Garbett NC, Chaires JB. Methods (San Diego, Calif) 2007;42:173–182. doi: 10.1016/j.ymeth.2006.09.010. [DOI] [PubMed] [Google Scholar]
- 30.Wheelhouse RT, Chaires JB. Methods Mol Biol. 2010;613:55–70. doi: 10.1007/978-1-60327-418-0_4. [DOI] [PMC free article] [PubMed] [Google Scholar]
- 31.Mergny JL, Lacroix L, Teulade-Fichou MP, Hounsou C, Guittat L, Hoarau M, Arimondo PB, Vigneron JP, Lehn JM, Riou JF, Garestier T, Helene C. Proc Natl Acad Sci U S A. 2001;98:3062–3067. doi: 10.1073/pnas.051620698. [DOI] [PMC free article] [PubMed] [Google Scholar]
- 32.Hounsou C, Guittat L, Monchaud D, Jourdan M, Saettel N, Mergny JL, Teulade-Fichou MP. ChemMedChem. 2007;2:655–666. doi: 10.1002/cmdc.200600286. [DOI] [PubMed] [Google Scholar]
- 33.Joung IS, Persil Cetinkol O, Hud NV, Cheatham TE., 3rd Nucleic acids research. 2009;37:7715–7727. doi: 10.1093/nar/gkp730. [DOI] [PMC free article] [PubMed] [Google Scholar]
- 34.Cetinkol OP, Hud NV. Nucleic acids research. 2009;37:611–621. doi: 10.1093/nar/gkn977. [DOI] [PMC free article] [PubMed] [Google Scholar]
- 35.Persil O, Santai CT, Jain SS, Hud NV. Journal of the American Chemical Society. 2004;126:8644–8645. doi: 10.1021/ja0492891. [DOI] [PubMed] [Google Scholar]
- 36.Williams LD, Egli M, Qi G, Bash P, van der Marel GA, van Boom JH, Rich A, Frederick CA. Proceedings of the National Academy of Sciences of the United States of America. 1990;87:2225–2229. doi: 10.1073/pnas.87.6.2225. [DOI] [PMC free article] [PubMed] [Google Scholar]
- 37.Bailly C, Chaires JB. Bioconjugate chemistry. 1998;9:513–538. doi: 10.1021/bc980008m. [DOI] [PubMed] [Google Scholar]
- 38.Wilson WD, Tanious FA, Ding D, Kumar A, Boykin DW, Colson P, Houssier C, Bailly C. Journal of the American Chemical Society. 1998;120:10310. [Google Scholar]
- 39.Wilson WD, Tanious FA, Barton HJ, Jones RL, Fox K, Wydra RL, Strekowski L. Biochemistry. 1990;29:8452–8461. doi: 10.1021/bi00488a036. [DOI] [PubMed] [Google Scholar]
Associated Data
This section collects any data citations, data availability statements, or supplementary materials included in this article.