

Abstract
Voltage-dependent potassium (Kv) channels are present in various cell types, including smooth muscle cells (myocytes) of resistance-sized arteries that control systemic blood pressure and regional organ blood flow. Intravascular pressure depolarizes arterial myocytes, stimulating calcium (Ca2+) influx through voltage-dependent Ca2+ (Cav) channels that results in vasoconstriction and also K+ efflux through Kv channels that oppose vasoconstriction. We hypothesized that pressure-induced depolarization may not only increase the open probability of plasma membrane–resident Kv channels but also increase the abundance of these channels at the surface of arterial myocytes to limit vasoconstriction. We found that Kv1.5 and Kv2.1 proteins were abundant in the myocytes of resistance-sized mesenteric arteries. Kv1.5, but not Kv2.1, continuously recycled between the intracellular compartment and the plasma membrane in contractile arterial myocytes. Using ex vivo preparations of intact arteries, we showed that physiological intravascular pressure through membrane depolarization or membrane depolarization in the absence of pressure inhibited the degradation of internalized Kv1.5 and increased recycling of Kv1.5 to the plasma membrane. Accordingly, by stimulating the activity of Cav1.2, membrane depolarization increased whole-cell Kv1.5 current density in myocytes and Kv1.5 channel activity in pressurized arteries. In contrast, the total amount and cell surface abundance of Kv2.1 were independent of intravascular pressure or membrane potential. Thus, our data indicate that intra-vascular pressure–induced membrane depolarization selectively increased Kv1.5 surface abundance to increase Kv currents in arterial myocytes, which would limit vasoconstriction.
INTRODUCTION
Intravascular pressure stimulates membrane depolarization in small, resistance-sized arteries, leading to the activation of smooth muscle cell (myocyte) voltage-dependent calcium (Ca2+) (Cav) channels, an increase in intracellular Ca2+ concentration ([Ca2+]i), and vasoconstriction (1, 2). Myocyte membrane depolarization also activates voltage-dependent potassium (K+) (Kv) channels, inducing a negative feedback mechanism that partially opposes depolarization and vasoconstriction (3–9). This “myogenic response” is an autoregulatory mechanism that modulates regional blood flow, systemic blood pressure, and sets a resting arterial diameter from which other stimuli can induce vasoconstriction or vasodilation.
Kv channels comprise a large family of ~40 proteins that are subdivided into 12 classes (Kv1 to Kv12) (10). The genes encoding several Kv channel family members are expressed, and the encoded proteins are functional in arterial myocytes, including Kv1.2, Kv1.5, Kv2.1, Kv2.2, Kv7.1, and Kv7.4 (5, 11–13). Functional channels may be composed of homomeric subunits or heteromultimeric Kv subunits, both of which are also present in arterial myocytes (7, 14). Membrane potential directly controls the open probability (PO) of surface Kv channels to modulate arterial contractility. However, cellular Kv current amplitude (I) is dependent not only on single-channel PO but also on the number of channels present in the plasma membrane (N) and single-channel amplitude (i), such that I = NPOi. Whether membrane potential regulates Kv channel surface abundance is unclear, and the role of multiple Kv channel subtypes in arterial myocytes is poorly understood. Conceivably, specific Kv channel subtypes may respond to distinct stimuli or perform specific physiological functions in arterial myocytes.
Here, we investigated the hypothesis that intravascular pressure and membrane potential modulate the abundance of functional Kv channels at the surface of myocytes of resistance-sized mesenteric arteries. Our data showed that pressure-induced membrane depolarization inhibited Kv1.5 channel degradation, stimulated Kv1.5 surface abundance, and enhanced Kv1.5 currents in arterial myocytes. In contrast, the amount of Kv2.1 at the myocyte surface was unaffected by intravascular pressure in these arteries. We also show that the pressure-induced increase of Kv1.5 channel surface abundance reduced arterial contractility. Thus, our data demonstrated that membrane depolarization activated Kv1.5 currents through two distinct pathways in arterial myocytes: (i) direct channel activation and (ii) subtype-specific enhancement of Kv channel abundance at the cell surface.
RESULTS
The gene encoding Kv1.5 is highly expressed relative to other Kv channel members in mesenteric artery myocytes
We performed reverse transcription polymerase chain reaction (PCR) on freshly isolated mesenteric artery myocytes and quantified the relative expression of six Kv channel family members that are expressed in arterial myocytes (11–13). Analysis of transcripts encoding myosin heavy chain 11 (a myocyte marker), platelet endothelial cell adhesion molecule-1 (an endothelial cell marker), and fatty acid–binding protein 4 (adipocyte marker) served as controls for the purity of the myocyte preparations. We only detected the transcript encoding myosin heavy chain 11 in the preparations, indicating that complementary DNA (cDNA) was from pure myocytes (fig. S1A). Quantitative PCR analysis indicated that of the transcripts encoding the six Kv channel subtypes measured (fig. S1B), mRNAs encoding Kv1.5 accounted for ~60%, Kv2.1 and Kv2.2 each accounted for ~15%, and Kv1.2, Kv7.1, and Kv7.4 together represented ~10% of the Kv transcripts (Fig. 1A). Because the genes encoding Kv1.5 and Kv2.1 were most highly expressed, we focused on the regulation of these channels to pressure and membrane potential in arterial myocytes.
Fig. 1. Arterial isolation leads to a decrease in total and surface Kv1.5.
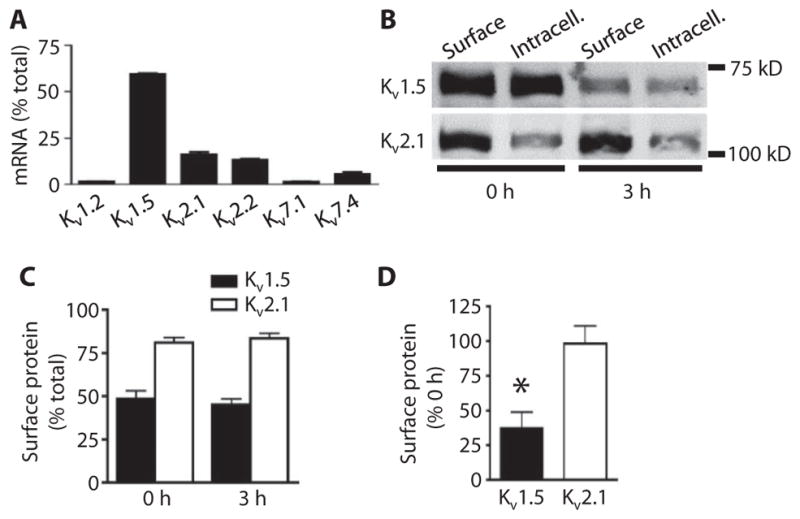
(A) Quantitative real-time PCR mean data for transcripts of six Kv family members in pure arterial myocytes. n = 3 for each. Data are expressed as the percent of total Kv transcripts. (B) Representative Western blot images of arterial biotinylation samples showing the nonbiotinylated [intracellular (Intracell.)] and biotinylated (Surface) abundance of Kv1.5 and Kv2.1 in mesenteric arteries immediately after (0 hour) and 3 hours after arterial isolation. (C) Mean data showing the percent of total Kv1.5 and Kv2.1 at the cell surface for arteries immediately and 3 hours after isolation. n = 6 for each. (D) Mean data showing percent of Kv1.5 and Kv2.1 remaining at the cell surface after 3 hours relative to the 0-hour samples. n = 6 for each. *P < 0.05 versus 0 hour.
Arterial isolation leads to loss of surface Kv1.5, but not Kv2.1, channels
To measure the amount of Kv1.5 and Kv2.1 channels at the plasma membrane in arterial myocytes, we used surface biotinylation after confirming the specificity of the antibodies for these proteins when expressed in human embryonic kidney (HEK) 293 cells (fig. S2, A and B). The Kv1.5- and Kv2.1-specific antibodies did not detect any proteins in mock-transfected HEK293 cells (fig. S2, A and B). Each antibody detected proteins in arterial lysates, and the most intense bands were at similar molecular weights to their recombinant counterparts (fig. S2C). The lower molecular weight bands may be subunit cleavage products.
Freshly isolated (assayed immediately after isolation, 0 hour) mesenteric arteries had ~48% of total Kv1.5 and ~81% of total Kv2.1 channels at the cell surface (Fig. 1, B and C). We examined the time-dependent effects of the loss of intravascular pressure due to arterial isolation on the relative amounts of Kv1.5 and Kv2.1 at the myocyte surface. Three hours after arterial isolation and maintenance at 37°C, the amount of Kv1.5 at the cell surface was ~37% of that in freshly isolated (0 hour) arteries (Fig. 1, B and D). The total amount of Kv1.5 also decreased during 3 hours without pressure, but the relative amount of Kv1.5 at the cell surface compared to the total amount of Kv1.5 was unchanged (Fig. 1, B and C). In contrast, both the amount of Kv2.1 at the surface and the relative cellular distribution of Kv2.1 were unchanged after 3 hours without pressure (Fig. 1, B to D). These data indicated that arterial isolation reduced the amount of Kv1.5 at the cell surface but did not alter Kv2.1 surface protein or the relative cellular distribution of Kv1.5 or Kv2.1 channels in myocytes.
Arterial isolation leads to time-dependent decrease in total Kv1.5 but not Kv2.1
After arterial isolation, we found that surface Kv1.5 decreased, but the abundance of the protein in the intracellular fraction did not increase, suggesting that the internalized Kv1.5 was degraded. We monitored the abundance of total Kv1.5 and Kv2.1 from isolation through 18 hours to investigate the differences in stability of the proteins in depressurized vessels. One hour after arterial isolation, total Kv1.5 was similar to that in freshly isolated arteries (Fig. 2, A and B). In contrast, 3 hours after arterial isolation, total Kv1.5 was ~33% of that in the freshly isolated arteries, and this reduction was maintained for 18 hours, the longest time point measured (Fig. 2, A and B). In contrast, total Kv2.1 did not change up to 18 hours after arterial isolation (Fig. 2, A and B). Quantitative analysis of transcript abundance showed that 3 hours after arterial isolation, Kv1.5- and Kv2.1-encoding mRNAs were similar to those in freshly isolated arteries, indicating that the reduction in Kv1.5 protein was not due to a decrease in mRNA for Kv1.5 (Fig. 2C). These data indicated that, in the absence of pressure, isolated artery Kv1.5, but not Kv2.1, is internalized and degraded within 3 hours.
Fig. 2. Bafilomycin and MG132 prevent Kv1.5 loss in mesenteric arteries.

(A) Representative Western blot images of total Kv1.5 and Kv2.1at 0, 1, and 3 hours of isolation. (B) Quantification of total Kv1.5 and Kv2.1 at the indicated times after isolation. n = 5 for the 1-hour group, n = 6 for the remaining groups. *P < 0.05 versus 0 hour. (C) Quantitative PCR data expressed as the percent of transcripts for each channel remaining after 3 hours with the amount of transcript at 0 hour set at 100%. n = 3 for each. (D) Representative Western blots and quantification of total Kv1.5 and Kv2.1 0 and 3 hours after arterial isolation, and the effect of bafilomycin (Baf; 50 nM) or MG132 (10 μM). n = 6 for each. *P < 0.05 versus 0 hour. (E) Representative Western blot images of arterial biotinylation samples showing the abundance of surface and intracellular Kv1.5 and Kv2.1 at 0 and after 3 hours of arterial isolation in the presence of bafilomycin. (F) Mean data showing the percent of total Kv1.5 and Kv2.1 at the cell surface for arteries immediately and 3 hours after isolation. n = 5 for each. (G) Mean data showing percent of Kv1.5 and Kv2.1 remaining at the cell surface after 3 hours in the presence of bafilomycin relative to the 0-hour samples. n = 5 for each.
Internalized proteins are either degraded in lysosomes, by the proteasome, or both degradation pathways may contribute. Arteries were placed in physiological saline solution (PSS) containing bafilomycin, an inhibitor of lysosomal degradation, or MG132, a blocker of proteasomal degradation, immediately after isolation to determine which pathways contributed to Kv1.5 instability in the unpressurized arteries. Either inhibitor prevented the reduction in total Kv1.5, with bafilomycin more effective than MG132 (Fig. 2D). Neither inhibitor affected the amount of Kv2.1 (Fig. 2D) or the relative surface/intracellular distribution of either Kv1.5 or Kv2.1 (Fig. 2, E and F). Bafilomycin completely prevented the loss of Kv1.5 from the cell surface 3 hours after isolation and depressurized conditions (Fig. 2G). These data indicated that, after arterial isolation, myocyte Kv1.5 is degraded by both the lysosomal and proteasomal pathways. Blocking either of these intracellular degradation pathways maintained Kv1.5 at the myocyte surface.
Intravascular pressure–induced membrane depolarization prevents arterial myocyte Kv1.5 loss and degradation
We hypothesized that intravascular pressure regulates Kv1.5 degradation and surface abundance. Pressurizing mesenteric arteries to 80 mmHg for 3 hours inhibited the reduction in total Kv1.5 (Fig. 3A) and limited the loss of Kv1.5 from the cell surface (Fig. 3, B and C), when compared to 0-hour controls. In contrast, the cell surface and total amounts of Kv1.5 were reduced in arteries maintained at 10 mmHg for 3 hours compared with that in 0-hour controls (Fig. 3, A to C). Intravascular pressure did not alter total or surface Kv2.1 (Fig. 3, A to C) or the relative surface/intracellular distribution of Kv1.5 or Kv2.1 (Fig. 3, B and D). These data indicated that intravascular pressure controls Kv1.5 degradation.
Fig. 3. Intravascular pressure inhibits Kv1.5 degradation and maintains surface expression.
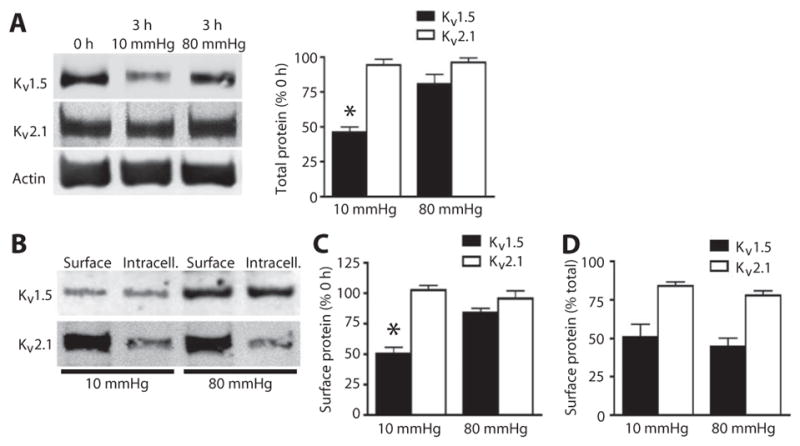
(A) Representative Western blots and quantitative data of total Kv1.5 and Kv2.1 in control arteries (0 hour) or arteries exposed to 10 or 80 mmHg intravascular pressure for 3 hours. (B) Representative Western blot of arterial biotinylation samples showing the abundance of surface and intracellular Kv1.5 and Kv2.1. (C) Mean data showing the percent of Kv1.5 and Kv2.1 at the cell surface compared to the amount at isolation (0 hour) after 3 hours at 10 and 80 mmHg intravascular pressure. (D) Mean data showing the percent of Kv1.5 and Kv1.2 at the cell surface as a percent of the total of each channel protein in arteries exposed to the indicated pressure for 3 hours. For all quantitative data, n = 5 for each group and *P < 0.05 versus 0 hour.
Intravascular pressure stimulates membrane depolarization (1). To investigate regulation of Kv channel degradation by membrane potential, we compared the effects of an increase in K+ in the PSS from 6 to 30 mM K+ to depolarize arteries from ~−60 to ~−40 mV. This voltage shift is similar to that which occurs in arteries when increasing pressure from 0 mmHg to physiological intravascular pressure (2, 15). Whereas the 6 mM K+ solution was ineffective at stabilizing Kv1.5, the 30 mM K+ solution prevented the isolation-induced reduction in total and surface Kv1.5 (Fig. 4, A to C), as determined by Western blotting and cell surface biotinylation. In contrast, 30 mM K+ did not alter total or surface amounts of Kv2.1 (Fig. 4, A to C) or the relative cellular distribution of Kv1.5 or Kv2.1 channels (Fig. 4, B and D). To test the hypothesis that Kv1.5 is trafficked between the surface and internal pools in arterial myocytes, we also analyzed the amount of Kv1.5 at the cell surface by immunofluorescence colocalization with wheat germ agglutinin, a plasma membrane marker (Fig. 4E). The 30 mM K+ pre- vented the isolation-induced reduction of surface Kv1.5 in myocytes (Fig. 4E). These data indicated that membrane depolarization inhibits Kv1.5 channel internalization and degradation in mesenteric artery myocytes.
Fig. 4. Membrane depolarization maintains Kv1.5 at the cell surface.

(A) Representative Western blots and quantitative data of total Kv1.5 and Kv2.1 in arteries exposed to 6 or 30 mM K+ PSS for 3 hours. n = 6 for each. *P < 0.05 versus 0 hour. (B) Western blot of arterial biotinylation samples showing the abundance of surface andintracellular Kv1.5 and Kv2.1 from arteries exposed to 6 or 30 mM K+ PSS for 3 hours. (C) Mean data showing the percent of Kv1.5 and Kv2.1 at the cell surface compared to the amount at isolation (0 hour) after 3 hours in 6 or 30 mM K+ PSS. n = 6 for each. *P < 0.05 versus 0 hour. (D) Mean data showing Kv1.5 and Kv2.1 at the cell surface as a percent of the total of each channel protein in arteries after 3 hours in 6 or 30 mM K+ PSS. n = 5 for each. (E) Immunofluorescence images and quantitative analysis of colocalization of wheat germ agglutinin (WGA) (green) and Kv1.5 (red) in myocytes isolated from arteries at 0 or 3 hours after maintenance in either 6 or 30 mM K+ PSS. Yellow is pixel colocalization analyzed using the RG2B plug-in for ImageJ. Scale bars, 5 μm. n = 7 for each. *P < 0.05 versus 0 hour.
Voltage-dependent Ca2+ channel activity controls arterial myocyte Kv1.5 channel degradation
Membrane depolarization stimulates Kv channels, which increases K+ current mediated by the efflux of K+ ions, and Cav channels, which permits Ca2+ influx, increasing [Ca2+]i (1–9). To investigate contributions of intravascular pressure–induced depolarization and depolarization-induced Ca2+ influx to Kv1.5 degradation and surface abundance, we applied nimodipine, a Cav channel blocker to arteries maintained at 10 or 80 mmHg or in the presence of 6 or 30 mM K+ PSS. Nimodipine blocked both pressure- and depolarization-induced stabilization of Kv1.5 (Fig. 5, A and B). In arterial myocytes, depolarization-induced Ca2+ influx stimulates ryanodine-sensitive Ca2+-release (RyR) channels, leading to release of Ca2+ from the sarcoplasmic reticulum (16). Ryanodine, an RyR channel inhibitor, did not alter depolarization-induced stabilization of Kv1.5 (Fig. 5B). Bay K8644, a Cav channel activator, partially prevented isolation-induced Kv1.5 degradation that occurred after 3 hours in depressurized conditions (Fig. 5C). Nimodipine, ryanodine, and Bay K8644 did not change Kv2.1 abundance (Fig. 5, A to C). These data indicated that physiological intravascular pressure and depolarization-induced Cav channel activation inhibits Kv1.5 degradation in arterial myocytes.
Fig. 5. Voltage-dependent Ca2+ channel activity controls Kv1.5 channel degradation.

(A) Representative Western blots and quantitative data showing the amount of total Kv1.5 and Kv2.1 in arteries exposed to 10 and 80 mmHg intravascular pressure for 3 hours in the presence or absence of nimodipine (Nimo; 1 μM). n = 5 for each. *P < 0.05 versus 0 hour. (B) Western blot and quantitative data showing the amount of total Kv1.5 or Kv2.1 in arteries maintained for 3 hours in 6 or 30 mM K+ PSS in the presence or absence of nimodipine (1 μM) or ryanodine (Ryn; 10 μM). n = 6 for each. *P < 0.05 versus 0 hour. (C) Western blot and quantitative data showing the amount of total Kv1.5 and Kv2.1 from arteries exposed to 6 mM K+ PSS for the indicated times with or without Bay K8644 (BayK; 100 nM). n = 5 for each. *P < 0.05 versus 0 hour, #P < 0.05 versus 3 hour.
We tested the hypothesis that Kv1.5 continuously recycles and that voltage-dependent Ca2+ influx inhibits both internalization and degradation, thereby enhancing surface abundance. Concanavalin A, an internalization inhibitor, prevented isolation-induced degradation of Kv1.5 at 3 hours, with-out affecting Kv2.1 (Fig. 6A). Concanavalin A also increased the proportion of total Kv1.5 that was located in the plasma membrane from ~45 to 72% in 6 mM K+ PSS and from ~48 to 74% in 30 mM K+ PSS (Fig. 6B). These data suggested that Kv1.5 channels continuously recycle to and from the plasma membrane and that membrane potential does not directly control this process. Instead, Cav-mediated Ca2+ influx inhibits Kv1.5 degradation to enhance Kv1.5 surface abundance.
Fig. 6. Concanavalin A prevents Kv1.5 degradation and increases surface abundance.
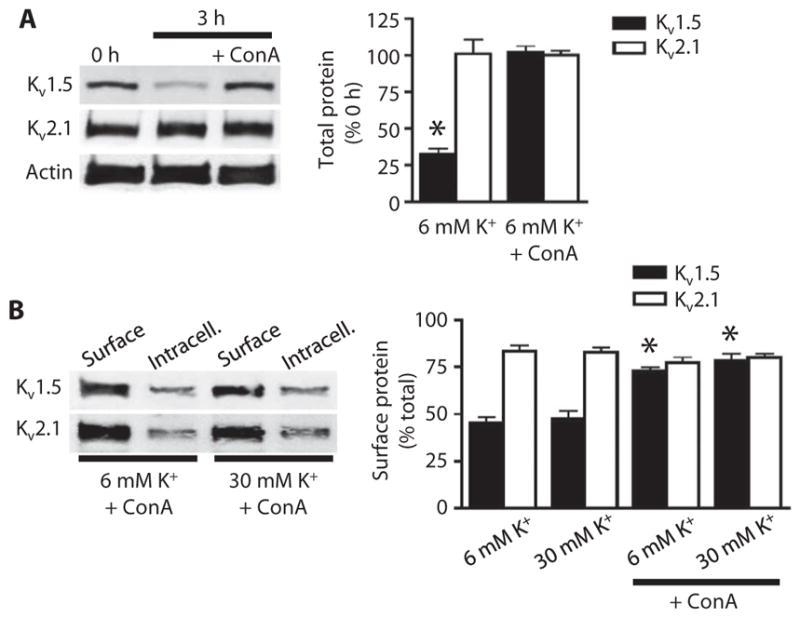
(A) Representative Western blot and quantitative data showing the amount of total Kv1.5 and Kv2.1 in arteries at 0 hour, 3 hours after isolation, and 3 hours after isolation with concanavalin A (ConA; 10 μM). n = 4 for each. *P < 0.05 versus 0 hour. (B) Western blot of arterial biotinylation samples showing the abundance of surface and intracellular Kv1.5 and Kv2.1 from arteries 3 hours after isolation in 6 or 30 mM K+ PSS in the presence or absence of ConA. Mean data show the percentage of total Kv1.5 or Kv2.1 located at the cell surface. n = 5 for each. *P < 0.05 versus respective samples in the absence of ConA.
Kv1.5 degradation reduces whole-cell Kv1.5 currents in arterial myocytes
We analyzed the effect of Kv1.5 abundance on myocytes isolated from mesenteric arteries by patch-clamp electrophysiology using conditions designed to isolate whole-cell Kv currents and reduce contamination from other current types, including that from large-conductance Ca2+-activated K+ channels. Mean Kv current density (at +50 mV) in myocytes from arteries isolated for 3 hours was significantly lower than the Kv current density in myocytes from freshly isolated (0 hour) arteries (Fig. 7, A to C). To evaluate the portion of the total Kv current that was mediated by Kv1.5-containing channels, we applied Psora-4, a Kv1.5 channel inhibitor (17), to myocytes and monitored the Psora-4–sensitive current (Fig. 7A). Psora-4 reduced the mean current density in freshly isolated myocytes from ~25.5 to ~8.8 pA/pF (Fig. 7, B and C), suggesting that Kv1.5-containing channels carried ~65% of the current at +50 mV. In contrast, the effect of Psora-4 on the current at +50 mV in myocytes 3 hours after isolation was less, reducing the current density from ~12.6 to ~8.9 pA/pF (~29%) (Fig. 7, A to C). Bafilomycin prevented the isolation-induced reduction in total Kv current and the decrease in Psora-4–sensitive currents in myocytes (Fig. 7, A to C). We obtained similar results with diphenyl phosphine oxide-1 (DPO-1) (Fig. 7, B and C), a putative Kv1.5 channel–specific inhibitor (18, 19). These data indicated that Kv1.5-containing channels are a major contributor to whole-cell Kv currents and that isolation-induced Kv1.5 degradation reduces Kv1.5-mediated current density in arterial myocytes.
Fig. 7. Arterial isolation reduces Psora-4– and DPO-1–sensitive whole-cell Kv currents in arterial smooth muscle cells.

(A) Representative Kv current recordings and the effect of Psora-4 (100 nM) in myocytes either isolated immediately from arteries (0 hour) or 3 hours after isolation and maintenance at 37°C without (3 hour) or with 50 nM bafilomycin (3 hours + Baf). Bottom panel shows voltage step protocol and scale. (B) Mean current-voltage relationships for whole-cell (top, n = 12 for each), Psora-4 (100 nM)–sensitive (n = 5 to 6), and DPO-1 (1 μM)–sensitive (n = 5 to 6) currents at time points indicated with and without bafilomycin. (C) Mean current density values at +50 mV. *P < 0.05 versus 0 hour.
Intravascular pressure stimulates functional Kv1.5 channels in mesenteric arteries
To test the hypothesis that intravascular pressure controls the amount of functional Kv1.5 channels in arterial myocytes, we performed arterial myography on pressurized single third-order, abluminal mesenteric arteries in the presence of Psora-4 or the general Kv inhibitor 4-aminopyridine (4-AP). The arteries were maintained in a temperature-controlled perfusion chamber at pre-experimental intravascular pressures of either 10 or 80 mmHg for 3 hours. Arteries maintained at 10 mmHg pre-experimental pressure were then pressurized to 80 mmHg to stimulate the development of myogenic tone. Arteries in the 80 mmHg pre-experimental pressure group were continued at 80 mmHg, providing an equivalent time course for both experimental groups. Arteries from either the 10 or the 80 mmHg group responded to Psora-4 or 4-AP with a reduction in diameter, indicating vessel constriction (Fig. 8A). However, Psora-4 stimulated the contraction of arteries from the 80 mmHg pre-experimental pressure group by ~29 μm and from the 10 mmHg pre-experimental pressure group by ~10 μm, which was ~65% less (Fig. 8, A and B). As expected, 4-AP caused a greater reduction in diameter, consistent with a stronger constriction response when more classes of Kv channel were inhibited, than that observed for Psora-4 (Fig. 8B). However, both Psora-4 and 4-AP produced significantly greater constriction responses in the 80 mmHg pre-experimental pressuregroup, consistent with pressure maintaining Kv channels and Kv1.5-containing channels at the cell surface to counter vasoconstriction.
Fig. 8. Intravascular pressure maintains functional Kv1.5 channels in arterial myocytes.
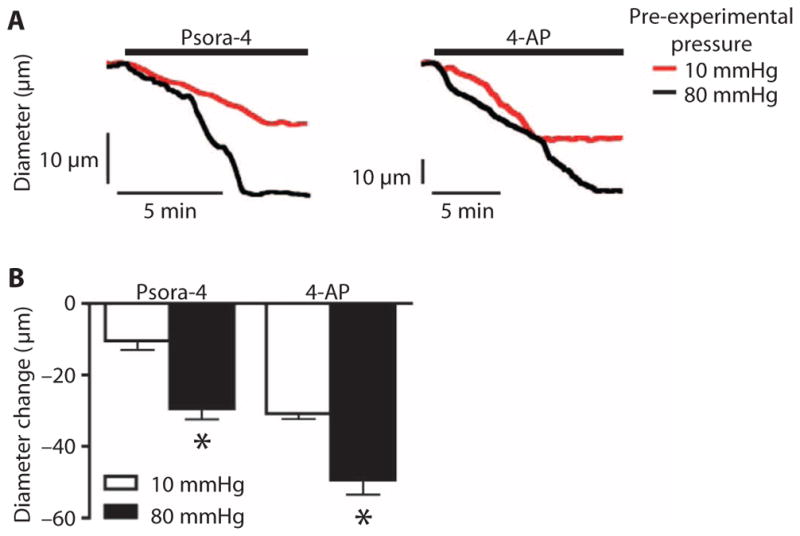
(A) Representative diameter traces showing vasoconstriction induced by Psora-4 (100 nM) or 4-AP (1 mM) at 80 mmHg for arteries maintained for 3 hours at pre-experimental pressures indicated. (B) Mean data showing the reduction in diameter in arteries exposed to the indicated drugs and held at the indicated pre-experimental pressures. n = 5 for each. *P < 0.05 versus 10 mmHg pre-experimental pressure group.
DISCUSSION
Myogenic responsiveness requires a balance of ion channels that mediate the vasoconstriction response and those that mediate vasodilation. As critical mediators of membrane hyperpolarization, Kv channels are components that counter vasoconstriction in response to depolarization. Here, we found that membrane potential selectively controls the amount of functional Kv1.5-containing channels at the myocyte surface (N, the number of channels) to modulate Kv currents and, hence, vasoconstrictive tone in resistance-sized arteries. Quantitative PCR experiments revealed that Kv1.5-encoding mRNA accounts for most Kv channel transcripts in mesenteric artery myocytes. Our data indicated that Kv1.5 continuously recycled between the intracellular compartment and the plasma membrane and that membrane potential through Ca2+ signaling modulated Kv1.5 surface abundance in arterial myocytes. Loss of intravascular pressure and the associated membrane hyperpolarization stimulated degradation of internalized Kv1.5 through a mechanism dependent on both proteasomal and lysosomal pathways, resulting in a reduction in both total and plasma membrane–localized Kv1.5. We propose that physiological membrane depolarization activates Cav channels, which inhibited Kv1.5 degradation, enabling the internalized Kv1.5-containing channels to return to the plasma membrane. Our data indicated that the regulation of Kv1.5 degradation by intravascular pressure and membrane potential determined Kv1.5 current density and functionality. In contrast, Kv2.1, another Kv channel subtype detected in arterial myocytes, did not appear to internalize over the same time course, and total and surface proteins were not modulated by intravascular pressure, membrane potential, or Cav channel activity. Mechanisms that underlie the Kv1.5 specificity of this regulatory pathway may involve amino acid sequence dissimilarity of the channel proteins, differences in regulation by auxiliary subunits, or modulation by signal messengers. In summary, our data indicated that intravascular pressure selectively controls functional Kv1.5 surface abundance to regulate myocyte K+ currents and arterial contractility.
Membrane depolarization activates Cav channels in arterial myocytes, leading to an increase in [Ca2+]i and vasoconstriction (1, 2). Concomitant Kv channel activation limits depolarization and, thus, Cav channel activity and the associated vasoconstriction (1, 2). Here, our data showed that physiological intravascular pressure and membrane depolarization inhibit Kv1.5 degradation by activating Cav channels. In contrast, ryanodine did not inhibit depolarization-induced Kv1.5 protection. In arterial myocytes, Cav channel activation leads to global, nanomolar increases in [Ca2+]i, whereas ryanodine receptors generatelocalized, micromolarintracellular Ca2+transients, termed Ca2+ sparks, and propagating cytosolic Ca2+ waves. Thus, our data indicated that the global nanomolar increase in [Ca2+]i inhibited Kv1.5 degradation, which may involve Ca2+-sensing proteins, such as Ca2+/calmodulin (20,21), that have affinities for Ca2+ in the nanomolar range. Evidence exists linking Kv channels and calmodulin because apocalmodulin associateswith Kv7 channels in neurons to promote trafficking to the axonal surface (22). Cells degrade proteins through lysosomal and proteasomal pathways (23, 24). Here, inhibitors of either lysosomal or proteasomal degradation stabilized Kv1.5, suggesting that lysosomal and proteasomal pathways act in series, rather than in parallel, to degrade Kv1.5 in arterial myocytes. In summary, our data indicated that membrane depolarization stimulates Kv channels both directly through voltage-dependent activation and indirectly by inhibiting Kv1.5 channel degradation.
Although the detailed mechanisms that control Kv channel trafficking in arterial myocytes are unclear, experiments with concanavalin A, an internalization inhibitor, suggested that Kv1.5 constantly recycles to the plasma membrane through a membrane potential–independent mechanism. Concanavalin A prevented the loss of 65% of total Kv1.5, suggesting that this amount of the protein may be available for internalization and either recycling to the plasma membrane or degradation. Degradation inhibitors prevented loss of both surface and total Kv1.5 proteins. Because the cell surface/intracellular ratio of Kv1.5 was similar in pressurized and nonpressurized arteries, our data suggested that membrane potential controls Kv1.5 degradation but does not appear to regulate surface trafficking or internalization in arterial myocytes. In HL-1 mouse atrial myocytes, H9c2 rat cardiac myoblasts, and HEK293 cells stably expressing Kv1.5, constitutively internalized Kv1.5 is recycled to the plasma membrane through a Rab4- and Rab11-dependent pathway, implicating involvement of both recycling and early endosomes (25, 26). In HL-1 cells exposed to oxidative stress, internalized Kv1.5 colocalized with heat shock protein 70, a chaperone that targets misfolded proteins for ubiquitylation and degradation (27, 28). Oxyhemoglobin also reduced the abundance of Kv1.5 at the cell surface through a protein tyrosine kinase–dependent endocytosis mechanism in rabbit cerebral artery myocytes (29). Future experiments should be designed to elucidate trafficking mechanisms by which membrane potential regulates Kv1.5 degradation and surface abundance in arterial myocytes.
Several studies have provided insights into trafficking as a mechanism to regulate ion channel function in arterial myocytes (30–33). Trafficking of Cav1.2 to the surface in arterial myocytes requires the α2δ-1 auxiliary subunit (30). The abundance of both subunits at the cell surface is increased in rats with genetic hypertension, which increases Cav1.2 current density and produces a non-inactivating current that stimulates vasoconstriction (30). Pharmacological and molecular targeting of α2δ-1 reduces Cav1.2 surface abundance in arterial myocytes, leading to vasodilation (30, 34). Protein kinase Cδ increases the surface abundance of TRPM4, a melastatin transient receptor potential channel, in cerebral artery myocytes (32). Rapid delivery of large-conductance Ca2+-activated K+ (BK) channel β1 subunits to the cell surface activates BK channels, leading to vasodilation (33). This pathway is activated by nitric oxide and is a mechanism by which this endothelium-derived factor activates BK channels to dilate cerebral arteries (33). Here, we showed that intravascular pressure, by controlling membrane potential, selectively enhanced the abundance of functional Kv1.5-containing channels at the myocyte surface. Myocyte Kv1 versus Kv2 function may exhibit some vascular bed specificity, suggesting that the regulated trafficking pathway described here may be more prominent in some vessels than others (3, 4, 14). Similarly, Kv channels in arterial myocytes can comprise heteromultimers containing Kv1.5 or other subunits (7, 14). Regulated Kv1.5 trafficking may not only alter the surface expression of Kv1.5 homomultimeric channels but also modulate Kv channel heteromultimer formation. Future studies should be designed to investigate these hypotheses and mechanisms of trafficking of other Kv subunits that are present in arterial myocytes (13). In atrial myocytes, increased mechanical stress activates an integrin signaling pathway, leading to an increase in functional surface Kv1.5 channels (35). Whether there is overlap in mechanisms by which pressure and shear stress increase the abundance of functional Kv1.5 at the surface of arterial and atrial myocytes is unclear. Together, these studies indicate that multiple, unique trafficking pathways, which differ with respect to time course and mechanisms involved, exist to modulate the activity of different ion channels in myocytes, thereby controlling vascular contractility.
Patch-clamp electrophysiology and myography in the presence of Kv1.5 channel blockers supported the biochemical evidence that changes in Kv1.5 surface abundance control myocyte Kv currents and pressurized artery contractility. Psora-4, a Psoralen compound, blocks Kv1.3 and Kv1.5 channels with similar low nanomolar potency but is a less effective blocker of other Kv1 family members (17). There is little to no evidence for expression of the Kv1.3-encoding gene or Kv1.3 function in contractile arterial myocytes, with studies supporting the presence of Kv1.2, Kv1.5, and Kv1.6 members of the Kv1 family in this cell type (3, 7, 17, 36, 37). Psoralens are also weak blockers of Kv2, Kir2.1, Cav1.2, and BK channels, which are present in arterial myocytes but at concentrations 25 to 150 times higher than those used here (8, 17, 33, 34, 38). DPO-1 binds to the open state of Kv1.5 channels, and high selectivity for Kv1.5 over Ito, IK1, IKr, IKs, and Kv3.1 has been reported in cardiac myocytes (18, 19). Thus, the data with Psora-4 and DPO-1 indicated that changes in intravascular pressure affect the abundance of functional Kv1.5 channels at the cell surface of arterial myocytes to control Kv currents and vascular tone.
MATERIALS AND METHODS
Tissue preparation and cell isolation
Animal protocols were reviewed and approved by the Animal Care and Use Committee of the University of Tennessee Health Science Center (UTHSC). Male Sprague-Dawley rats (200 to 250 g body mass) were euthanized with sodium pentobarbital (150 mg/kg). The mesenteric artery bed was removed and placed into ice-cold PSS that contained 112 mM NaCl, 6 mM KCl, 24 mM NaHCO3, 1.8 mM CaCl2, 1.2 mM MgSO4, 1.2 mM KH2PO4, and 10 mM glucose, gassed with 21% O2, 5% CO2, and 74% N2 (pH 7.4).
Individual third- and fourth-order mesenteric arteries (~100 to 200 μm in diameter) were cleaned of adventitial tissue in ice-cold PSS and were dissected for experiments. Arteries were maintained at 37°C for 3 hours in 6 or 30 mM K+ PSS in the absence or presence of bafilomycin, MG132, nimodipine, ryanodine, Bay K8644, or concanavalin A as required.
Myocytes were dissociated from mesenteric arteries in isolation solution containing 55 mM NaCl, 80 mM sodium glutamate, 5.6 mM KCl, 2 mM MgCl2, 10 mM Hepes, 10 mM glucose, with pH adjusted to 7.4 with NaOH, with papain (0.7 mg/ml), dithioerythreitol (1 mg/ml), and bovine serum albumin (BSA) (1 mg/ml) for 15 to 20 min at 37°C. Arteries were then immediately transferred to isolation solution containing collagenase F (0.66 mg/ml), collagenase H (0.33 mg/ml), BSA (1 mg/ml), and 100 μM CaCl2 at 37°C for 5 to 10 min. Arteries were washed in ice-cold isolation solution and triturated with a fire-polished glass Pasteur pipette to yield single myocytes.
Cell culture and transfection
HEK293 cells were maintained in Dulbecco’s modified Eagle’s medium supplemented with 10% fetal bovine serum and 1% penicillin-streptomycin under standard tissue culture conditions (37°C, 21% O2/5% CO2). HEK293 cells were transiently transfected using Effectene (Qiagen) with pRBG4 encoding full-length rat Kv1.5 [a gift from J. Trimmer, University of California (UC) Davis], pEGFP-N1 encoding full-length mouse Kv1.5 tagged with green fluorescent protein (a gift from J. Nerbonne, Washington University, St. Louis), or pCMV6 encoding full-length mouse Kv2.1 (a gift from K. O’Connell, UTHSC, Memphis). Cells were used 72 hours after transfection.
Quantitative real-time PCR
Total RNAwas prepared from ~500 isolated myocytes, individually selected using an enlarged patch pipette and a microscope as we have described previously (39), or from whole mesenteric arteries. First-strand cDNA was synthesized through reverse transcription PCR with AffinityScript Multiple Temperature Reverse Transcriptase (Stratagene). Quantitative PCR was then performed with TaqMan hydrolysis probes (Roche) on a Roche Light-Cycler 480 thermal cycler using the following protocol: 95°C for 5 min, then 40 cycles of 95°C for 10 s, 60°C for 30 s, and 72°C for 10 s. Each PCR contained 5 μl of TaqMan LightCycler 480 Master Mix, 0.1 μl of forward primer, 0.1 μl of reverse primer, 0.1 μl of the hydrolysis probe, 2 μl of cDNA template, and 2.7 μl of ribonuclease-free water. A negative control lacking cDNA template was performed in each experiment. Relative mRNA abundance was calculated as the difference in threshold (Ct) values (ΔCt) of each Kv isoform using the ΔCt method. Fold changes in Kv1.5 and Kv2.1 mRNA were calculated as 100 × (2− ΔΔCt), where ΔΔCt is the difference between the ΔCt values. Myh11 was used as the reference gene. Primer sequences and probes were as follows: Kv1.2: GGAAGAGAACCTCAGCTCCTG (forward), AGACCCAGAGCCTTCTGTGA (reverse), probe #75; Kv1.5: AGGCTCCTCAGGATGCAG (forward), GCAACCCGGAGATGTTTATG (reverse), probe #9; Kv2.1: TGCTGTGCAGAGAAGAGGAA (forward), GGACGATGAACATGATCGAG (reverse), probe #120; Kv2.2: TGCCCAGAGAAAAGGAAGAA (forward), TAGACACGATGGCCAGGAT (reverse), probe #67; Kv7.1: GCGAGATGTCATCGAGCAG (forward), TTCCCGATGGACTGATCC (reverse), probe #81; K v 7.4: TGTTGGGATCGGTGGTCTA (forward), GAAGATGAGCACCAG-GAACC (reverse), probe #17; and Myh11: CCTGCTAGTCCACCCCAGTA (forward), ACTGAGCTGCCCTTTCTGTG (reverse), probe #119. PCR products were separated on 1.5% agarose gels.
Surface biotinylation
Mesenteric arteries were incubated for 1 hour at 4°C with EZ-Link Sulfo-NHS-LC-LC-Biotin and EZ-Link Maleimide-PEG2-Biotin (1 mg/ml each) (Thermo Scientific) in phosphate-buffered saline (PBS) (Gibco). Unbound biotin was quenched with glycine, and arteries were washed with PBS. Arteries were then homogenized in radioimmunoprecipitation assay (RIPA) buffer with 1% Triton X, and biotinylated surface proteins were separated using avidin beads in spin columns. Biotinylated proteins were eluted from the avidin beads by boiling in SDS buffer with 5% 2-mercaptoethanol. The entire biotinylated and nonbiotinylated samples from each preparation were loaded onto separate lanes in the same gel and probed using Western blotting.
Western blotting
Protein lysates were prepared in RIPA buffer with 1× SDS and 5% 2-mercaptoethanol, separated on 7.5% SDS–polyacrylamide gels, and transferred onto nitrocellulose membranes. Membranes were blocked with 5% milk, then incubated with primary antibodies for Kv1.5, Kv2.2 (1:1000; NeuroMab, UC Davis), or actin (1:10000; Millipore) overnight at 4°C in tris-buffered solution with 0.1% Tween (TBS-T) and 5% nonfat dry milk. After washing with TBS-T, membranes were incubated with horseradish peroxidase–conjugated secondary antibodies for 1 hour and washed again. Membranes were then developed using enhanced chemiluminescence (Thermo Scientific) with a Kodak In Vivo F Pro Imaging System. Band intensity was analyzed using ImageJ software.
Mesenteric artery bed pressurization
To investigate the regulation of Kv channel total and surface protein by intravascular pressure, a section of intact mesenteric vasculature was used. A freshly isolated, single superior mesenteric artery was cannulated in a temperature-controlled perfusion chamber (Living Systems Instrumentation), and downstream fourth-order arteries were occluded using cotton ties to create a closed, no-flow vascular network. Intra-vascular pressure was controlled using an attached reservoir and monitored using a pressure transducer. Arterial pressure was maintained at either 10 or 80 mmHg for 3 hours, after which, third- and fourth-order arteries were dissected and harvested from the preparation to evaluate total and surface protein expression.
Immunofluorescence
Isolated myocytes were plated on poly-L-lysine–coated coverslips and fixed immediately (0 hour) or after 3 hours in either 6 or 30 mM K+ PSS at 37°C. Myocytes were labeled with Alexa 488–conjugated wheat germ agglutinin (Invitrogen), a plasma membrane stain, before permeabilization with 0.1% Triton X-100. Myocytes were blocked with 5% BSA in PBS and incubated with the same Kv1.5-specific antibody used for Western blotting experiments at 1:100 in 0.5% BSA in PBS overnight at 4°C. Myocytes were washed with PBS and incubated with Alexa 546–conjugated secondary antibody. After washing, coverslips were secured to slides using mounting media (1:1 PBS/glycerol), and images were acquired using a laser scanning confocal microscope (LSM Pascal, Carl Zeiss). Alexa 488 and 546 were excited at 488 and 543 nm with emission detected at 505 to 530 and ≥560 nm, respectively. Pixel colocalization was measured using weighted colocalization coefficient values with Zeiss Pascal system embedded software. The RG2B Colocalization plugin for ImageJ was used to isolate colocalized pixel data with automatic selection threshold values and express the data as the average of the corresponding red and green channels.
Patch-clamp electrophysiology
Patch-clamp electrophysiology was performed on isolated myocytes that were allowed to adhere to a glass coverslip for 15 min before experimentation. Whole-cell currents were measured using an Axopatch 200B amplifier and Clampex 9.2 (Axon Instruments). Kv currents were activated from a holding potential of −70 mV by applying stepwise depolarizations to between −60 and +50 mV. Bath solution contained 120 mM NaCl, 3 mM NaHCO3, 4.2 mM KCl, 1.2 mM KH2PO4, 0.5 mM MgCl2, 1.8 mM CaCl2, 10 mM glucose, 1 mM tetraethylammonium, and 10 mM Hepes, with pH adjusted to 7.4 with NaOH. Pipette solution contained 110 mM potassium gluconate, 30 mM KCl, 0.5 mM MgCl2, 5 mM Na2ATP, 1 mM guanosine triphosphate, 10 mM EGTA, and 5 mM Hepes, with pH adjusted to 7.2 with KOH. Kv currents were digitized at 5 kHz and filtered at 1 kHz. Offline analysis was performed using Clampfit 9.2 (MDS Analytical Technologies).
Pressurized artery segment myography
Experiments were performed using individual endothelium-denuded, third-order mesenteric artery segments (0.5 to1 mm in length and 150 to 200 μm in diameter) cannulated at each end in a temperature-controlled perfusion chamber (Living Systems Instrumentation). Intravascular pressure was modulated using a reservoir and monitored by a pressure transducer. Pressure was maintained at either 10 or 80 mmHg for 3 hours. Arteries maintained at 10 mmHg pre-experimental pressure were then pressurized to 80 mmHg to stimulate the development of myogenic tone. Arteries in the 80 mmHg pre-experimental pressure group were continued at 80 mmHg, providing an equivalent time course for both experimental groups. Arterial diameter was measured using calibrated IonWizard edge detection software (IonOptix).
Statistical analysis
All datawere analyzed using paired or unpaired Student’s t test or analysis of variance (ANOVA) with Newman-Keuls post hoc test using GraphPad Prism 5. All data are expressed as means ± SEM. P < 0.05 was considered significant.
Supplementary Material
Acknowledgments
We thank R. Foehring (UTHSC) for comments on the manuscript, J. Nerbonne (Washington University, St. Louis) and J. Trimmer (UC Davis) for Kv1.5 constructs, and K. O’Connell (UTHSC) for the Kv2.1 construct. Funding: NIH grants HL67061, 094378, and HL110347 to J.H.J.
Footnotes
Author contributions:
M.W.K. designed and conducted all the experiments, performed all the data analysis, and wrote the manuscript. M.D.L. and J.P.B. taught and oversaw all the techniques and commented on the manuscript. J.H.J. designed the project, directed the experiments, and wrote the manuscript.
Competing interests:
The authors declare they have no competing interests.
REFERENCES AND NOTES
- 1.Davis MJ, Hill MA. Signaling mechanisms underlying the vascular myogenic response. Physiol Rev. 1999;79:387–423. doi: 10.1152/physrev.1999.79.2.387. [DOI] [PubMed] [Google Scholar]
- 2.Knot HJ, Nelson MT. Regulation of arterial diameter and wall [Ca2+] in cerebral arteries of rat by membrane potential and intravascular pressure. J Physiol. 1998;508:199–209. doi: 10.1111/j.1469-7793.1998.199br.x. [DOI] [PMC free article] [PubMed] [Google Scholar]
- 3.Albarwani S, Nemetz LT, Madden JA, Tobin AA, England SK, Pratt PF, Rusch NJ. Voltage-gated K+ channels in rat small cerebral arteries: Molecular identity of the functional channels. J Physiol. 2003;551:751–763. doi: 10.1113/jphysiol.2003.040014. [DOI] [PMC free article] [PubMed] [Google Scholar]
- 4.Amberg GC, Santana LF. Kv2 channels oppose myogenic constriction of rat cerebral arteries. Am J Physiol Cell Physiol. 2006;291:C348–C356. doi: 10.1152/ajpcell.00086.2006. [DOI] [PubMed] [Google Scholar]
- 5.Cheong A, Dedman AM, Xu SZ, Beech DJ. Kvα1 channels in murine arterioles: Differential cellular expression and regulation of diameter. Am J Physiol Heart Circ Physiol. 2001;281:H1057–H1065. doi: 10.1152/ajpheart.2001.281.3.H1057. [DOI] [PubMed] [Google Scholar]
- 6.Lu Y, Hanna ST, Tang G, Wang R. Contributions of Kv1.2, Kv1.5 and Kv2.1 subunits to the native delayed rectifier K+ current in rat mesenteric artery smooth muscle cells. Life Sci. 2002;71:1465–1473. doi: 10.1016/s0024-3205(02)01922-7. [DOI] [PubMed] [Google Scholar]
- 7.Plane F, Johnson R, Kerr P, Wiehler W, Thorneloe K, Ishii K, Chen T, Cole W. Heteromultimeric Kv1 channels contribute to myogenic control of arterial diameter. Circ Res. 2005;96:216–224. doi: 10.1161/01.RES.0000154070.06421.25. [DOI] [PubMed] [Google Scholar]
- 8.Nelson MT, Quayle JM. Physiological roles and properties of potassium channels in arterial smooth muscle. Am J Physiol. 1995;268:C799–C822. doi: 10.1152/ajpcell.1995.268.4.C799. [DOI] [PubMed] [Google Scholar]
- 9.Yuan XJ. Voltage-gated K+ currents regulate resting membrane potential and [Ca2+]i in pulmonary arterial myocytes. Circ Res. 1995;77:370–378. doi: 10.1161/01.res.77.2.370. [DOI] [PubMed] [Google Scholar]
- 10.Gutman GA, Chandy KG, Grissmer S, Lazdunski M, McKinnon D, Pardo LA, Robertson GA, Rudy B, Sanguinetti MC, Stühmer W, Wang X International Union of Pharmacology. LIII. Nomenclature and molecular relationships of voltage-gated potassium channels. Pharmacol Rev. 2005;57:473–508. doi: 10.1124/pr.57.4.10. [DOI] [PubMed] [Google Scholar]
- 11.Fountain SJ, Cheong A, Flemming R, Mair L, Sivaprasadarao A, Beech DJ. Functional up-regulation of KCNA gene family expression in murine mesenteric resistance artery smooth muscle. J Physiol. 2004;556:29–42. doi: 10.1113/jphysiol.2003.058594. [DOI] [PMC free article] [PubMed] [Google Scholar]
- 12.Xu C, Lu Y, Tang G, Wang R. Expression of voltage-dependent K+ channel genes in mesenteric artery smooth muscle cells. Am J Physiol. 1999;277:G1055–G1063. doi: 10.1152/ajpgi.1999.277.5.G1055. [DOI] [PubMed] [Google Scholar]
- 13.Yeung SY, Pucovský V, Moffatt JD, Saldanha L, Schwake M, Ohya S, Greenwood IA. Molecular expression and pharmacological identification of a role for Kv7 channels in murine vascular reactivity. Br J Pharmacol. 2007;151:758–770. doi: 10.1038/sj.bjp.0707284. [DOI] [PMC free article] [PubMed] [Google Scholar]
- 14.Zhong XZ, Abd-Elrahman KS, Liao CH, El-Yazbi AF, Walsh EJ, Walsh MP, Cole WC. Stromatoxin-sensitive, heteromultimeric Kv2.1/Kv9.3 channels contribute to myogenic control of cerebral arterial diameter. J Physiol. 2010;588:4519–4537. doi: 10.1113/jphysiol.2010.196618. [DOI] [PMC free article] [PubMed] [Google Scholar]
- 15.Jaggar JH, Stevenson AS, Nelson MT. Voltage dependence of Ca2+ sparks in intact cerebral arteries. Am J Physiol. 1998;274:C1755–C1761. doi: 10.1152/ajpcell.1998.274.6.C1755. [DOI] [PubMed] [Google Scholar]
- 16.Nelson MT, Cheng H, Rubart M, Santana LF, Bonev AD, Knot HJ, Lederer WJ. Relaxation of arterial smooth muscle by calcium sparks. Science. 1995;270:633–637. doi: 10.1126/science.270.5236.633. [DOI] [PubMed] [Google Scholar]
- 17.Vennekamp J, Wulff H, Beeton C, Calabresi PA, Grissmer S, Hänsel W, Chandy KG. Kv1.3-blocking 5-phenylalkoxypsoralens: A new class of immunomodulators. Mol Pharmacol. 2004;65:1364–1374. doi: 10.1124/mol.65.6.1364. [DOI] [PubMed] [Google Scholar]
- 18.Lagrutta A, Wang J, Fermini B, Salata JJ. Novel, potent inhibitors of human Kv1.5 K+ channels and ultrarapidly activating delayed rectifier potassium current. J Pharmacol Exp Ther. 2006;317:1054–1063. doi: 10.1124/jpet.106.101162. [DOI] [PubMed] [Google Scholar]
- 19.Stump GL, Wallace AA, Regan CP, Lynch JJ., Jr In vivo antiarrhythmic and cardiac electrophysiologic effects of a novel diphenylphosphine oxide IKur blocker (2- isopropyl-5-methylcyclohexyl) diphenylphosphine oxide. J Pharmacol Exp Ther. 2005;315:1362–1367. doi: 10.1124/jpet.105.092197. [DOI] [PubMed] [Google Scholar]
- 20.Ghosh S, Nunziato DA, Pitt GS. KCNQ1 assembly and function is blocked by long-QT syndrome mutations that disrupt interaction with calmodulin. Circ Res. 2006;98:1048–1054. doi: 10.1161/01.RES.0000218863.44140.f2. [DOI] [PubMed] [Google Scholar]
- 21.Yus-Najera E, Santana-Castro I, Villarroel A. The identification and characterization of a noncontinuous calmodulin-binding site in noninactivating voltage-dependent KCNQ potassium channels. J Biol Chem. 2002;277:28545–28553. doi: 10.1074/jbc.M204130200. [DOI] [PubMed] [Google Scholar]
- 22.Cavaretta JP, Sherer KR, Lee KY, Kim EH, Issema RS, Chung HJ. Polarized axonal surface expression of neuronal KCNQ potassium channels is regulated by calmodulin interaction with KCNQ2 subunit. PLOS One. 2014;9:e103655. doi: 10.1371/journal.pone.0103655. [DOI] [PMC free article] [PubMed] [Google Scholar]
- 23.Agarraberes FA, Terlecky SR, Dice JF. An intralysosomal hsp70 is required for a selective pathway of lysosomal protein degradation. J Cell Biol. 1997;137:825–834. doi: 10.1083/jcb.137.4.825. [DOI] [PMC free article] [PubMed] [Google Scholar]
- 24.Majeski AE, Dice JF. Mechanisms of chaperone-mediated autophagy. Int J Biochem Cell Biol. 2004;36:2435–2444. doi: 10.1016/j.biocel.2004.02.013. [DOI] [PubMed] [Google Scholar]
- 25.McEwen DP, Schumacher SM, Li Q, Benson MD, Iñiguez-Lluhi JA, Van Genderen KM, Martens JR. Rab-GTPase-dependent endocytic recycling of Kv1.5 in atrial myocytes. J Biol Chem. 2007;282:29612–29620. doi: 10.1074/jbc.M704402200. [DOI] [PubMed] [Google Scholar]
- 26.Zadeh AD, Xu H, Loewen ME, Noble GP, Steele DF, Fedida D. Internalized Kv1.5 traffics via Rab-dependent pathways. J Physiol. 2008;586:4793–4813. doi: 10.1113/jphysiol.2008.161570. [DOI] [PMC free article] [PubMed] [Google Scholar]
- 27.Pratt WB, Morishima Y, Peng HM, Osawa Y. Proposal for a role of the Hsp90/Hsp70-based chaperone machinery in making triage decisions when proteins undergo oxidative and toxic damage. Exp Biol Med. 2010;235:278–289. doi: 10.1258/ebm.2009.009250. [DOI] [PMC free article] [PubMed] [Google Scholar]
- 28.Svoboda LK, Reddie KG, Zhang L, Vesely ED, Williams ES, Schumacher SM, O’Connell RP, Shaw R, Day SM, Anumonwo JM, Carroll KS, Martens JR. Redox-sensitive sulfenic acid modification regulates surface expression of the cardiovascular voltage-gated potassium channel Kv1.5. Circ Res. 2012;111:842–853. doi: 10.1161/CIRCRESAHA.111.263525. [DOI] [PMC free article] [PubMed] [Google Scholar]
- 29.Ishiguro M, Morielli AD, Zvarova K, Tranmer BI, Penar PL, Wellman GC. Oxyhemoglobin-induced suppression of voltage-dependent K+ channels in cerebral arteries by enhanced tyrosine kinase activity. Circ Res. 2006;99:1252–1260. doi: 10.1161/01.RES.0000250821.32324.e1. [DOI] [PubMed] [Google Scholar]
- 30.Bannister JP, Bulley S, Narayanan D, Thomas-Gatewood C, Luzny P, Pachuau J, Jaggar JH. Transcriptional upregulation of α2δ-1 elevates arterial smooth muscle cell voltage-dependent Ca2+ channel surface expression and cerebrovascular constriction in genetic hypertension. Hypertension. 2012;60:1006–1015. doi: 10.1161/HYPERTENSIONAHA.112.199661. [DOI] [PMC free article] [PubMed] [Google Scholar]
- 31.Chai Q, Lu T, Wang XL, Lee HC. Hydrogen sulfide impairs shear stress-induced vasodilation in mouse coronary arteries. Pflugers Arch. 2015;467:329–340. doi: 10.1007/s00424-014-1526-y. [DOI] [PubMed] [Google Scholar]
- 32.Crnich R, Amberg GC, Leo MD, Gonzales AL, Tamkun MM, Jaggar JH, Earley S. Vasoconstriction resulting from dynamic membrane trafficking of TRPM4 in vascular smooth muscle cells. Am J Physiol Cell Physiol. 2010;299:C682–C694. doi: 10.1152/ajpcell.00101.2010. [DOI] [PMC free article] [PubMed] [Google Scholar]
- 33.Leo MD, Bannister JP, Narayanan D, Nair A, Grubbs JE, Gabrick KS, Boop FA, Jaggar JH. Dynamic regulation of β1 subunit trafficking controls vascular contractility. Proc Natl Acad Sci USA. 2014;111:2361–2366. doi: 10.1073/pnas.1317527111. [DOI] [PMC free article] [PubMed] [Google Scholar]
- 34.Bannister JP, Adebiyi A, Zhao G, Narayanan D, Thomas CM, Feng JY, Jaggar JH. Smooth muscle cell α2δ-1 subunits are essential for vasoregulation by CaV1.2 channels. Circ Res. 2009;105:948–955. doi: 10.1161/CIRCRESAHA.109.203620. [DOI] [PMC free article] [PubMed] [Google Scholar]
- 35.Boycott HE, Barbier CS, Eichel CA, Costa KD, Martins RP, Louault F, Dilanian G, Coulombe A, Hatem SN, Balse E. Shear stress triggers insertion of voltage-gated potassium channels from intracellular compartments in atrial myocytes. Proc Natl Acad Sci USA. 2013;110:E3955–E3964. doi: 10.1073/pnas.1309896110. [DOI] [PMC free article] [PubMed] [Google Scholar]
- 36.Cheong A, Li J, Sukumar P, Kumar B, Zeng F, Riches K, Munsch C, Wood IC, Porter KE, Beech DJ. Potent suppression of vascular smooth muscle cell migration and human neointimal hyperplasia by Kv1.3 channel blockers. Cardiovasc Res. 2011;89:282–289. doi: 10.1093/cvr/cvq305. [DOI] [PMC free article] [PubMed] [Google Scholar]
- 37.Cidad P, Moreno-Domínguez A, Novensá L, Roqué M, Barquín L, Heras M, Pérez-García MT, López-López JR. Characterization of ion channels involved in the proliferative response of femoral artery smooth muscle cells. Arterioscler Thromb Vasc Biol. 2010;30:1203–1211. doi: 10.1161/ATVBAHA.110.205187. [DOI] [PubMed] [Google Scholar]
- 38.Schmitz A, Sankaranarayanan A, Azam P, Schmidt-Lassen K, Homerick D, Hänsel W, Wulff H. Design of PAP-1, a selective small molecule Kv1.3 blocker, for the suppression of effector memory T cells in autoimmune diseases. Mol Pharmacol. 2005;68:1254–1270. doi: 10.1124/mol.105.015669. [DOI] [PubMed] [Google Scholar]
- 39.Cheng X, Liu J, Asuncion-Chin M, Blaskova E, Bannister JP, Dopico AM, Jaggar JH. A novel CaV1.2 N terminus expressed in smooth muscle cells of resistance size arteries modifies channel regulation by auxiliary subunits. J Biol Chem. 2007;282:29211–29221. doi: 10.1074/jbc.M610623200. [DOI] [PMC free article] [PubMed] [Google Scholar]
Associated Data
This section collects any data citations, data availability statements, or supplementary materials included in this article.