Abstract
Fast scan cyclic voltammetry (FSCV) has been commonly used to measure extracellular neurotransmitter concentrations in the brain. Due to the unstable nature of the background currents inherent in FSCV measurements, analysis of FSCV data is limited to very short amounts of time using traditional background subtraction. In this paper, we propose the use of a zero-phase high pass filter (HPF) as the means to remove the background drift. Instead of the traditional method of low pass filtering across voltammograms to increase signal to noise ratio, a HPF with a low cutoff frequency was applied to temporal data set at each voltage point to remove background drift. As a result, the HPF utilizing cutoff frequencies between 0.001 Hz to 0.01 Hz could be effectively used to a set of FSCV data for removing drifting patterns while preserving the temporal kinetics of the phasic dopamine response recorded in vivo. In addition, compared to a drift removal method using principal component analysis, this was found to be significantly more effective in reducing drift (unpaired t-test p<0.0001, t=10.88) when applied to data collected from tris buffer over 24 hours although a drift removal method using principal component analysis also showed the effective background drift reduction. The HPF was also applied to 5 hours of FSCV in vivo data. Electrically evoked dopamine peaks, observed in the nucleus accumbens, were clearly visible even without background subtraction. This technique provides a new, simple, and yet robust, approach to analyse FSCV data with unstable background.
1. Introduction
Fast scan cyclic voltammetry (FSCV) has long been used in neuroscience to interpret neurochemical fluctuations in various physiological and behavioural settings [1, 2]. Carbon fiber microelectrodes (CFM) used with FSCV as recording sensors have multiple advantages such as their high spatial/temporal resolution, biocompatibility and high adsorption properties for biogenic amines, such as dopamine [3, 4]. Thus, FSCV, in combination with CFM, is most commonly used for neurochemical recordings in vivo. However, in order to measure small short-term changes in faradaic (oxidation/reduction) currents corresponding to changes in extracellular concentrations of neurotransmitters in vivo using FSCV [5], presently it is necessary to subtract out the relatively large capacitive background currents generated by the high voltage scan rates utilized by this electrochemical recording method [6]. The subtracted cyclic voltammogram provides information about its characteristic redox features, which distinguishes the oxidizable substances from each other in the extracellular fluid. The amplitude of faradaic current calculated from the background subtraction method can be linked to actual concentration values by pre/post calibration. Although background current subtraction with FSCV has been extensively used to measure phasic (evoked) changes in dopamine in vivo [2, 7], the inherent instability in background currents over prolonged recording time periods (>90 seconds) has been a problem for accurate FSCV analysis [7, 8]. The nonlinear background instability, or drifting, in long-term measurements in vivo can be attributed to various factors such as complex biological neuro-environmental changes, electrode stabilization [9], and electrode surface erosion or fouling [10].
Although background drift is one of the obstacles in accurate interpretation in FSCV, to the best of our knowledge principal component regression (PCR) has been only one known detrending method used to remove it from FSCV data [11, 12]. Keithley et al. suggested that the background drift components were identified using principal component analysis (PCA) with a set of analogue background-subtracted voltammograms at various time points with no analyte present [13]. In addition, multivariate principal component regression (PCR) was performed, after utilizing an analog background subtraction to remove large background currents, to resolve contributions due to various sources such as dopamine, pH, and background current drift [11].
Here we suggest the use of a zero-phase high pass filter (HPF) with a very low cutoff frequency as a novel detrending method to remove slowly changing current in baseline drift. The unique aspect of our approach is that the filter is applied across the time series data at each voltage point instead of across voltammograms at specific time points. In this study, the effectiveness of this simple filtering for detrending is demonstrated under in vitro and in vivo conditions. HPF with an optimized cutoff frequency preserved dopamine voltammetric features such as peak current, full width at half height, and temporal pattern.
2. Methods and Materials
Electrodes
Carbon fiber microelectrodes (CFM) were constructed, as previously described [14], by inserting a single carbon fiber (d=7 µm) (Cytech Thomel T300) into a silica tube of outer diameter 89 µm (Polymicro Technologies, Phoenix, AZ) and held in place with amic acid cement. One end was attached to a nitinol wire (Small Parts, Logansport, IN) with silver epoxy paste and inserted into polyimide tubing (Chemtron Inc., Lorton, VA) for insulation. The opposite end with exposed carbon fiber was trimmed to a final length of ~100 µm using a scalpel blade.
Data Acquisition
Cyclic voltammograms were acquired using data acquisition hardware and software written in LabVIEW (Tar Heel UEI, University of North Carolina). For both in vitro and in vivo experiments, a scan rate of 400 V/s was used. A rest potential of −0.4 V versus an Ag/AgCl reference electrode was used between scans, the anodic limit was +1.3 V, and the scans were repeated every 100 ms unless otherwise noted. All experiments were performed inside a Faraday cage to eliminate as much electromagnetic noise as possible.
Flow Injection Apparatus
The flow-injection system consisted of a syringe pump (Harvard Apparatus, Hollisoton, MA) that directed buffer solution through a Teflon tube to a 6-port injection valve (Rheodyne, Rohnert Park, CA) at a rate of 2 mL/min. The injection valve was controlled by a 12 V solenoid and was used to introduce analyte from an injection loop to the flow cell. A CFM was placed into the center of the flow cell such that a flowing stream of buffer and analyte could be injected as a bolus. The buffer solution, composed of 150 mM NaCl and 12 mM Tris (Trizma base) at pH 7.4, was pumped across the CFM at a rate of 2 mL/min. All chemicals were purchased from Sigma-Aldrich (St. Louis, MO). Dopamine (Sigma Aldrich, St. Louis, MO) in concentrations of 1 µM was prepared in Tris buffer. The flow cell was flushed with the buffer solution for at least 30 seconds prior to each injection of dopamine.
In Vitro Experiment
A CFM was placed in a beaker of pH 7.4 Tris buffer solution and allowed to sit for 24 hours. Only the buffer solution was used in this experiment and no other chemicals, including dopamine, were introduced. The top of the beaker was covered to eliminate concentration changes due to evaporation and to maintain environmental stability. Voltammetric scans were performed as described above. Voltammograms were continuously recorded over the 24 hour period. As in the flow cell experiment, the scans were repeated every 100 ms.
Biological Experiments
Adult male Sprague-Dawley rats were used for in vivo experiments. Rats were housed under standard conditions with food and water available ad libitum. Care for the rats was provided in accordance with the National Institutes of Health guidelines, and the Hanyang University Institutional Animal Care and Use Committee approved the experimental procedures.
The CFM was positioned to record electrical stimulation-evoked dopamine release in the nucleus accumbens (NAc, AP: +1.2 mm, ML: +2.0 mm, DV: −6.5 mm with respect to bregma). Electrical stimulation was administered manually using a pulse stimulator (2 ms pulse width, 150 µA, 130 Hz, Isolated pulse stimulator model 2100, AM systems, WA). Stimulation was delivered once every ten minutes through a bipolar stainless steel electrode, insulated except for 0.5 mm at the tips of the electrode (Plastics One, Roanoke, VA), positioned in the medial forebrain bundle (MFB, AP: −4.6 mm, ML: +1.4 mm, DV: −8.5 mm with respect to bregma) a dopamine neuronal pathway that terminates in the NAc.
Principal Component Analysis
To compare with the conventional background drift removal method, we performed principal component analysis to remove background current drift. As described in Keithley et al [13], we used Malinowski’s F-test to identify primary components identifying background current drift using the first 30 minutes of digital background subtracted data as a template. By projecting these components over the original data, we calculated the portion of background current drift in original voltammogram. Then, it was subtracted, leaving only a stable current.
3. Results and Discussion
High Pass Filtering Design
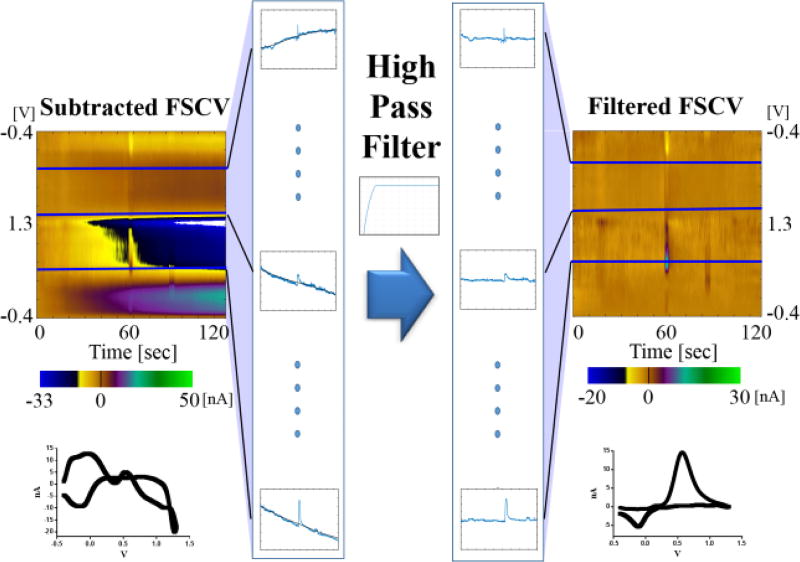
Zero-phase high pass (HP) second order Butterworth IIR filters were implemented with MATLAB and Statistics Toolbox Release 2016b (MathWorks Inc., Natick, MA). The zero-phase aspect of the filter allowed the data to be filtered without any phase shift, which is important for the purpose of maintaining temporal fidelity of the data [15]. Generally, to improve signal to noise ratio (SNR), low pass filters are applied across the scanned voltammograms which consists of currents recorded at all voltages in a single voltammetric scan [2, 9, 16]. However, in this study, filters were applied at the time series recorded at each voltage points as shown in Figure 1. For example, when a triangle waveform (−0.4 V → 1.3 V → −0.4 V, at 400 V/s) was used with 100 kHz sampling rate and 10 Hz repetition rate for 120 seconds, a total of 1200 voltammograms were obtained and each voltammogram was composed of 850 points. In this data set, the HP filter was applied to the series of 1200 voltammograms at a single voltage and repeated across all voltages (total 850 points). The application of the filter to the time series (Fig 1, horizontal direction) was robust enough to remove slow changes in background current even though the background voltammograms changed in a non-linear fashion and only the high frequency component (i.e. phasic change of dopamine) remained. To select an appropriate cutoff frequency for detrending, we evaluated how well the filters removed trending patterns while preserving the temporal kinetics of dopamine release using a range of 0.0001 to 0.5 Hz cutoff frequencies (maximum 5 Hz in a 10 Hz repetition rate).
Figure 1.
A zero-phase IIR Butterworth HPF was applied to the data recorded at each voltage point across the time series, indicated by the horizontal blue lines. The low frequency component of each data set was removed, and only the faradaic current remains. In this illustration, a 1 µM bolus of dopamine in a Tris buffer was injected in a flow cell and the background drift was removed by the filter leaving only the signal due to the presence of dopamine.
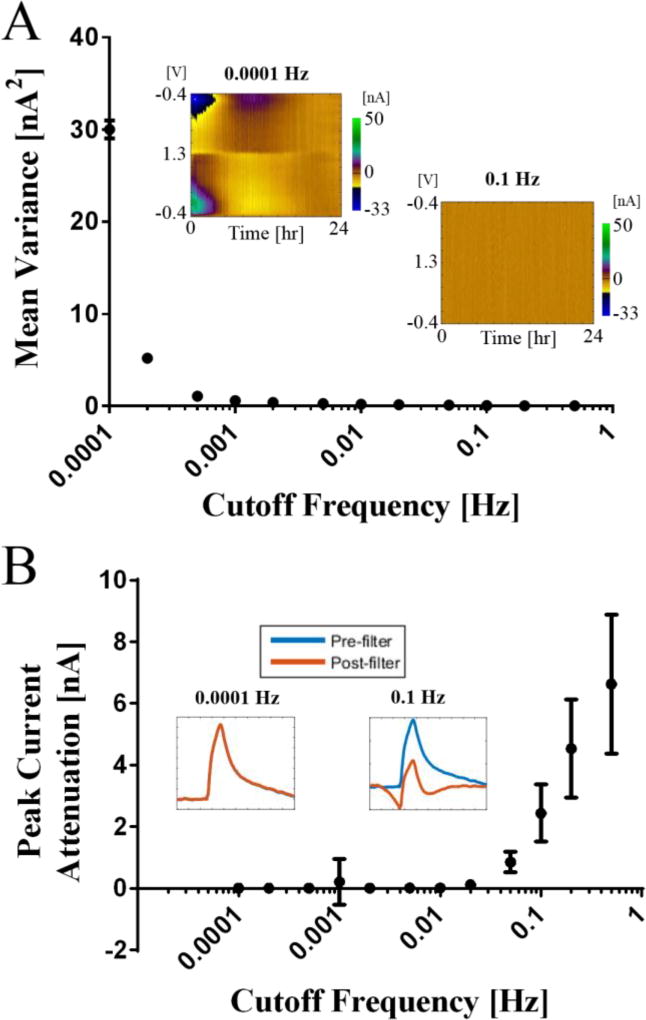
The variances, in nA2, from each time series (n=850) after filtering were averaged to calculate the mean variance for evaluating detrending effects about cutoff frequencies. In addition, the discrepancy of the peak currents of metabolite response (i.e. dopamine) before and after filtering was estimated for evaluating the temporal kinetics. Total 3 CFMs were used and representative figure from single electrode is depicted in figure 2. As a result, the HPF with above 0.001 Hz cutoff frequency effectively removed trending patterns (Fig. 2A). In addition, the discrepancy of the peak current before and after filtering was nearly zero with the cutoff frequency below 0.01 Hz (Fig. 2B). Thus, we selected a cutoff frequency of 0.01 Hz for subsequent in vitro and in vivo tests in this study.
Figure 2.
Optimization of the cutoff frequency for the filter (n=3). (A) The mean current variances from the time series at all voltages after filtering versus applied cutoff frequencies. (B) The discrepancy of dopamine peak currents before and after filtering versus applied cutoff frequencies. Error bars represent standard deviation. A cutoff frequency as low as 0.0001 Hz has no effect at all on peak currents, and a cutoff frequency of 0.1 Hz has a clearly visible effect on filtered peak currents.
Comparison between HPF and PCA
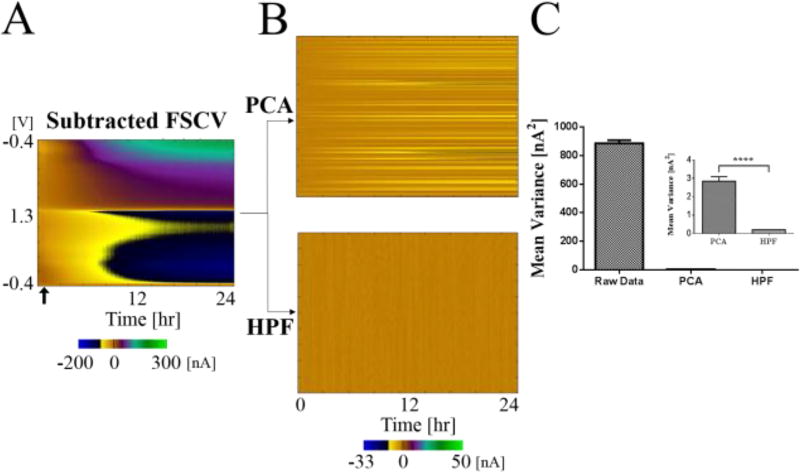
The PCA method of detrending was directly compared to HPF to evaluate the detrending performance of the HPF across all applied voltages (n=3, CFM). In this experiment, the data was recorded over 24 hours in a beaker of buffer solution. PCA was applied as described above in an effort to remove drifting background current. The data set was also processed with HPF with 0.01 Hz cutoff frequency (Fig. 3). As shown in Figure 3A, the background subtracted voltammograms recorded over 24 hours reflects a drift in background current of approximately 300 nA over this time period. Ideally, if the background drift is removed efficiently, the current measured over time should be stable. To confirm this quantitatively, the variance in each time series was calculated. As shown in Figure 3, application of HPF or PCA was both significantly effective in removing the background drift. While both techniques produced significant reductions in signal variation over time, HPF was significantly more effective than the PCA: unpaired t-test, p<0.0001, 1698 df, t=10.88. Not only was it more effective than PCA, the filter design and implementation was considerably simpler than the use of PCA due to no need of a template data set.
Figure 3.
Statistical evaluation of principle component analysis (PCA) and high pass filter (HPF) with 0.01 Hz cutoff frequency. (A) Data is from 24 hours of the electrode placed in a beaker of Tris buffer. Arrow indicates the point used for background subtraction. (B) In the upper color plot, the result of applying PCA and removing background current drift components is shown. In the lower color plot, HPF was performed across the time series at each voltage point. A Butterworth second order filter with 0.01 Hz cutoff frequency was used. (C) Mean variance of the detrended data. The variances, in nA2, from each time series were averaged to find the mean variance (single electrode, unpaired t-test, p<0.0001, t=10.88). Error bars are standard error of the mean.
In Vivo Evaluation of HPF for Detrending
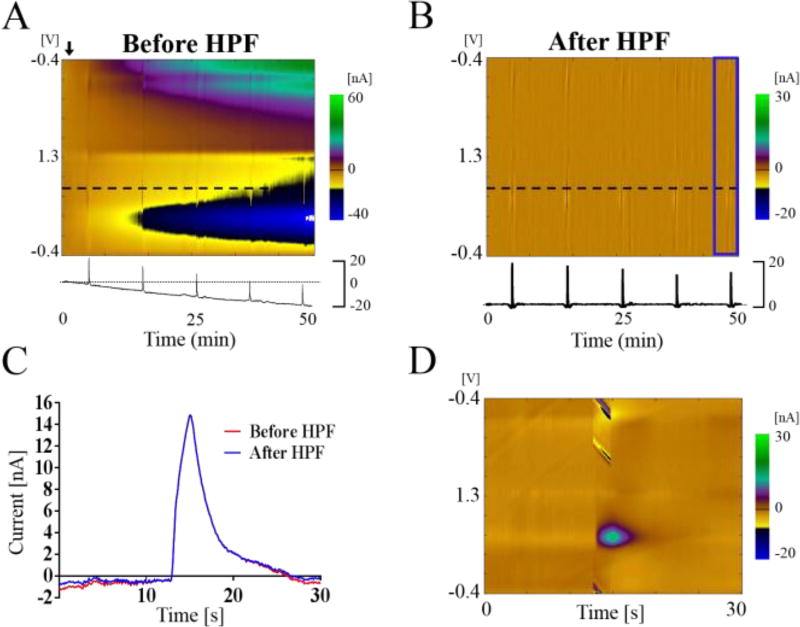
To verify the effectiveness of this technique in vivo, a CFM was placed in NAc of a rat to measure dopamine release in response to electrical stimulation of dopamine axons in the MFB projecting to the NAc. Changes in MFB stimulation-evoked dopamine release in NAc were measured and recorded over the course of five hours. As shown in Figure 4A, the background current drift is clearly visible as the last two stimulations are nearly obscured by the drift. In previous studies, background subtraction would be necessary at each stimulation for measurement of the stimulation-evoked dopamine signal [17]. However, using the HPF, no background subtraction was needed even for the 50 minutes as shown in the Figure 4B. The filter removed the low frequency component of the data, leaving only the high frequency information, which was from stimulation of the MFB. The final stimulation produced a peak dopamine release response of 15 nA (Fig. 4D); it was initially shown as a negative current value due to the background drift. Also, because the filter was applied in both forward and reverse directions, no phase shift occurred, and the temporal fidelity along with peak height was preserved (Fig. 4C)[15]. This technique shows its robustness in that it allows FSCV data to be taken and read for longer periods of time than previously shown [16]. The data from the beaker in vitro test was recorded over the course of 24 hours. Previously, Hermans et al. used a technique that allowed recording for up to 30 minutes [16]. Any slow changes in the current due to changes in the environment, because their data is of the low frequency type, can also be eliminated.
Figure 4.
Result of applying detrending technique to in vivo experiment. Electrical stimulation-evoked dopamine release in the nucleus accumbens of a rat. Stimulation was applied to the medial forebrain bundle. Data is from 50+ minutes of recordings. Stimulations once every 10 minutes. (A) The negative background drift obscures the stimulation data. Black dotted horizontal line at +0.6 V indicates the time series plotted below. (B) Color plot after applying the high pass filter (HFP). Blue area is magnified in (D). (C) The time series plot of the evoked dopamine response shows that dopamine kinetics at the CFM are not affected by the applied filter (After HPF, blue line). (D) The 5th electrical stimulation response is magnified from (B), with the peak evoked dopamine response (green) occurring at +0.6 V.
Conclusions
Use of a HPF is a simple, yet robust method of detrending FSCV data to remove background drift. Negative, positive, linear, and nonlinear drift can be eliminated by a well-designed filter. It is especially useful because of its simplicity; only one approach is needed to detrend the data and it is applicable over both short and long recording periods. This will simplify FSCV data collection and analysis moving forward. Its usefulness in both in vitro and in vivo data collection makes this a valuable tool for FSCV.
Acknowledgments
This research was supported by a NIH 1U01NS090455-01 award and the National Research Foundation of Korea (NRF-2017R1A2B2006896).
References
- 1.Wightman RM, Robinson DL. Transient changes in mesolimbic dopamine and their association with 'reward'. Journal of Neurochemistry. 2002;82(4):721–735. doi: 10.1046/j.1471-4159.2002.01005.x. [DOI] [PubMed] [Google Scholar]
- 2.Robinson DL, et al. Monitoring rapid chemical communication in the brain. Chemical reviews. 2008;108(7):2554–2584. doi: 10.1021/cr068081q. [DOI] [PMC free article] [PubMed] [Google Scholar]
- 3.Huffman ML, Venton BJ. Carbon-fiber microelectrodes for in vivo applications. Analyst. 2009;134(1):18–24. doi: 10.1039/b807563h. [DOI] [PMC free article] [PubMed] [Google Scholar]
- 4.Keithley RB, et al. Higher Sensitivity Dopamine Measurements with Faster-Scan Cyclic Voltammetry. Analytical Chemistry. 2011;83(9):3563–3571. doi: 10.1021/ac200143v. [DOI] [PMC free article] [PubMed] [Google Scholar]
- 5.Sulzer D, Pothos EN. Regulation of quantal size by presynaptic mechanisms. Rev Neurosci. 2000;11(2–3):159–212. doi: 10.1515/revneuro.2000.11.2-3.159. [DOI] [PubMed] [Google Scholar]
- 6.Howell JO, et al. Background subtraction for rapid scan voltammetry. Journal of electroanalytical chemistry and interfacial electrochemistry. 1986;209(1):77–90. [Google Scholar]
- 7.Heien ML, et al. Real-time measurement of dopamine fluctuations after cocaine in the brain of behaving rats. Proc Natl Acad Sci U S A. 2005;102(29):10023–8. doi: 10.1073/pnas.0504657102. [DOI] [PMC free article] [PubMed] [Google Scholar]
- 8.Oh Y, et al. Monitoring In Vivo Changes in Tonic Extracellular Dopamine Level by Charge-Balancing Multiple Waveform Fast-Scan Cyclic Voltammetry. Anal Chem. 2016;88(22):10962–10970. doi: 10.1021/acs.analchem.6b02605. [DOI] [PubMed] [Google Scholar]
- 9.Robinson DL, Wightman RM. Rapid Dopamine Release in Freely Moving Rats. In: Michael AC, Borland LM, editors. Electrochemical Methods for Neuroscience. Boca Raton (FL): 2007. [PubMed] [Google Scholar]
- 10.Takmakov P, et al. Carbon microelectrodes with a renewable surface. Anal Chem. 2010;82(5):2020–8. doi: 10.1021/ac902753x. [DOI] [PMC free article] [PubMed] [Google Scholar]
- 11.Keithley RB, Wightman RM, Heien ML. Multivariate concentration determination using principal component regression with residual analysis. TrAC Trends in Analytical Chemistry. 2009;28(9):1127–1136. doi: 10.1016/j.trac.2009.07.002. [DOI] [PMC free article] [PubMed] [Google Scholar]
- 12.Keithley RB, Wightman RM. Assessing principal component regression prediction of neurochemicals detected with fast-scan cyclic voltammetry. ACS Chem Neurosci. 2011;2(9):514–525. doi: 10.1021/cn200035u. [DOI] [PMC free article] [PubMed] [Google Scholar]
- 13.Keithley RB, Carelli RM, Wightman RM. Rank estimation and the multivariate analysis of in vivo fast-scan cyclic voltammetric data. Analytical chemistry. 2010;82(13):5541–5551. doi: 10.1021/ac100413t. [DOI] [PMC free article] [PubMed] [Google Scholar]
- 14.Oh Y, et al. Optimization of paired pulse voltammetry using sawhorse waveform. International Journal of Electrochemical Science. 2015;10(12):10061–10073. [Google Scholar]
- 15.Atcherley CW, et al. Rethinking data collection and signal processing. 2. Preserving the temporal fidelity of electrochemical measurements. Analytical chemistry. 2013;85(16):7654–7658. doi: 10.1021/ac402037k. [DOI] [PubMed] [Google Scholar]
- 16.Hermans A, et al. Dopamine detection with fast-scan cyclic voltammetry used with analog background subtraction. Anal Chem. 2008;80(11):4040–8. doi: 10.1021/ac800108j. [DOI] [PubMed] [Google Scholar]
- 17.Troyer KP, et al. Neurochemistry and electroanalytical probes. Current opinion in chemical biology. 2002;6(5):696–703. doi: 10.1016/s1367-5931(02)00374-5. [DOI] [PubMed] [Google Scholar]


