

Abstract
Previous work indicates that adults with autism display a decreased capacity when rapidly enumerating small sets of elements (i.e., subitizing), compared to typically developing (TD) individuals. This ability is crucial for fundamental visual functions such as object individuation and parallel processing. Thus, the deficit in autism suggests limits in these skills. To examine the neural basis of this limitation, adults with and without high functioning autism rapidly enumerated 1 to 8 randomly located squares during a neuroimaging study. Typically, adults are thought to use parallel visual processes to quantify up to three or four elements, and serial processes to enumerate more (5+) elements. We hypothesized that parietal lobe regions associated with counting would be recruited with smaller sets of elements in adults with autism, compared to TD adults. Consistent with this hypothesis, activation in parietal regions increased with smaller set sizes in adults with autism compared to TD adults. Increased activation for three elements was evident in several regions, including those thought to underlie subitizing. In addition, regions specific to the counting range in TD adults were often equally active for set sizes in the subitizing range in the adults with autism. Finally, significant deactivation was evident in TD adults, presumably reflecting relative suppression of regions specialized for competing processes, but was not apparent in adults with autism. These differences in brain function in adults with autism on a simple enumeration task suggest atypical brain organization and function that is likely to impact most visual tasks, especially those with multiple elements.
Keywords: autism spectrum disorder, fMRI, parietal, number, subitizing, counting
Introduction
In visual processing between individuals with and without autism have long been described, but the perceptual bases of these differences are unclear [Gagnon, Mottron, Bherer, & Joanette, 2004; Simmons, et al., 2009]. One basic perceptual difference between individuals with autism and typically developing (TD) individuals lies in how multiple elements are represented. For example, individuals with autism have an enhanced ability to detect a single element in a complex display, leading to better than typical performance on tasks such as visual search and embedded figures [O’Riordan, Plaisted, Driver, & Baron-Cohen, 2001; O’Riordan, 2004; Shah & Frith, 1993]. While it is clear that representing multiple elements differs in individuals with autism, characterizing how it differs continues to be a challenge. One way to measure differences in the ability to see multiple elements is an enumeration task, which assesses the perceptual processes underlying parallel (e.g., several elements simultaneously) and serial (e.g., one by one) processing of multiple visual elements.
The rapid enumeration task [Kaufmann et al., 2006; Mandler & Shebo, 1982; Trick & Pylyshyn, 1993, 1994], in which participants enumerate a set of elements as exactly and quickly as they can, examines at least two processes—subitizing and counting. The first process, subitizing, supports the enumeration of one or three to four elements and is thought to be a parallel process. TD adults can enumerate these small sets with perfect accuracy, and little increase in reaction time (RT) with each additional element [Kaufman & Lord, 1949; Pylyshyn & Storm, 1988]. Subitizing is thought to utilize a fundamental visual mechanism, which allows us to rapidly individuate several objects simultaneously [Kahneman, Treisman, & Gibbs, 1992; Leslie, Xu, Tremoulet, & Scholl, 1998; Piazza, Fumarola, Chinello, & Melcher, 2011; Pylyshyn, 2000; Xu & Chun, 2009]. This individuation mechanism has also been examined with multiple object tracking and short-term visual memory tasks [Cowan, 2001; Pylyshyn, 2000; Simmons et al., 2009]. The second process, counting, allows the exact enumeration of larger sets using a serial process. With counting, errors and RT increase systematically with each additional element [Mandler & Shebo, 1982; Revkin, Piazza, Izard, Cohen, & Dehaene, 2008], presumably due to the use of serial processes that include shifts of visual attention, and marking, tracking, and adding elements. (A related process, estimating, supports approximate enumeration of larger sets. Estimation, while distinct from subitizing and counting [Burr, Turi, & Anobile, 2010; Revkin et al., 2008], may contribute to performance on tasks thought to test subitizing or counting.) The visual process underlying counting requires more attentional resources than does subitizing, although subitizing is not completely free of attentional requirements [Burr et al., 2010; Railo, Koivisto, Revonsuo, & Hannula, 2008], as was initially hypothesized [Pylyshyn, 2000; Trick & Pylyshyn, 1993, 1994].
Evidence suggests that both subitizing and counting differ in autism. Subitizing capacity is slightly smaller in individuals with autism than in TD individuals (i.e., the flatter subitizing function switches to a steeper slope for counting at a smaller set size), leading to the use of counting processes with smaller sets. Individuals with autism, on average, are more likely to have a subitizing range of up to three elements, compared to four elements in TD individuals [O’Hearn, Franconeri, Wright, Minshew, & Luna, 2013]. Gagnon et al. report a similar pattern, with a quadratic function (i.e., change in slope) between three and five elements evident typically but not in adults with autism [Gagnon et al., 2004; see also Jarrold & Russell, 1997]. This decreased capacity could impact the ability to see several objects in a scene [O’Hearn, Lakusta, Schroer, Minshew, & Luna, 2011], and also to group elements into a holistic representation, both visual skills known to be affected in autism [Shah & Frith, 1983, 1993]. The former reflects how many objects are individuated; the latter relates to relationships between parts and wholes, reflecting that an object can be part of a collection, or a “chunk,” as well an “object.” Specifically, as visual perception is hierarchical, seeing multiple elements in parallel, potentially as a chunk [Cowan, 2001; Yantis, 1992], may be needed to merge these elements into a holistic representation [Gagnon et al., 2004; Treisman, 1982]. In this way, differences in parallel processing of multiple elements in autism might contribute to both impaired subitizing and the well-documented differences on holistic tasks such as the embedded figures task and face recognition. While characterizing this relation is beyond the scope of the current study, this study provides a first step, examining the neural basis of differences in these parallel processes.
In addition to the decreased capacity, individuals with autism subitize one to three elements more slowly than TD individuals [O’Hearn, Franconeri, Wright, Minshew, & Luna, 2013]. This slowed response may reflect the visual differences described in those with autism, such as increased sensitivity to local elements. The slowed subitizing speed in individuals with autism is more pronounced in adulthood than in childhood, as subitizing becomes faster typically with age from adolescence to adulthood. This mirrors the development of the global bias, which also has a long developmental trajectory, increasing with age typically into adulthood [Kovacs, 2000; Scherf, Luna, Kimchi, Minshew, & Behrmann, 2008; Scherf, Behrmann, Kimchi, & Luna, 2009]. Enumeration in the counting range is also slower in individuals with autism, in addition to being used with smaller sets. However, in contrast to subitizing, the slowed RT with counting is more evident in childhood than in adulthood in individuals with autism. The difference in the developmental trajectories suggest that the slowed RTs in the subitizing and counting ranges reflect disparate atypicalities in individuals with autism, even if the deficits appear similar by adulthood. Differences in the counting range are likely to reflect slower and less accurate shifts of attention in individuals with autism. This impaired attentional control is evident even in infancy [Elsabbagh et al., 2013; Zwaigenbaum et al., 2005], consistent with early emergence of counting deficits. Deficits may also reflect differences in estimation abilities, although this seems less likely as deficits in estimation are not reported in those with autism (without a grouping component) [Bangel et al., 2014] and estimation is unusually good in some individuals with autism [Soulières et al., 2010]. Indeed, the impairment in counting occurs despite the fact that mathematics is sometimes a strength in those with autism [Baron-Cohen, Wheelwright, Skinner, Martin, & Clubley, 2001; Iuculano et al., 2014], reflecting the importance of visual processes for enumeration and other mathematical tasks.
The neural basis of enumeration has not been examined in individuals with autism. Studies of TD adults—including ERP signatures, patterns of fMRI activation and magnetoencephalography—suggest that subitizing and counting engage overlapping but distinct brain systems [Ansari, Lyons, van Eimeren, & Xu, 2007; Hyde & Spelke, 2009; Vuokko, Niemivirta, & Helenius, 2013]. Both processes utilize a wide circuitry that includes extrastriate visual areas in parietal lobe [Piazza, Giacomini, Le Bihan, & Dehanene, 2003; Sathian et al., 1999]. Evidence of distinct neural substrates for subitizing and counting first came from simultanagnosic patients, who were impaired in serial counting but had preserved subitizing abilities [Dehaene & Cohen, 1994; Demeyere, Rotshtein, & Humphreys, 2012]. In neuroimaging studies, few regions appear to be specifically active for subitizing (compared to counting). Evidence up to this point has identified only one region, the right temporoparietal junction (TPJ), that appears to be exclusively engaged during subitizing smaller sets but not larger ones [Ansari et al., 2007; Vetter, Butterworth, & Bahrami, 2011]. In contrast, several regions appear to be more active for enumerating larger sets compared to subitizing. For example, superior regions of the intraparietal sulcus (IPS) display systematic increases in activation for each additional element from 4 to 7 [Piazza et al., 2003]. This pattern of activation may reflect number-specific counting processes, or other processes such as the increased attentional resources needed to count each element [Hubbard, Piazza, Pinel, & Dehaene, 2005]. In an early review, Dehaene et al. proposed that the horizontal segment of the intraparietal sulcus (hIPS) displays domain specificity for number [e.g., a mental number line; Dehaene, 1997]. This includes activation during both counting and estimation, with a focus on the species-general ability to estimate number. In their triple code model, these bilateral hIPS regions are contrasted with two other parietal regions important for number-related processes but not specific to number, namely spatial attention and verbal representation/manipulation [Dehaene, Piazza, Pinel, & Cohen, 2003; see also Arsalidou & Taylor, 2011]. In a meta-analysis, Arsalidou and Taylor [2011] suggest an update to the triple code model. They report additional regions that are not “number-specific” but that are utilized for number representation, including the cingulate and insula gyri, the cerebellum and prefrontal cortices [Arsalidou & Taylor, 2011].
The current study characterizes the brain systems underlying the ability to enumerate multiple elements, with the goal of examining the basic visual processes underlying subitizing and counting in individuals with autism. Our past behavioral data showed a smaller subitizing range in adults with autism. Therefore, we hypothesized that: (1) in parietal regions in which activation increases with number in typical adults, activation would increase with smaller sets of elements in adults with autism; and (2) in regions specific for counting compared to subitizing in typical adults, activation would increase in the subitizing range in adults with autism.
Methods and Materials
Participants
Twenty-eight adults with and without autism (12 males and 2 females in each group) with IQ scores above 80 participated in this study (see Table 1 for demographic information). Subjects were recruited through the University of Pittsburgh Autism Center of Excellence (ACE) subject core (HD#055748). Participants were diagnosed with autism using the Autism Diagnostic Interview [ADI; Lord, Rutter, & Couteur, 1994] and Autism Diagnostic Observation Schedule-G [ADOS; Lord et al., 2000], with expert clinical confirmation of diagnosis. Participants with autism met cutoffs for autism on the ADI and cutoffs for either autism or spectrum disorder on the ADOS. A recent study indicates that 93% of subjects in our center who met criteria for autism or ASD using these procedures under DSM-IV also met criteria using DSM 5 (Masefsky et al., 2013). Individuals who had a known cause for autism were excluded. TD participants were recruited through the ACE subject core and other projects. Individuals were screened for a history of neurological disease, brain injury, and psychiatric illness in themselves and first degree relatives. All subjects met inclusion for Magnetic Resonance (MR) scanning. Participants gave consent prior to the study, which was approved by the Internal Review Board at the University of Pittsburgh.
Table 1.
Demographic Information
| Autism
|
TD
|
|||
|---|---|---|---|---|
| Variable | M | SD | M | SD |
| N | 13 | 13 | ||
| Age | 23.74 | 4.78 | 23.15 | 4.63 |
| Full scale IQ | 106.54 | 12.45 | 112.46 | 8.37 |
| Verbal IQ | 104.92 | 13.00 | 111.08 | 13.01 |
| Performance IQ | 106.92 | 13.48 | 110.77 | 6.78 |
| ADOS | ||||
| Communication | 4.31 | 1.03 | ||
| Social | 7.85 | 2.48 | ||
| Total | 12.15 | 3.02 | ||
| ADI | ||||
| Social | 22.00 | 3.54 | ||
| Communication | 17.00 | 3.24 | ||
| RRB | 6.23 | 1.79 | ||
| Abnormal | 3.23 | 1.09 | ||
Stimuli and Procedure
The task parameters are based on the study by Piazza et al. [2003], which detected a pattern of activation in posterior parietal lobe consistent with the RT signature of the subitizing to counting shift, using a dot enumeration task.1 We based our study on this previous work because this characteristic typical pattern was necessary to examine the potential deviations from it in a group of adults with autism. As in that study, we use the term counting for exact enumeration of sets between five and eight elements.
Behavioral task
Immediately prior to the fMRI experiment, participants did an experiment reported in the Supporting Information (enumerating elements with a masked presentation outside of the scanner). They also spent time in a mock scanner, to become comfortable with the sounds and environment of the scanner.
Stimuli were presented on a screen, viewable via a mirror attached to the head coil. Similar to previously published behavioral studies [O’Hearn et al., 2013], one to eight randomly arranged grey squares, randomly assigned to 1 of 3 sizes, were displayed on a black background. In each run, six trials with each set size were presented (N = 36 for each set size in the study). There were eight orders in which the number and location of the squares, as well as square sizing, were randomly selected within the overall constraints (e.g., equal numbers of trials for each set size). These orders were matched across pairs of participants with and without autism.
Each trial began with a white fixation cross varying in duration from 0 to 10000 ms (Fig. 1). Participants were told to focus on the cross and await the beginning of the trial, denoted by a red fixation cross presented for 1300 ms. The test stimulus was then presented for 200 ms followed by a white fixation cross (2000 ms), allowing participants enough time to verbally report the number of squares. The delay was 200 ms to avoid identifying parietal activation that reflected eye movements instead of number processing [Piazza et al., 2003]. Participants were instructed to verbally respond quickly and accurately to each display. An MR compatible optical microphone was used to record verbal responses and estimate RTs. The researcher also wrote down the answers. After testing was complete, the audio transmission was compared to the researcher’s notes for accuracy and RTs were collected from the recording. On two occasions (one autism and one TD), equipment failure meant that the RT data were unavailable, and group mean RTs stratified by number of elements were submitted for these subjects. A total of six functional runs, totaling 5 m, 22 sec each, were performed by each participant.
Figure 1.

Illustration of behavioral task in the scanner, with 3 sec for the response. A red fixation cross comes on the screen to signal to the participants that the trial is starting. Accuracy is stressed. A microphone records the response and the timing of the response, and the experimenter also notes the response in case of equipment malfunction.
Neuroimaging Acquisition and Preprocessing
All scans were conducted at the Magnetic Resonance (MR) Research Center at the University of Pittsburgh Medical Center Presbyterian. Magnetization-prepared rapid gradient echo sequences (TR = 2200 ms, TE = 3.43ms, flip angle = 9°, 192 1 mm axial slices, 256 × 192 matrix) were used to obtain structural images. Functional images were obtained using a gradient echo, echo-planar imaging (EPI) sequence sensitive to blood-oxygen-level-dependent contrast (TR = 2 sec, TE = 29 ms, flip angle = 90°, 39 3.2 mm axial slices, 1-mm gap, 64 × 64 matrix, 158 volumes per run). The first three volumes of each run were discarded to allow for stabilization of longitudinal magnetization.
Functional EPI data were preprocessed using FMRIB Software Library utilities [Smith et al., 2004]. Each time series was first corrected for slice acquisition time using slicetimer followed by motion correction with mcflirt, coregistering to the temporal mean functional image. In addition, each participant’s data were examined and TRs that included rapid movement (framewise displacement > 0.8 mm) [Siegel et al., 2014] were censored from the time series during single-subject analyses. Subject’s structural scans were nonlinearly transformed into Montreal Neurological Institute (MNI) space using fnirt with the MNI152 brain as a reference. Functional images were coregistered to the structural scan and warped into MNI space using the transformation defined by the structural-to-MNI nonlinear warp. Functional data were then resampled into 3 × 3 × 3 mm voxels and spatially smoothed with a 5 mm FWHM Gaussian filter. Next, a high-pass temporal filter was used to remove low frequency drift. Each voxel time series was then normalized to have a mean of 100.
Data Analysis
Behavioral measures
The number of correct responses (accuracy) and RT was analyzed using a repeated measures analysis of variance (ANOVA), with group (autism, TD) and number of elements (1–8) as between and within subject factors respectively. The ANOVA was followed up by planned comparisons at three and four elements. Incorrect trials were excluded from all RT analyses. An arcsine transformation was used to normalize the accuracy measure. The Greenhouse-Geisser correction was applied to control for violations of sphericity. We also did a breakpoint analysis, as we had in our previous study, to examine whether the group with autism had a smaller subitizing capacity, using only the correct trials. To do this, a bilinear function was fit to each individual using the RT for one to seven elements, with eight elements excluded because we did not want to confound results with the “guessing end effect.” The intercept between these lines that minimized error was considered the “breakpoint,” or subitizing capacity.
Neurophysiological measures
We used a general linear model to fit voxel-wise functional data using the 3dDeconvolve program [Ward, 1998] from Analysis of Functional NeuroImages [AFNI; Cox, 1996]. All neuroimaging analyses included only trials with correct responses. We used a duration-modulated boxcar function to model the hemodynamic response. Individual RTs were used to specify the length of the boxcar to be convolved with a gamma function, on a trial-by-trial basis. Six motion parameters were included as regressors.
For our main hypotheses, region of interest (ROI) analyses were used. These regions are, according to previous studies, specific to the subitizing range (one ROI) or to higher numbers (three ROIs). For the subitizing range, one study has reported a region specific to subitizing in the R TPJ [Ansari et al., 2007]. This ROI allowed us to examine if group differences in adults with autism were evident within a region specific to the subitizing range. In contrast to the subitizing range, many papers have reported regions that are particularly active for higher numbers, sometimes reporting regions that increase systematically with each additional element [Arsalidou & Taylor, 2011; Dehaene et al., 2003; Piazza et al., 2003]. We used two ROIs chosen from the seminal review paper by Dehaene et al., postulating that bilateral horizontal intraparietal sulcus (hIPS) was the region specific to number [Dehaene et al., 2003]. We also chose an inferior parietal region identified by the term “numbers” in a meta-analysis using Neuro-Synth [Yarkoni, Poldrack, Nichols, Van, & Wager, 2011]. While five regions in the parietal lobe where identified as related to “numbers” by this meta-analysis, we utilized this particular parietal ROI because it was the only region that displayed significant modulation by number in the current control sample. This ROI displayed increases in activation from three to six elements, similar to that reported in Piazza et al., [2003]. Such increases are an important characteristic of number-sensitive regions, in particular for counting; the identification of these regions allowed us to test how the regions differed in adults with autism. Images showing the location of these ROIs are included in the Supporting Information. Each subjects’ mean beta-value per number of elements was extracted for these ROIs and submitted to group-level ANOVAs. As in the behavioral analyses, we used repeated measures ANOVA, with group (autism, TD) and number of elements (1–8) as between and within subject factors respectively. The ANOVA was followed by planned group comparisons with sets of three and four elements.
In addition to these a priori ROIs, we used several whole brain analyses. This more exploratory approach provided insight into the relatively unexamined division between the neural substrates of subitizing and counting and how this division differs in individuals with autism, including compensatory mechanisms that may be important during visual processing. This approach is consistent with Arsalidou and Taylor’s conclusion that many regions outside the parietal lobe are used during number tasks [Arsalidou & Taylor, 2011]. These whole-brain analyses used a mask that included only voxels shared by all participants. We examined regions that reached the criteria of individual voxel significance of P < 0.05 and, on the basis of a Monte Carlo simulation, group-wise significance of P < 0.05 (requiring a region to have 180 significant voxels). For graphing purposes, peaks within significant regions were identified, spheres with a 10 mm radius were drawn around the peaks, and active voxels within the sphere were graphed. Due to inconsistent coverage, ventral cerebellar activation is not reported.
In the whole brain analyses, we first used an analysis of variance (3dANOVA) with number (1 through 8) and group, to find regions showing a significant group-× number interaction. This provided insight into areas that were modulated differently across any set of numbers in the two groups. We then did a focused exploration of the subitizing and counting ranges. Composite variables were formed by averaging one, two, and three elements for the subitizing range and five, six, and seven for the counting range. Four elements were not included to avoid including activation that might reflect the alternate process. We directly compared the subitizing and counting composite variables in each group separately, to examine regions that were process-specific for typical adults and those with autism. This analysis used a mixed effects regression approach implemented in AFNI’s 3dMEMA [Chen, Saad, Nath, Beauchamp, & Cox, 2012]. Finally, we used 3dMEMA to examine group differences in the counting (counting vs. fixation baseline) or the subitizing range (subitizing vs. fixation baseline) separately. The baseline comparison was used in this analysis because we were interested in group differences in each range, without requiring that regions be specific to a certain process.
Results
One individual with autism performed 2 SDs below the mean for accuracy in the autism group. This subject and his matched control were dropped from analyses (final N = 26). IQ measures did not correlate with subitizing skill in this sample, and subitizing skill is generally considered distinct from general intelligence. Nonetheless, full-scale IQ scores were included as a covariate in a secondary analysis. The inclusion of IQ did not change the results, except in the L hIPS, and this is reported in the graphs.
Behavioral Results
While previous evidence indicates impairments on subitizing and counting in individuals with autism, per formance within the scanner was relatively comparable between groups (Fig. 2). (The behavioral study done outside the scanner indicated group differences in the planned comparisons at set sizes of 3 and 4 with the arcsine transformation; see Supporting Information.) The repeated measures ANOVA revealed the expected main effects of number (P’s < 0.001), with RT increasing and accuracy decreasing with each additional number. The ANOVA examining RT indicated no significant main effects of group (P = 0.35), although there was a significant group × number interaction, F(2.9, 67.14) = 3.44, P = 0.02. However, this reflected only the overall pattern of performance, and not differences at any specific number.2 For the accuracy measure, using the arcsine transformation, there was no effect of group, F(1,24) = 3.69, P = 0.07, nor a group × number interaction, F(3.14, 75.30) = 0.60, P = 0.63. Unlike previous studies, analyses of breakpoint did not yield group differences (although breakpoint is a relatively insensitive measure). The current sample was much smaller than in previous studies showing differences in the breakpoint between subitizing and counting in individuals with autism, compared to controls [N = 45; O’Hearn et al., 2013]. This difference in size makes the lack of group differences less surprising. This article focuses on the neuroimaging data, which is likely to be a more sensitive and proximal measure of group differences in this task. When analyzing the neuroimaging data, there is a benefit of the lack of robust behavioral differences; similar behavior between groups minimizes confounds related to performance differences, which can confuse fMRI data interpretation.
Figure 2.

Performance in the scanner. (A) Accuracy on the task in the scanner and (B) Reaction time.
Neuroimaging Results
ROI analyses
Region specific to small sets in R TPJ
We used the R TPJ region reported in Ansari et al. [Ansari et al., 2007], one of the few papers to report a subitizing specific region (most papers find that subitizing is subsumed by counting [Ansari et al., 2007; Sathian et al., 1999]; Supporting Information Figure 2). In this ROI (Fig. 3), using an ANOVA with number and group, there was a main effect of number, F(4.69, 112.45) = 9.51, P< 0.001 and group, F(1,24) = 4.19, P = 0.05, but the interaction between group and number was not significant. In each group separately, repeated measures ANOVAs indicated a main effect of number (TD F(3.68,44.16) = 6.30, P = 0.001; ASD F(3.62,43.43) = 5.12, P = 0.002). Planned comparisons examined group differences at three and four elements, and found a significant difference between groups at three elements, t(24) = 3.30, P = 0.003. Individuals with autism utilized this region more than TD individuals when enumerating set sizes of three.
Figure 3.

A ROI analysis in the R TPJ, with the ROI based on a study by Ansari et al. [2007]. This region exhibited greater activation for a smaller, compared to a larger, number of elements. The region is graphed across one to eight elements. Talairach coordinates reported by Ansari et al. [2007] were transformed to MNI coordinates using a previously validated algorithm [Lancaster, 2007]. ROIs were created by drawing a sphere with a radius of 10 mm around the coordinates. Planned comparisons at three and four elements revealed a main effect of group at three elements, with the group with ASD showing greater activation compared to the TD group.
hIPS regions
A ROI in the canonical number regions in the hIPS was chosen based on the paper by Dehaene et al. [Dehaene et al., 2003] (Supporting Information Figure 3). While there were no main effects of number or group, there were significant group × number interactions in this region bilaterally (Fig. 4; right: F(4.01, 96.29) = 2.66, P = 0.037; left:, F(4.13,99.03) = 2.85, P = 0.026). When groups were analyzed separately, the main effect of number did not reach significance in either group on the L. However, on the R, it reached significance in TD adults, F(3.29,39.45) = 2.95, P = 0.04, but not in adults with autism. Post hoc analyses examining each set size revealed significant group differences at three elements, bilaterally (right t(24) = 22.91, P = 0.008 and left, t(24) = 22.12, P = 0.045). However, L hIPS was the one region that did not remain significant when IQ was controlled. Again, adults with autism utilized this region more when enumerating three elements than did TD adults.
Figure 4.

A ROI analysis in the horizontal segment of the intraparietal sulcus (hIPS), with the ROI based on meta-analytic results from Dehaene et al. [2003]. This bilateral region is thought to exhibit domain specificity for number. The hIPS regions are graphed across one to eight elements. Talairach coordinates reported by Dehaene et al. [2003] were transformed to MNI coordinates using a previously validated algorithm [Lancaster, 2007]. ROIs were created by drawing a sphere with a radius of 7 mm around the coordinates. A radius of 7 mm was chosen to align closely with the anatomy of the hIPS and exclude regions of the superior and inferior parietal lobules. Both regions showed a group × number interaction. Planned comparisons revealed significant group differences at three elements, with greater activation in the ASD group compared to the TD group.
Inferior parietal region
A ROI in the canonical counting regions in inferior parietal lobe was chosen on the basis of a meta-analysis-based map using reverse inference with the term “number” in NeuroSynth [Yarkoni et al., 2011], with 62 studies (Supporting Information Figure 4). While four other regions in the parietal lobe were evident in this meta-analysis, the other regions showed no effects of number or group (nor an interaction) with the current sample. This was the only functionally defined region that, in the current sample, showed both a main effect of number, F(4.73, 113.69) = 2.97, P = 0.02, and a group × number interaction, F(4.73,113.69) = 2.46, P = 0.04 (Fig. 5). Importantly, it also showed steady increases in activation from three to six elements in the typical group. There was no main effect of group. When the groups were analyzed separately, there was a main effect of number in TD adults (F(3.50, 41.98) = 4.50, P = 0.006), but not in adults with autism. Post hoc analyses examining each number revealed a significant group difference at three elements (t(24) = −2.11, P = 0.046), but not at other set sizes.
Figure 5.
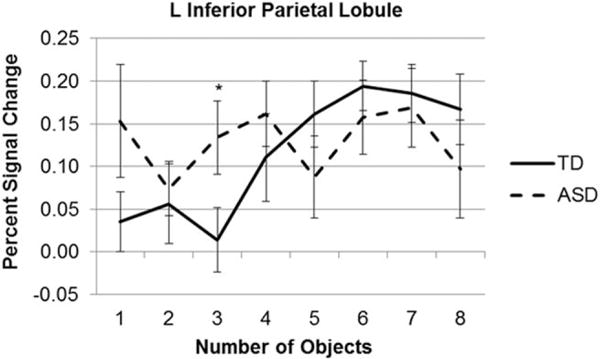
A ROI analysis in parietal lobe, with the ROI identified using a meta-analysis with the online program NeuroSynth and the term “numbers,” graphed across one to eight elements. After identifying the peak activation in this canonical counting region, a sphere with a 10 mm radius was drawn around a peak of activation and individual data from this region were graphed. These data showed a main effect of number in TD adults but not those with autism, and a significant group × number interaction. Planned comparisons indicated a significant group difference at three elements.
Whole brain analyses
Number × Group interaction
To further examine modulation across all numbers, regions showing a significant interaction between number and group were identified (Fig. 6). Differences in modulation across number between groups were identified in bilateral parahippocampal gyri, cerebellum, L fusiform gyrus, and R superior temporal/supra-marginal region. Activation in these regions was high at small numbers in adults with autism, and then appeared to decrease with number, while it tended to not change or to increase with number in TD adults. In the regions showing a group × number interaction, post hoc analyses indicated group differences with three elements in all regions, except cuneus near calcarine and parietooccipital fissure. In general, post hoc analyses revealed many group differences in the subitizing range, all with the group with autism exhibiting increased activation compared to the TD adults. In the subitizing range, there were differences evident with two, three, and four elements in parahippocampal gyri [L (two elements: t(24) = −2.54, P = 0.018; three elements: t(24) = −2.74, P = 0.011; four elements: t(24) = −2.15, P = 0.042) and R (one element: t(24) = −2.78, P = 0.01; two elements: t(24) = −2.46, P = 0.02; three elements: t(24) = −2.45; P = 0.02; four elements: t(24) = −2.20, P = 0.04)]; one, two, and three elements in L cerebellum [one element: t(24) = −2.28, P = 0.032; two elements: t(24) = −2.07, P = 0.050; three elements: t(24) = −3.72, P = 0.002]; one, two, and three elements in L fusiform/cerebellum [one element t(24) = −2.59, P = 0.016; two elements: t(24) = −3.16, P = 0.004; three elements t(24) = −3.34, P = 0.003]; two and three in L medial fusiform gyrus (near cerebellum) [two elements: t(24) = −3.43, P = 0.002; three elements: t(24) = −3.72, P = 0.001]; three and four in R STG [three elements: t(24) = −3.53, P = 0.002; four elements: t(24) = −2.12, P < 0.05]; and one element in cuneus near calcarine and parieto-occipital fissure [one element: t(24) = −2.78, P = 0.014]. In the counting range, two comparisons from the regions showing an interaction of group and number exhibited significant differences in the counting range [seven elements t(24) = −2.18, P = 0.04 in L cerebellum, with ASD > TD, as well as eight elements in the opposite direction, TD > ASD, t(24) = 2.77, P = 0.011 in R STG].
Figure 6.

The activation in regions exhibiting a group × number interaction in the whole brain analysis (180 contiguous voxels at P < 0.05), graphed across one to eight elements. (A) L fusiform gyrus/cerebellum; (B) L parahippocampal gyrus; (C) L medial fusiform gyrus (near cerebellum); (D) R parahippocampal gyrus; (E) R superior temporal gyrus; (F) Cuneous (near calcarine and parieto-occipital fissure); (G) R cerebellum. These graphs indicate how the effects of number differed between groups. Post hoc measures of group differences are denoted as follows: * P < 0.05; ** P < 0.01, *** P < 0.001.
Between group comparison of counting and subitizing ranges in separate analyses
In the subitizing range, the 3dMEMA revealed group differences in a range of regions (Fig. 7). These included bilateral parietal lobe regions (superior and inferior parietal lobule, precentral and postcentral gyri), as well as a lateralized area spanning the R superior temporal and supramarginal gyrus (including temporoparietal junction or TPJ), extending from the insula and striatum to posterior cingulate. Regions of significant activation from the spheres in these clusters, centered around peaks of activation, are graphed in Figure 7. (See Supporting Information Figure 7 for percent signal change for counting in these same regions). These regions displayed significant activation in the group with autism. In the TD group, these regions displayed deactivation (superior parietal gyri, postcentral and precentral sulci), no activation (L post-central, R parahippocampal, R superior occipital gyri) or significant activation that was decreased compared to the adults with autism (R paracentral lobule, posterior cingulate, R middle occipital gyrus, and TPJ). Thus, the canonical counting regions were deactivated when typical adults were subitizing small sets of elements, but this deactivation did not occur in adults with autism.
Figure 7.
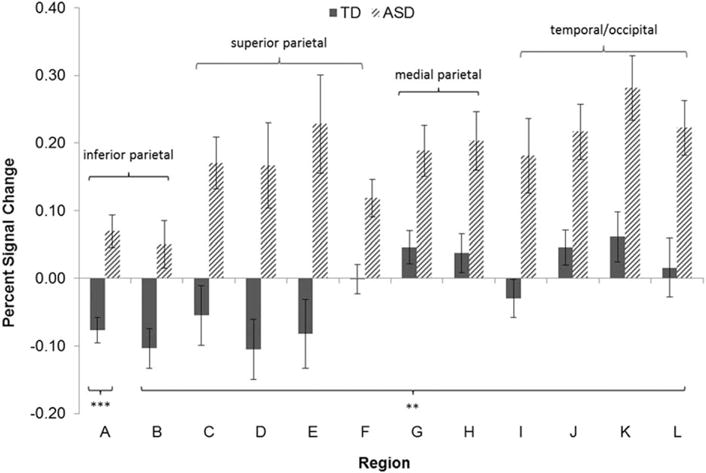
Regions which were significantly different between groups in the subitizing range. We used 3dMEMA and criteria of P < 0.05 for significance at an individual voxel level and P < 0.05 for group-wise significance, requiring 180 voxels. (A) R medial postcentral sulcus. (B) R lateral postcentral sulcus. (C) R dorsal superior parietal lobule. (D) R superior parietal lobule and postcentral sulcus. (E) L superior parietal lobule and postcentral sulcus. (F) L superior parietal cortex. (G) posterior cingulate gyrus. (H) R paracentral lobule. (I) R parahippocampal gyrus and lingual gyrus. (J) R supramarginal gyrus (TPJ). (K) R middle occipital gyrus and posterior middle temporal gyrus. (L) R superior occipital gyrus. Post hoc measures of group differences are denoted as follows: ** P < 0.01, *** P < 0.001.
In the counting range, no regions were significantly different between groups using a cluster corrected whole brain approach. However, there were several regions that showed large areas of activation, > 100 contiguous voxels, below threshold. These regions, R middle temporal gyrus extending to STG/supramarginal gyrus (bilateral) and R superior frontal gyrus extending to middle frontal gyrus, include the regions that appear to be specific to subitizing in typical adults [Kovacs, 2000; Shah & Frith, 1983] (see Supporting Information Figure 8). Although not significant with this sample, these regions seem worthy of further study because they reveal deactivation in “subitizing” regions in typical adults while counting. The pattern is consistent with other analyses, with more activation in the adults with autism than in TD adults. While below threshold, the pattern of deactivation when counting is similar to significant pattern of deactivation in TD adults when subitizing; there is deactivation of the competing process in TD adults but not adults with autism.
Within group comparison of subitizing and counting ranges
These analyses revealed a broad range of areas that were differentially activated for subitizing versus counting in each group separately (Supporting Information Figures 5 and 6). In addition to the canonical counting regions in parietal lobe, superior frontal, cingulate, and subcortical regions were also more active for counting than subitizing in TD adults (in blue). Distinct, more ventral regions of frontal, parietal, and cingulate cortices (in red), were more active for subitizing than counting, encircling the superior regions specific to counting. Activation in the group with autism was similar overall, but with very few regions specific to counting. The dorsal parietal regions that were more active for counting than subitizing in TD adults often displayed the same pattern in adults with autism, but below threshold. The contrast of subitizing vs. baseline and counting vs. baseline again indicates a large range of regions common across both groups (Supporting Information Figure 6). However, visual inspection suggests that individuals with autism may not show the same amount of deactivation as TD adults, especially in the counting range, consistent with the other analyses.
Discussion
The present study characterizes the neural basis of the decreased subitizing capacity in adults with autism. Subitizing, the rapid enumeration of one to three or four elements, is a fundamental visual process, thought to reflect a mechanism for individuating multiple elements in parallel [e.g., indexing, object files; Gottlieb, 2007; Kahneman, Treisman, & Gibbs, 1992; Leslie et al., 1998; Piazza et al., 2011; Pylyshyn, 2000]. Thus, it is important to understand how this basic visual process, which impacts most visual tasks, differs in adults with autism, as well as the visual processes that underlie enumeration of larger sets. While the overall pattern of activation was generally similar in adults with and without autism (Supporting Information Figures 5, 6), there were consistent group differences. In both parietal ROIs and in whole brain analyses, adults with autism displayed increased activation with small set sizes, compared to TD adults. The ROI analyses revealed increased activation for three elements in parietal regions identified from previous studies (Figs. 3–5), while the whole brain analyses indicated that there was increased activation for set sizes in the subitizing range across other visual regions and the cerebellum (Fig. 6), in adults with autism but not in TD adults. The increased activation in those with autism was evident in parietal regions that were deactivated for small set sizes in TD adults, as well as ventral visual regions that were activated, but to a lesser extent, in TD adults (Fig. 7). Thus, consistent with our hypotheses, adults with autism displayed: (1) activation in parietal lobe ROIs with smaller set sizes, potentially reflecting a smaller subitizing capacity; and (2) activation with small sets in regions that were not active with small sets in TD adults.
Behavioral Measures
These differences in brain function were evident even though performance was similar across groups in the scanner. This is in contrast to our previous behavioral results indicating that the group with autism had a smaller subitizing capacity than the TD group [O’Hearn et al., 2013; see also Gagnon et al., 2004; Jarrold & Russell, 1997]. This inconsistency across studies is a limitation of the current data, although it has the benefit of minimizing performance confounds when interpreting the brain activation. The previous study had a much larger sample, so it is likely that the difference between the behavioral results in this study and the previous ones reflects decreased power, and not actual differences in how the subitizing and counting processes were deployed in these tasks, which were almost identical. In the current sample, group differences with set sizes of three and four elements were evident in a supplementary study outside the scanner (see Supporting Information Supplemental Methods and Results). Behavioral effects in the scanner can be less robust than effects outside the scanner, potentially due to the added stress or other differences in the environment [Jan Willem Koten, 2013]. In addition, brain activation may be a more proximal measure of group differences than behavioral measures; in addition, the differences in activation can reflect compensatory mechanisms and increased effort in adults with autism, that is, group differences which actually lead to similar performance.
Overall Pattern of Activation
It is important to note the similarities between the two groups (see Supporting Information Figures 5, 6). The topography of the parietal lobe was similar across groups, with the same pattern of regions tuned to small and large sets of elements; many set sizes, especially in the counting range, did not result in group differences (Fig. 6). These similarities address concerns that the results reflect global brain differences in autism [Zielinski, B. A. et al.]. TD adults displayed distinct but overlapping brain systems for subitizing small sets and counting/enumeration of larger sets (Supporting Information Figures 5A, 6A, 6B), with parietal regions active for enumeration in both ranges. More ventral regions (e.g., TPJ) were specific to smaller sets [Ansari et al., 2007; Vetter et al., 2011; Xu & Chun, 2009] and more dorsal regions were specific for larger sets [Piazza et al., 2003; Sathian et al., 1999] (Figs. 3–5, Supporting Information Figures 5A). Subitizing, defined as a greater mean activation for 1–3 elements than 5–7 elements, engaged regions of frontal, parietal, cingulate, and temporal cortices in both groups (Supporting Information Figures 5A, 6A; Set sizes of four elements were dropped so that group differences in capacity would be less problematic while set sizes of eight were dropped due to potential group differences in the guessing end effect. Counting (Mean of 5–7 >1–3) utilized superior regions of parietal and frontal cortex, dorsal to the subitizing regions, as well as subcortical regions (Supporting Information Figure 6B). The similarities in adults with and without autism suggests that the same processes are often used to enumerate these set sizes across the two groups.
Differences Between Groups
In contrast to this overall similarity in brain function, there were several notable differences in how adults with autism engaged the brain systems underlying enumeration, compared to TD adults. First, while the processes in parietal lobe appeared to be similar, the switch between subitizing and “counting”3 processes occurred at a smaller set size in adults with autism compared to typical adults. Second, when enumerating set sizes in the subitizing range, the adults with autism recruited regions that were not utilized for small set sizes by TD adults. This is illustrated by the fact that very few regions were specific to counting when contrasted with subitizing in adults with autism (Supporting Information Figure 5B), although the expected regions were evident when counting was contrasted to baseline (Supporting Information Figure 6D). Both of these differences imply increased difficulty in processing multiple items in adults with autism, a deficit that would impact many visual and cognitive processes, far beyond enumeration. Finally, adults with autism were less likely to exhibit deactivation of regions that underlie competing processes, compared to TD adults. A lack of deactivation in those with autism has been previously reported for the default mode network and for theory of mind processing [Kennedy, Redcay, & Courchesne, 2006; Murdaugh et al., 2012], suggesting a generalized impairment that may undermine the use of specialized processes in individuals with autism. Each of these differences are discussed in turn.
In the ROI analyses, increased activation with set sizes of 3 was evident in all four ROIs in adults with autism, suggesting that the limited subitizing capacity precipitates the engagement of the classic counting and number regions in parietal cortex with smaller sets, compared to TD adults. Activation in the L IPS ROI exhibited the bilinear function that characterizes the switch from subitizing to counting ranges typically. In typical adults, there was little activation in set sizes from 1 to 3, but activation increased systematically from 3 to 6, which suggests counting or other incremental processes (Fig. 5). For adults with autism, the changes in activation across number were less systematic, with group difference at three elements. The pattern was similar in R and L hIPS ROIs (Fig. 3), with higher activation at set sizes of 3 in adults with autism compared to TD adults. As, in addition to counting, the hIPS are engaged for estimation and magnitude judgments, processes that may also contribute to the results. The pattern in TPJ (Fig. 4), with activation decreasing as the set size increases, was expected in this “subitizing specific” region, and was evident in adults with and without autism. However, unexpectedly, activity for set sizes of 3 was again increased in the adults with autism compared to TD adults. This suggests that subitizing processes in this region (whatever they may be) are also utilized in adults with autism, at least with three elements, more robustly than in typical adults.
The whole brain analyses again revealed greater activation for smaller sets of objects in adults with autism than in TD adults. In two types of whole brain analyses, we identified significant, cluster-corrected regions using: (1) comparisons of the composite subitizing measure and the composite counting measure in each group separately; and (2) an ANOVA revealing regions with a significant group × number interaction. Using the subitizing composite score, group differences were evident in both the dorsal and ventral streams. This included the classic counting regions, deactivated in TD adults during subitizing but active in adults with autism, and the R temporal lobe/ventral stream, which was active in both groups but displayed significantly more activation in adults with autism. The counting composite score did not identify any regions that reached cluster-corrected significance (see Supporting Information, Figure 8, for regions > 100 voxels). A similar pattern was evident in visual regions (L fusiform, parahippocampal gyri, R superior temporal gyrus, and cuneous) and the cerebellum, in regions significant in the group × number ANOVA. Individuals with autism showed greater activation with one to four elements, compared to TD adults who exhibited little activation or deactivation with these set sizes. The wide range of regions activated indicated that, in both groups, many processes are modulated by increasing number, including those not specific to number [e.g., load, attention, effort, planning, grouping; Arsalidou & Taylor, 2011]. The adults with autism were more likely to use these regions, and these processes (e.g., increased attention or effort, compensatory processes), with small set sizes compared to the TD adults.
Adults with autism did not show the areas of deactivation (Supporting Information Figures 6C, 6D) observed in TD adults (Supporting Information Figures 6A, 6B). This deactivation was evident in group comparisons in the subitizing range (Fig. 7) and is likely to be linked to the dampening of competing processes (e.g., inhibiting counting one by one when elements are in the subitizing range). In addition, temporal and ventral parietal regions thought to underlie subitizing appeared to be deactivated during counting typically (e.g., inhibiting grouping when counting one by one) but were not evident in autism (Supporting Information Figures 6B, 6D); however, these regions did not reach threshold for significance for group differences (Supporting Information Figure 8). The relative pattern of activation and deactivation typically may reflect increased discrimination between subitizing and counting processes in TD adults, which may allow TD adults to rapidly use the optimal visual process (Supporting Information Figures 5A and 5B). The decreased discrimination between processes in adults with autism, with less inhibition of competing processes compared to TD adults, is likely to undermine the efficiency of visual processing and suggests a lack of specialization in neural circuitry. This is reminiscent of claims that face representation is less distinct from object representation in autism [Schultz et al., 2000], in both psychological and neural function, suggesting a difference in autism that may generalize across visual processes.
Parietal Differences Specific to Autism
These results are consistent with our predictions that parietal regions would be activated at smaller numbers in individuals with autism, although differences were more general across regions (e.g., temporal lobe, cerebellum) than we expected. While parietal lobe or dorsal stream abnormalities have long been hypothesized in those with autism [Spencer et al., 2000], individuals with other genetic disorders also exhibit visuospatial deficits, including a small “subitizing range” [Bruandet, Molko, Cohen, & Dehaene, 2004; Simon et al., 2005]. Dorsal stream abnormalities are striking in individuals with other disorders such as Turner syndrome [Brown et al., 2004], 22q11.2 deletion [Bearden et al., 2007], and Williams syndrome [O’Hearn, Landau, & Hoffman, 2005]. The differences in brain structure/function in these disorders appear to be more specific to the parietal lobe than is reported in autism. Therefore, it is unclear whether the differences in dorsal stream function in adults with autism reflect their focus on individual items, a visual style not generally described in these other syndromes; general differences such as attention that may differ in many neurodevelopmental disorders; or characteristics of the dorsal stream that make this region particularly vulnerable to impairment over development (Atkinson & Braddick, 2014). Further work needs to be done to characterize how these circuitries emerge over development and, relatedly, what differences might be specific to autism.
Limitations
There are several major limitations of the current data. As mentioned, there is a lack of behavioral differences between groups; in spite of this, the pattern of brain activity differed in a consistent manner between groups. A second limitation mentioned previously is that we do not understand how or if these differences relate to other visual differences in autism. Subitizing deficits suggest a basic limitation in parallel visual processing, that may be related, or contribute, to the proposed “local bias” and even socially relevant impairments (e.g., faces) in individuals with autism. In particular, our data support the proposal that adults with autism require increased effort to individuate multiple elements and integrate these elements into a holistic percept. Despite this likely association, however, whether and how these disparate visual differences are associated must be left to further research. Finally, while the whole brain analyses suggest differences across the subitizing range, the ROI analyses indicate that the differences between groups are most notable with set sizes of “3,” and not “4,” although 4 would be more consistent with the previous behavioral data. While the reason for this result is not clear, there is some evidence that set sizes of 3, but not 4, might be a fundamental limit than set sizes of 4. Work from other laboratories suggests that 3 is an important threshold in early childhood [Feigenson, 2005; O’Hearn et al., 2005] and for brain function [Ester, Drew, Klee, Vogel, & Awh, 2012; Pagano, Lombardi, & Mazza, 2014]. Visual training improves accuracy for set sizes of 4 but not 3 elements (but does not change RT, which suggests a limit of 3), suggesting that the set size of 3 is hardwired [Green & Bavelier, 2006]. In addition, even within the subitizing range, the importance of attention or grouping may shift with set size and specific processes may peak at set sizes of 2 or 3 elements [Burr et al., 2010; Ester et al., 2012; Pagano et al., 2014]. Further work is needed to integrate the multiple processes underlying enumeration, and how they map onto activation in the brain typically.
Conclusions
Several differences in neural function appear to underlie the differences in enumeration in this sample of adults with autism, and these differences would limit parallel processing of visual information generally. The two groups exhibited similar patterns of activation across number in many regions, suggesting they were using the same processes in a slightly different manner (e.g., there were group differences at set size 3 only, at the break between subitizing and counting processes). However, in other regions, the two groups exhibited a different pattern across number (e.g., less modulation across number in general), making it unclear if the two groups were even using the same processes to enumerate small and large set sizes. These general differences reflected, across regions, increased activation with smaller set sizes in adults with ASD compared to TD adults. Adults with autism used more regions with small set sizes, with few regions specific to counting/serial processes over subitizing/parallel processes. They also displayed a lack of deactivation for competing processes, compared to TD adults. These differences in neural function are not likely to be specific to enumeration tasks, and may very well constitute general differences in neural function in adults with autism. Further work will clarify how the distinct pattern of brain function in those with autism when perceiving multiple elements is related to differences on visual tasks that require representing several objects simultaneously, including laboratory tasks (e.g., multiple object tracking; short term visual memory) and pragmatic skills (e.g., driving a car; interpreting a social interaction) that impact the quality of life of individuals with autism.
Supplementary Material
Acknowledgments
This work was completed at the University of Pittsburgh and supported by NIMH; K01 MH081191 to KO, Autism Speaks; 04593 to BL, NIMH; R01 MH067924 to BL, and a NIH; HD 055748 to NM, from the Eunice Kennedy Shriver National Institute of Child Health & Human Development. Recruitment was supported by NICHD ACE grant HD055648 and CPEA grant HD35469. The content is solely the responsibility of the authors and does not necessarily represent the official views of the National Institutes of Health. We are very grateful to the participants and their families. Preliminary data were presented at the Annual Meeting for the Society for Neuroscience in 2009.
Footnotes
Financial Disclosures: None of the authors have any financial disclosures or conflicts of interest to report.
We thank Dr. Piazza for answering our questions on how to replicate their successful methods.
There was a trend for group differences at eight elements t(21.6) = 2.01, P < 0.06 with the RT measure, but this is likely to reflect group differences in the guessing end effect (i.e., performance gets better at the highest number because participants guess the highest number of elements displayed in the task).
While subitizing or counting are likely to be used on most trials in this task, because the task requires precise enumeration up to eight elements, the exact processes used cannot be determined. In particular, estimation, a distinct process that utilizes similar neural substrates [Stanescu-Cosson et al., 2000], may contribute to performance in the counting range, as may chunking and other strategies. However, the similarities in pattern of regions used suggest that the groups were using comparable processes in most cases.
Supporting Information
Additional Supporting Information may be found in the online version of this article at the publisher’s web-site:
Contributor Information
Kirsten O’Hearn, Department of Psychiatry, University of Pittsburgh.
Katerina Velanova, Department of Psychiatry, University of Pittsburgh.
Andrew Lynn, Department of Psychiatry, University of Pittsburgh.
Catherine Wright, Department of Psychiatry, University of Pittsburgh.
Michael Hallquist, Department of Psychiatry, University of Pittsburgh.
Nancy Minshew, Department of Neurology, University of Pittsburgh.
Beatriz Luna, Department of Psychiatry, University of Pittsburgh.
References
- Ansari D, Donlan C, Thomas MS, Ewing SA, Peen T, Karmiloff-Smith A. What makes counting count? Verbal and visuo-spatial contributions to typical and atypical number development. Journal of Experimental Child Psychology. 2003;85(1):50–62. doi: 10.1016/s0022-0965(03)00026-2. [DOI] [PubMed] [Google Scholar]
- Ansari D, Lyons IM, van Eimeren L, Xu F. Linking visual attention and number processing in the brain: The role of the temporo-parietal junction in small and large symbolic and nonsymbolic number comparison. Journal of Cognitive Neuroscience. 2007;19(11):1845–1853. doi: 10.1162/jocn.2007.19.11.1845. [DOI] [PubMed] [Google Scholar]
- Arsalidou M, Taylor MJ. Is 2 + 2 = 4? Meta-analyses of brain areas needed for numbers and calculations. NeuroImage. 2011;54(3):2382–2393. doi: 10.1016/j.neuroimage.2010.10.009. [DOI] [PubMed] [Google Scholar]
- Bangel KA, Batty M, Ye AX, Meaux E, Taylor MJ, Doesburg SM. Reduced beta band connectivity during number estimation in autism. NeuroImage: Clinical. 2014;6:202–213. doi: 10.1016/j.nicl.2014.08.020. [DOI] [PMC free article] [PubMed] [Google Scholar]
- Baron-Cohen S, Wheelwright S, Skinner R, Martin J, Clubley E. The autism-spectrum quotient (AQ): Evidence from Asperger syndrome/high-functioning autism, males and females, scientists and mathematicians. Journal of Autism and Developmental Disorders. 2001;31(1):5–17. doi: 10.1023/a:1005653411471. [DOI] [PubMed] [Google Scholar]
- Bearden CE, van Erp TG, Dutton RA, Tran H, Zimmermann L, Sun D, et al. Mapping cortical thickness in children with 22q11.2 deletions. Cerebral Cortex. 2007;17:1889–1898. doi: 10.1093/cercor/bhl097. (1047-3211 (Print)) [DOI] [PMC free article] [PubMed] [Google Scholar]
- Behrmann M, Avidan G, Leonard GL, Kimchi R, Luna B, Humphreys K, et al. Configural processing in autism and its relationship to face processing. Neuropsychologia. 2006;44:110–129. doi: 10.1016/j.neuropsychologia.2005.04.002. [DOI] [PubMed] [Google Scholar]
- Brown WE, Kesler SR, Eliez S, Warsofsky IS, Haberecht M, Reiss AL. A volumetric study of parietal lobe subregions in Turner syndrome. Developmental Medicine & Child Neurology. 2004;46(9):607–609. doi: 10.1017/s0012162204001021. [DOI] [PMC free article] [PubMed] [Google Scholar]
- Bruandet M, Molko N, Cohen L, Dehaene S. A cognitive characterization of dyscalculia in Turner syndrome. Neuropsychologia. 2004;42(3):288–298. doi: 10.1016/j.neuropsychologia.2003.08.007. [DOI] [PubMed] [Google Scholar]
- Burr DC, Turi M, Anobile G. Subitizing but not estimation of numerosity requires attentional resources. Journal of Vision. 2010;10(6):20. doi: 10.1167/10.6.20. [DOI] [PubMed] [Google Scholar]
- Chen G, Saad ZS, Nath AR, Beauchamp MS, Cox RW. FMRI group analysis combining effect estimates and their variances. NeuroImage. 2012;60(1):747–765. doi: 10.1016/j.neuroimage.2011.12.060. [DOI] [PMC free article] [PubMed] [Google Scholar]
- Cowan N. The magical number 4 in short-term memory: A reconsideration of mental storage capacity. Behavioral and Brain Sciences. 2001;24:87–114. doi: 10.1017/s0140525x01003922. (0140-525X (Print)) [DOI] [PubMed] [Google Scholar]
- Cox RW. AFNI: Software for analysis and visualization of functional magnetic resonance neuroimages. Computers and Biomedical Research. 1996;29(3):162–173. doi: 10.1006/cbmr.1996.0014. [DOI] [PubMed] [Google Scholar]
- Dehaene S. The Number Sense: How the Mind Creates Mathematics. Oxford University Press; 1997. pp. 189–202. [Google Scholar]
- Dehaene S, Cohen L. Dissociable mechanisms of subitizing and counting: Neuropsychological evidence from simultanagnosic patients. Journal of Experimental Psychology. Human Perception and Performance. 1994;20(5):958–975. doi: 10.1037//0096-1523.20.5.958. [DOI] [PubMed] [Google Scholar]
- Dehaene S, Piazza M, Pinel P, Cohen L. Three parietal circuits for number processing. Cognitive Neuropsychology. 2003;20:487–506. doi: 10.1080/02643290244000239. [DOI] [PubMed] [Google Scholar]
- Demeyere N, Rotshtein P, Humphreys GW. The neuroanatomy of visual enumeration: Differentiating necessary neural correlates for subitizing versus counting in a neuropsychological voxel-based morphometry study. Journal of Cognitive Neuroscience. 2012;24(4):948–964. doi: 10.1162/jocn_a_00188. [DOI] [PubMed] [Google Scholar]
- Elsabbagh M, Fernandes J, Jane Webb S, Dawson G, Charman T, Johnson MH, British Autism Study of Infant Siblings Team Disengagement of visual attention in infancy is associated with emerging autism in toddlerhood. Biological Psychiatry. 2013;74(3):189–194. doi: 10.1016/j.biopsych.2012.11.030. [DOI] [PMC free article] [PubMed] [Google Scholar]
- Ester EF, Drew T, Klee D, Vogel EK, Awh E. Neural measures reveal a fixed item limit in subitizing. The Journal of Neuroscience. 2012;32(21):7169–7177. doi: 10.1523/JNEUROSCI.1218-12.2012. [DOI] [PMC free article] [PubMed] [Google Scholar]
- Feigenson L. A double-dissociation in infants’ representations of object arrays. Cognition. 2005;95(3):B37–B48. doi: 10.1016/j.cognition.2004.07.006. [DOI] [PubMed] [Google Scholar]
- Gagnon L, Mottron L, Bherer L, Joanette Y. Quantification judgement in high functioning autism: Superior or different? Journal of Autism & Developmental Disorders. 2004;34(6):679–689. doi: 10.1007/s10803-004-5288-9. [DOI] [PubMed] [Google Scholar]
- Gottlieb J. From thought to action: The parietal cortex as a bridge between perception, action, and cognition. Neuron. 2007;53(1):9–16. doi: 10.1016/j.neuron.2006.12.009. [DOI] [PubMed] [Google Scholar]
- Green CS, Bavelier D. Enumeration versus multiple object tracking: The case of action video game players. Cognition. 2006;101(1):217–245. doi: 10.1016/j.cognition.2005.10.004. [DOI] [PMC free article] [PubMed] [Google Scholar]
- Hubbard EM, Piazza M, Pinel P, Dehaene S. Interactions between number and space in parietal cortex. Nature Reviews. Neuroscience. 2005;6(6):435–448. doi: 10.1038/nrn1684. [DOI] [PubMed] [Google Scholar]
- Hyde DC, Spelke ES. All numbers are not equal: An electrophysiological investigation of small and large number representations. Journal of Cognitive Neuroscience. 2009;21:1039–1053. doi: 10.1162/jocn.2009.21090. (0898-929X (Print)) [DOI] [PMC free article] [PubMed] [Google Scholar]
- Iuculano T, Rosenberg-Lee M, Supekar K, Lynch CJ, Khouzam A, Phillips J, et al. Brain organization underlying superior mathematical abilities in children with autism. Biological Psychiatry. 2014;75(3):223–230. doi: 10.1016/j.biopsych.2013.06.018. [DOI] [PMC free article] [PubMed] [Google Scholar]
- Jan Willem Koten RL. Are reaction times obtained during fMRI scanning reliable and valid measures of behavior? Experimental Brain Research. Experimentelle Hirnforschung. Experimentation Cerebrale. 2013;227(1):93–100. doi: 10.1007/s00221-013-3488-2. [DOI] [PubMed] [Google Scholar]
- Jarrold C, Russell J. Counting abilities in autism: Possible implications for central coherence theory. Journal of Autism and Developmental Disorders. 1997;27(1):25–37. doi: 10.1023/a:1025817121137. [DOI] [PubMed] [Google Scholar]
- Jemel B, Mottron L, Dawson M. Impaired face processing in autism: Fact or artifact? Journal of Autism and Developmental Disorders. 2006;36(1):91–106. doi: 10.1007/s10803-005-0050-5. [DOI] [PubMed] [Google Scholar]
- Kahneman D, Treisman A, Gibbs BJ. The reviewing of object files: Object-specific integration of information. Cognitive Psychology. 1992;24(2):175–219. doi: 10.1016/0010-0285(92)90007-o. [DOI] [PubMed] [Google Scholar]
- Kaufman EL, Lord MW. The discrimination of visual number. American Journal of Psychology. 1949;62(4):498–525. [PubMed] [Google Scholar]
- Kaufmann L, Koppelstaetter F, Siedentopf C, Haala I, Haberlandt E, Zimmerhackl LB, et al. Neural correlates of the number-size interference task in children. Neuroreport. 2006;17(6):587–591. doi: 10.1097/00001756-200604240-00007. [DOI] [PMC free article] [PubMed] [Google Scholar]
- Kennedy DP, Redcay E, Courchesne E. Failing to deactivate: resting functional abnormalities in autism. Proc Natl Acad Sci USA. 2006;103:8275–8280. doi: 10.1073/pnas.0600674103. [DOI] [PMC free article] [PubMed] [Google Scholar]
- Kovacs I. Human development of perceptual organization. Vision Research. 2000;40(10–12):1301–1310. doi: 10.1016/s0042-6989(00)00055-9. [DOI] [PubMed] [Google Scholar]
- Lancaster JL, Tordesillas-Gutiérrez D, Martinez M, Salinas F, Evans A, Zilles K, Mazziotta JC, Fox PT. Bias between MNI and Talairach coordinates analyzed using the ICBM-152 brain template. Hum Brain Mapp. 2007;28(11):1194–1205. doi: 10.1002/hbm.20345. [DOI] [PMC free article] [PubMed] [Google Scholar]
- Leslie AM, Xu F, Tremoulet PD, Scholl BJ. Indexing and the object concept: Developing ‘what’ and ‘where’ systems. Trends in Cognitive Sciences. 1998;2(1):10–18. doi: 10.1016/s1364-6613(97)01113-3. [DOI] [PubMed] [Google Scholar]
- Lord C, Risi S, Lambrecht L, Cook EHJ, Leventhal BL, DiLavore PC, et al. The autism diagnostic observation schedule-generic: A standard measure of social and communication deficits associated with the spectrum of autism. Journal of Autism and Developmental Disorders. 2000;30(3):205–223. [PubMed] [Google Scholar]
- Lord C, Rutter M, Couteur AL. Autism diagnostic interview-revised: A revised version of a diagnostic interview for caregivers of individuals with possible pervasive developmental disorders. Journal of Autism and Developmental Disorders. 1994;24(5):659–685. doi: 10.1007/BF02172145. [DOI] [PubMed] [Google Scholar]
- Mandler G, Shebo BJ. Subitizing: An analysis of its component processes. Journal of Experimental Psychology: General. 1982;111(1):1–22. doi: 10.1037//0096-3445.111.1.1. [DOI] [PubMed] [Google Scholar]
- Mazefsky CA, McPartland JC, Gastgeb HZ, Minshew NJ. Brief report: comparability of DSM-IV and DSM-5 ASD research samples. J Autism Dev Disord. 2013;43:1236–1242. doi: 10.1007/s10803-012-1665-y. [DOI] [PMC free article] [PubMed] [Google Scholar]
- Murdaugh DL, et al. Differential deactivation during mentalizing and classification of autism based on default mode network connectivity. PLoS ONE. 2012;7:e50064. doi: 10.1371/journal.pone.0050064. [DOI] [PMC free article] [PubMed] [Google Scholar]
- O’Hearn K, Franconeri S, Wright C, Minshew N, Luna B. The development of individuation in autism. Journal of Experimental Psychology. Human Perception and Performance. 2013;39(2):494–509. doi: 10.1037/a0029400. [DOI] [PMC free article] [PubMed] [Google Scholar]
- O’Hearn K, Lakusta L, Schroer E, Minshew N, Luna B. Deficits in adults with autism spectrum disorders when processing multiple objects in dynamic scenes. Autism Research. 2011;4(2):132–142. doi: 10.1002/aur.179. [DOI] [PMC free article] [PubMed] [Google Scholar]
- O’Hearn K, Landau B, Hoffman JE. Multiple object tracking in people with Williams syndrome and in normally developing children. Psychological Science. 2005;16(11):905–912. doi: 10.1111/j.1467-9280.2005.01635.x. [DOI] [PMC free article] [PubMed] [Google Scholar]
- O’Riordan M. Superior Visual Search in Adults with Autism. Autism. 2004;8(3):229–248. doi: 10.1177/1362361304045219. [DOI] [PubMed] [Google Scholar]
- O’Riordan MA, Plaisted KC, Driver J, Baron-Cohen S. Superior visual search in autism. Journal of Experimental Psychology. Human Perception and Performance. 2001;27(3):719–30. doi: 10.1037//0096-1523.27.3.719. [DOI] [PubMed] [Google Scholar]
- Pagano S, Lombardi L, Mazza V. Brain dynamics of attention and working memory engagement in subitizing. Brain Research. 2014;1543:244–252. doi: 10.1016/j.brainres.2013.11.025. [DOI] [PubMed] [Google Scholar]
- Piazza M, Fumarola A, Chinello A, Melcher D. Subitizing reflects visuo-spatial object individuation capacity. Cognition. 2011;121(1):147–153. doi: 10.1016/j.cognition.2011.05.007. [DOI] [PubMed] [Google Scholar]
- Piazza M, Giacomini E, Le Bihan D, Dehanene S. Single-trial classification of parallel pre-attentive and serial attentive processes using functional magnetic resonance imaging. Proceedings of the Royal Society B: Biological Sciences. 2003;270(1521):1237–1245. doi: 10.1098/rspb.2003.2356. [DOI] [PMC free article] [PubMed] [Google Scholar]
- Pylyshyn ZW. Situating vision in the world. Trends in Cognitive Sciences. 2000;4(5):197–207. doi: 10.1016/s1364-6613(00)01477-7. [DOI] [PubMed] [Google Scholar]
- Pylyshyn ZW, Storm RW. Tracking multiple independent targets: Evidence for a parallel tracking mechanism. Spatial Vision. 1988;3(3):179–197. doi: 10.1163/156856888x00122. [DOI] [PubMed] [Google Scholar]
- Railo H, Koivisto M, Revonsuo A, Hannula MM. The role of attention in subitizing. Cognition. 2008;107(1):82–104. doi: 10.1016/j.cognition.2007.08.004. [DOI] [PubMed] [Google Scholar]
- Revkin SK, Piazza M, Izard V, Cohen L, Dehaene S. Does subitizing reflect numerical estimation? Psychological Science. 2008;19:607–614. doi: 10.1111/j.1467-9280.2008.02130.x. (0956-7976 (Print)) [DOI] [PubMed] [Google Scholar]
- Sathian K, Simon TJ, Peterson S, Patel GA, Hoffman JM, Grafton ST. Neural evidence linking visual object enumeration and attention. Journal of Cognitive Neuroscience. 1999;11(1):36–51. doi: 10.1162/089892999563238. [DOI] [PubMed] [Google Scholar]
- Scherf KS, Behrmann M, Kimchi R, Luna B. Emergence of global shape processing continues through adolescence. Child Development. 2009;80(1):162–177. doi: 10.1111/j.1467-8624.2008.01252.x. [DOI] [PMC free article] [PubMed] [Google Scholar]
- Scherf KS, Luna B, Kimchi R, Minshew N, Behrmann M. Missing the big picture: Impaired development of global shape processing in autism. Autism Research. 2008;1(2):114–129. doi: 10.1002/aur.17. [DOI] [PMC free article] [PubMed] [Google Scholar]
- Schultz RT, Gauthier I, Klin A, Fulbright RK, Anderson AW, Volkmar F, et al. Abnormal ventral temporal cortical activity during face discrimination among individuals with autism and asperger syndrome. Archives of General Psychiatry. 2000;57(4):331–340. doi: 10.1001/archpsyc.57.4.331. [DOI] [PubMed] [Google Scholar]
- Shah A, Frith U. An islet of ability in autistic children: A research note. Journal of Child Psychology and Psychiatry. 1983;24(4):613–620. doi: 10.1111/j.1469-7610.1983.tb00137.x. [DOI] [PubMed] [Google Scholar]
- Shah A, Frith U. Why do autistic individuals show superior performance on the block design task? Journal of Child Psychology and Psychiatry. 1993;34(8):1351–64. doi: 10.1111/j.1469-7610.1993.tb02095.x. [DOI] [PubMed] [Google Scholar]
- Siegel JS, Power JD, Dubis JW, Vogel AC, Church JA, Schlaggar BL, et al. Statistical improvements in functional magnetic resonance imaging analyses produced by censoring high-motion data points. Human Brain Mapping. 2014;35(5):1981–1996. doi: 10.1002/hbm.22307. [DOI] [PMC free article] [PubMed] [Google Scholar]
- Simmons DR, Robertson AE, McKay LS, Toal E, McAleer P, Pollick FE. Vision in autism spectrum disorders. Vision Research. 2009;49(22):2705–2739. doi: 10.1016/j.visres.2009.08.005. [DOI] [PubMed] [Google Scholar]
- Simon TJ, Bearden CE, Mc-Ginn D, Zackai E. Visuospatial and numerical cognitive deficits in children with chromosome 22q11.2 deletion syndrome. Cortex. 2005;41(2):145–155. doi: 10.1016/s0010-9452(08)70889-x. [DOI] [PMC free article] [PubMed] [Google Scholar]
- Smith SM, Jenkinson M, Woolrich MW, Beckmann CF, Behrens TE, Johansen-Berg H, et al. Advances in functional and structural MR image analysis and implementation as FSL. NeuroImage. 2004;23(Suppl 1):S208–S219. doi: 10.1016/j.neuroimage.2004.07.051. [DOI] [PubMed] [Google Scholar]
- Soulières I, Hubert B, Rouleau N, Gagnon L, Tremblay P, Seron X, et al. Superior estimation abilities in two autistic spectrum children. Cognitive Neuropsychology. 2010;27(3):261–276. doi: 10.1080/02643294.2010.519228. [DOI] [PubMed] [Google Scholar]
- Spencer J, O’Brien J, Riggs K, Braddick O, Atkinson J, Wattam-Bell J. Motion processing in autism: Evidence for a dorsal stream deficiency. Neuroreport. 2000;11(12):2765–7. doi: 10.1097/00001756-200008210-00031. [DOI] [PubMed] [Google Scholar]
- Stanescu-Cosson R, Pinel P, van de Moortele P-F, Bihan DL, Cohen L, Dehaene S. Understanding dissociations in dyscalculia. Brain. 2000;123(11):2240–2255. doi: 10.1093/brain/123.11.2240. [DOI] [PubMed] [Google Scholar]
- Treisman AM. Perceptual grouping and attention in visual search for features and objects. Journal of Experimental Psychology: Human Perception and Performance. 1982;8:194–214. doi: 10.1037//0096-1523.8.2.194. [DOI] [PubMed] [Google Scholar]
- Trick LM, Pylyshyn ZW. What enumeration studies can show us about spatial attention: Evidence for limited capacity preattentive processing. Journal of Experimental Psychology: Human Perception & Performance. 1993;19(2):331–351. doi: 10.1037//0096-1523.19.2.331. [DOI] [PubMed] [Google Scholar]
- Trick LM, Pylyshyn ZW. Cueing and counting: Does the position of the attentional focus affect enumeration? Visual Cognition. 1994;1(1):67–100. [Google Scholar]
- Vetter P, Butterworth B, Bahrami B. A candidate for the attentional bottleneck: Set-size specific modulation of the right TPJ during attentive enumeration. Journal of Cognitive Neuroscience. 2011;23(3):728–736. doi: 10.1162/jocn.2010.21472. [DOI] [PubMed] [Google Scholar]
- Vuokko E, Niemivirta M, Helenius P. Cortical activation patterns during subitizing and counting. Brain Research. 2013;1497:40–52. doi: 10.1016/j.brainres.2012.12.019. [DOI] [PubMed] [Google Scholar]
- Ward BD. Deconvolution analysis of fMRI time series data: Documentation for the AFNI software package 1998 [Google Scholar]
- Xu Y, Chun MM. Selecting and perceiving multiple visual objects. Trends in Cognitive Sciences. 2009;13(4):167–174. doi: 10.1016/j.tics.2009.01.008. [DOI] [PMC free article] [PubMed] [Google Scholar]
- Yantis S. Multielement visual tracking: Attention and perceptual organization. Cognitive Psychology. 1992;24(3):295–340. doi: 10.1016/0010-0285(92)90010-y. [DOI] [PubMed] [Google Scholar]
- Yarkoni T, Poldrack RA, Nichols TE, Van E, Wager TD. Large-scale automated synthesis of human functional neuroimaging data. Nature Methods. 2011;8(8):665–670. doi: 10.1038/nmeth.1635. [DOI] [PMC free article] [PubMed] [Google Scholar]
- Zielinski BA, et al. scMRI Reveals Large-Scale Brain Network Abnormalities in Autism. PLoS ONE. 2012;7:e49172. doi: 10.1371/journal.pone.0049172. [DOI] [PMC free article] [PubMed] [Google Scholar]
- Zwaigenbaum L, Bryson S, Rogers T, Roberts W, Brian J, Szatmari P. Behavioral manifestations of autism in the first year of life. International Journal of Developmental Neuroscience: The Official Journal of the International Society for Developmental Neuroscience. 2005;23(2–3):143–152. doi: 10.1016/j.ijdevneu.2004.05.001. [DOI] [PubMed] [Google Scholar]
Associated Data
This section collects any data citations, data availability statements, or supplementary materials included in this article.