Abstract
The exceptionally rich information content of nuclear magnetic resonance (NMR) spectra is routinely used to identify and characterize molecules and molecular interactions in a wide range of applications, including clinical biomarker discovery, drug discovery, environmental chemistry, and metabolomics. The set of peak positions and intensities from a reference NMR spectrum generally serves as the identifying signature for a compound. Reference spectra normally are collected under specific conditions of pH, temperature, and magnetic field strength, because changes in conditions can distort the identifying signatures of compounds. A spin system matrix that parametrizes chemical shifts and coupling constants among spins provides a much richer feature set for a compound than a spectral signature based on peak positions and intensities. Spin system matrices expand the applicability of NMR spectral libraries beyond the specific conditions under which data were collected. In addition to being able to simulate spectra at any field strength, spin parameters can be adjusted to systematically explore alterations in chemical shift patterns due to variations in other experimental conditions, such as compound concentration, pH, or temperature. We present methodology and software for efficient interactive optimization of spin parameters against experimental 1D-1H NMR spectra of small molecules. We have used the software to generate spin system matrices for a set of key mammalian metabolites and are also using the software to parametrize spectra of small molecules used in NMR-based ligand screening. The software, along with optimized spin system matrix data for a growing number of compounds, is available from http://gissmo.nmrfam.wisc.edu/.
Graphical abstract
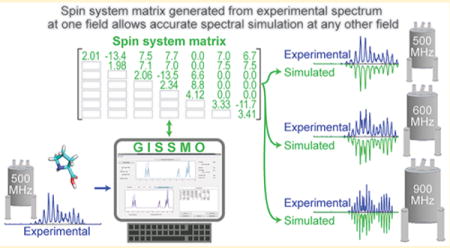
Nuclear magnetic resonance (NMR) spectroscopy is a powerful and highly reproducible analytical method with a broad range of applications in chemistry and biomedical research. NMR is used extensively in profiling (identifying and quantifying) small molecules in mixtures, as well as in biomarker discovery.1–10 The general approach to NMR-based metabolomics profiling utilizes sets of chemical shifts and intensities from reference spectra, the “fingerprint” of the molecule,11 to detect the presence of particular compounds in mixtures of small molecules and to estimate their concentrations. In addition, NMR is being used to screen for binding of small molecules to macromolecules of interest. In these studies, alterations in the spectral signature of the small molecule (ligand) in the presence of a target macromolecule are indicative of binding. Small molecules found to have high binding affinity may be candidates for drug discovery.12–17 The relatively short times needed to acquire one-dimensional (1D) 1H NMR spectra and the proportionality of peak intensities to compound concentrations makes this experimental modality ideal for routine, high-throughput profiling and screening procedures. However, higher dimensional data, mainly from 2D 1H,1H or 1H,13C NMR experiments, are occasionally utilized to verify the identity of metabolites.
Spin System Matrices As Fingerprints of Metabolites
The pattern of chemical shifts and the relative amplitudes of peaks are dependent on experimental conditions, such as the pH, solvent, temperature, and field strength at which the NMR spectrum was obtained.19–21 Because the spins in a compound are usually coupled, peak lists do not provide a robust representation for encoding information about experimental conditions. Field-dependent changes in the peak pattern (Figure 1) may hinder the analysis of data collected at a field different from that of the reference spectrum. Approximately 30–40% of the key metabolites considered in this study contain at least one pair of strongly coupled spin 1/2 nuclei, which lead to significant magnetic-field-dependent changes in their 1H NMR spectra (see the Supporting Information for details). One approach to addressing the variability of spectra is to develop and enforce a set of standard operating procedures (SOPs) for data collection.22,23 While SOPs are an integral element of good practice, limiting data collection to a single spectrometer frequency creates an artificial barrier to the power of exploring spectra at different field strengths.24,25
Figure 1.
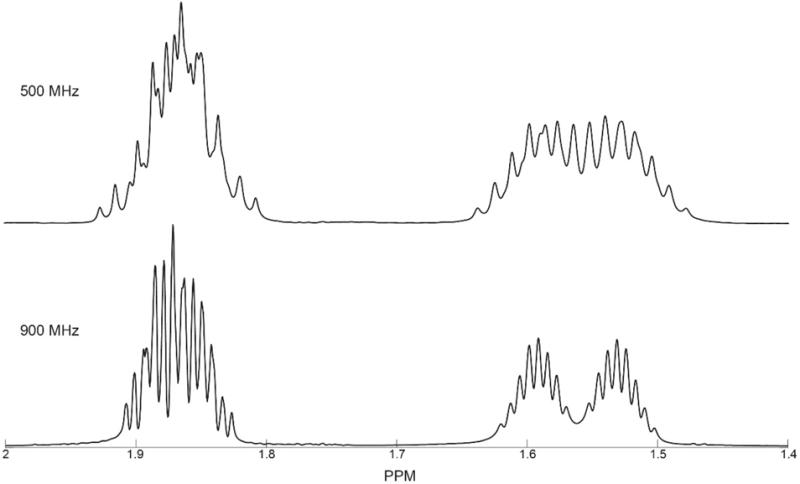
Example of the effect of magnetic field strength on an NMR spectrum. 1D-1H spectra of L-citrulline collected at fields corresponding to 1H frequencies of (top) 500 MHz and (bottom) 900 MHz. Only a small spectral subdomain [1.4, 2] ppm is displayed. The 500 MHz spectrum is from the BioMagResBank (BMRB ID: bmse000032) small molecule database.18 Data were collected on Bruker spectrometers.
An alternative approach is to model the behavior of spectra. Phenomenological models represent observational data after they have been corrected, rectified, and verified. Therefore, modeled data are often considered to be more “authenticated” and more “reliable” than raw data. As noted above, the most common model for parametrizing 1D-1H NMR spectra utilizes a peak list–the set of peak positions (ppm) and peak heights at specific positions. A much richer parametrization can be obtained through the use of a matrix of spin system26 parameters (spin system matrix), which encodes the full spectrum of the molecule.27–30 The spin system matrix, which is an ideographic representation of the chemical shifts and coupling constants for a given compound, is independent of the spectrometer frequency (B0) and line shape; it also provides a formal system for creating correction factor models for other effects.
Once the spin system matrix is constructed, it can be applied to obtain the spectrum of a compound at a different spectrometer frequency or with a different line shape model. Because the chemical shifts and spin–spin couplings are independent of certain experimental conditions (the magnetic field of the spectrometer or its homogeneity, which determines line shape), the spin parameters derived from spin system matrices can be used to accurately simulate NMR spectra under a variety of conditions. Moreover, these spin system matrices can be tuned to account for solution conditions (e.g., temperature, pH, and solvent) that lead to peak displacements and consequently altered spin–spin coupling patterns. The calculation and utilization of NMR spin system matrices may have applications beyond those focused on small molecule libraries, such as synthetic chemistry and educational projects.31,32
Calculation of Spin System Matrices
Several simulation software packages have been developed for the purpose of predicting NMR experimental spectra (for a list see http://www.east-nmr.eu/index.php/databases-and-links). Among the nonproprietary software packages, NMRdb,33 GAMMA,34 and Spinach35 are those more commonly used. The focus of these software packages is to produce an accurate approximation of the experimental data based on empirical or quantum mechanical computations–they are not designed to build spin system matrices by matching experimental spectra. The processes of formulating the spin Hamiltonian for a compound and obtaining the spectrum present computational challenges, owing to the exponential relation between the size of the Hamiltonian matrix and the number of spins in the compound of interest. Therefore, different approaches have been taken for simulating large spin system matrices, including the use of multicomputational processors,35 divide-and-conquer strategies for splitting the spin system matrix according to weak and strong couplings,36 and methods that utilize databases for predicting spin system matrices based on possible homologues.33,37,38 Nevertheless, the prediction of spin system matrices and generation of NMR peak patterns remains challenging; contributing factors include the structure-specific nature of 1H spin system matrices11 and the fact that experimental spectra represent a weighted average of the structural energy landscape of the molecule.
A few methods have been introduced whose goal has been to automate fitting peak shapes to experimental spectra.11,39–41 In these approaches, the spectrum is represented by a sum of functions, each of which represents a spin in the molecule. By broadening the peak line width, these methods attempt to minimize the L2 distance (mean squared error) between the experimental and the simulated spectrum of a compound. Cheshkov et al.39 have discussed the problems with this methodology and, to address some of its shortcomings, have introduced a simulated annealing approach for optimizing the L2 distance function. However, because the objective of this method is to approximate correct line shape parameters, the algorithm requires precise initial specification of the spin system matrix, and the heuristics introduced in the approach may converge to multiple local minima making it challenging to identify the correct spin system matrix.
The main challenge to automating the optimization procedure is the nonlinear relationship between the spin system matrix of a compound (as represented by the parameters to be optimized) and the difference (distance) between simulation and experimental spectra (as represented by the optimization score function). As mentioned above, the size of the spin system matrices generated from the Kronecker products increases exponentially with the number of spin 1/2 atoms in the 1H spin system matrix: for a compound with n spins, storage needs are on the order of O (22n). In addition, the parameters to be optimized include the diverse range of possible geminal, vicinal, and long-range couplings among the proton spins. Therefore, a blind exhaustive search on the domain is a highly inefficient way to optimize spin system matrices; and, instead, a carefully guided search over the domain of possible chemical shifts and coupling constants is needed. Although human intervention is to be avoided in automated processes, in specific cases, human expertise can greatly enhance the accuracy and efficiency of calculations.
We describe a software package called GISSMO, for guided ideographic spin system model optimization, which enables the efficient calculation and refinement of spin system matrices. GISSMO utilizes a graphical user interface (GUI) for guided optimization of spin system matrices against experimental 1D-1H NMR spectra of small molecules. The guided optimization approach is described in Methods; further details can be found in the Supporting Information. Results and Discussion reports the use of GISSMO to determine the chemical shifts and spin coupling values of a set of more than 400 compounds, including 128 metabolites found to be observable in NMR-based metabolomics studies of mammalian blood and tissue.42–45
METHODS
The workflow for calculating spin system matrices is shown in Figure 2. The ALATIS46 software package is used to assign unique and reproducible labels to the atoms in the compound. These labels are used to refer to the NMR-active nuclei in the spin system matrices. The GISSMO software package provides multiple approaches for creating the initial spin system matrix (Supporting Information). Here, the initial spin system matrices were generated by executing the NMRdb33 (MestreNova v10.0.1, http://mestrelab.com/) and Gaussian (http://www.gaussian.com/) software packages on the 3D structure files. The functions of the graphical user interface were used to optimize the initial spin system matrices against the experimental NMR spectra.
Figure 2.
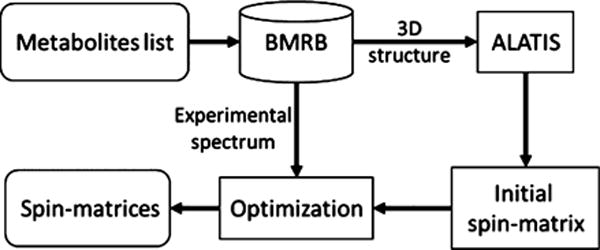
Overall workflow for fitting spin system matrices of the metabolites against experimental data. For each target metabolite, the spectrum and information about the 3D structure file were obtained from the BMRB. After unique label generation by ALATIS, an initial spin system matrix was created and optimized (in the L2 sense) to yield the best match to the experimental spectrum.
The GUI offers the selection of optimization tools for fitting chemical shifts and scalar couplings, including specific options for optimizations of AB, ABX, and ABXY spin–spin couplings against experimental spectra. The optimization procedures used by GISSMO include the Nelder–Mead simplex optimization,47,48 which can be used to carry out unconstrained exploration of an extended domain of values for chemical shifts and coupling constants. In addition, the GUI offers a selection of optimization methods (e.g., Voight line shape mixture coefficients). The optimization tools are described further in the Supporting Information. The amount of time required to optimize a spin system matrix to fit an experimental spectrum depends sharply on the number of constituent spins. As indicated in Table S1 (Supporting Information), by taking advantage of the sparsity of the underlying matrices, the process of simulating the spectrum of a spin system matrix with 10 spins takes about 1 s. The time required for interactive fitting is the product of this time and the number of optimization steps needed to achieve the desired correspondence between the simulated and experimental spectra. The direct analysis of spectra of compounds with a higher number of spins can be time-consuming; these include the large number of metabolites listed in the BMRB archive with more than 10 spins (Figure 3).
Figure 3.
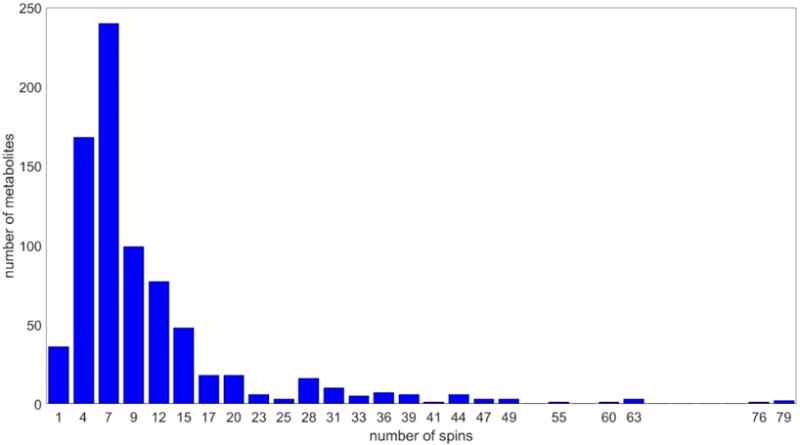
Number of BMRB entries from compounds with 1H NMR spectra containing a given numbers of spins. (x-axis) Survey of the entire BMRB metabolite database by number of spins. (y-axis) Number of compounds with the given number of spins.
To get around this problem, GISSMO provides an option for splitting large spin system matrices into smaller submatrices. This feature of the GUI makes the optimization of large spin system matrices feasible by optimizing smaller spin system matrices and subsequently merging the results into the original large spin system matrix in order to fit the entire experimental spectrum. This option is applicable on spin system matrices with any number of spins, and there is no restriction on the number of submatrices and the number of their constituent spins. Figure 4 shows the results for the spin system matrix of acetyl-L-carnitine (BMRB entry, bmse000464), which contains 17 spins. In this example, the direct simulation of the spectrum from its spin system matrix took more than 26 days, whereas dividing the spin system matrix into 3 smaller spin system matrices enabled the entire spin system matrix to be optimized in less than 1 min.
Figure 4.
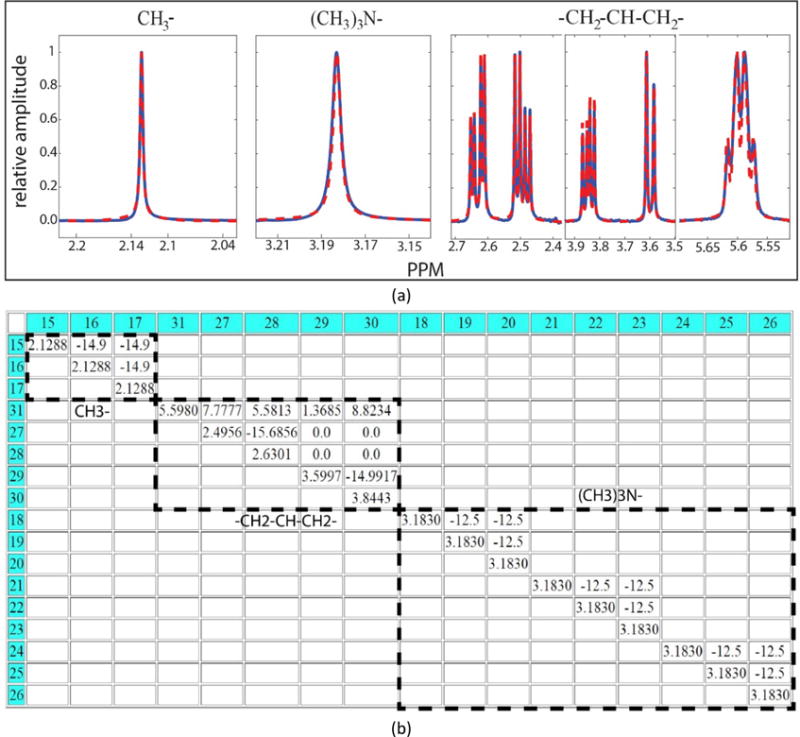
Output of spin simulation on a metabolite with 17 spins. (a) Outcome of optimizing spin submatrices against experimental data from BMRB. In these plots, the experimental data are shown as solid blue lines and the simulations are shown as red dashed lines. (b) Spin system matrix of acetyl-L-carnitine. The dashed lines indicate the way in which it was split into smaller spin submatrices.
The GUI provides an option for handling cases where the spin system matrix is not decomposable into smaller submatrices or where couplings between hydrogen and non-hydrogen atoms (e.g., 31P) need to be considered. This option and its technical details are described in the Supporting Information. As mentioned above, 2D NMR experiments can be used to resolve overlapping peaks in 1D-1H spectra. The GUI provides an option to load individual traces of 2D spectra and use them to distinguish overlapping peaks that correspond to different nuclei. Once identified, they can be combined into the optimized system matrix of the compound. Details concerning this option are in the Supporting Information.
RESULTS AND DISCUSSION
We have used the GISSMO software to obtain spin system matrix representations for a growing list of more than 400 compounds, including 128 key NMR metabolites extracted from published studies.42–45 The 3D molecular structures and experimental reference 1D-1H NMR spectra of these metabolites, acquired at a concentration of 100 mM and at pH 7.4, were downloaded from the BMRB archive.18 These reference spectra were collected on either a Bruker DMX 500 MHz or a Bruker DMX 400 MHz spectrometer at a temperature of 298 K. We are working to expand this list to the larger set of 1D-1H NMR spectra in the BMRB small molecule archive. The sample conditions for each metabolite studied are available at (http://gissmo.nmrfam.wisc.edu/).
The histogram in Figure 5a reports the number of spins in the 415 compounds examined to date. The histogram in Figure 5b shows the difference between the simulated and experimental spectra in terms of the RMSD100, the normalized root-mean-square distance between the amplitudes of every pair of discrete points in the experimental and simulated spectra.49 The RMSD was normalized to account for differences in the number of points in the simulated spectral region compared (no. of points) according to eq 1,
| (1) |
Figure 5.
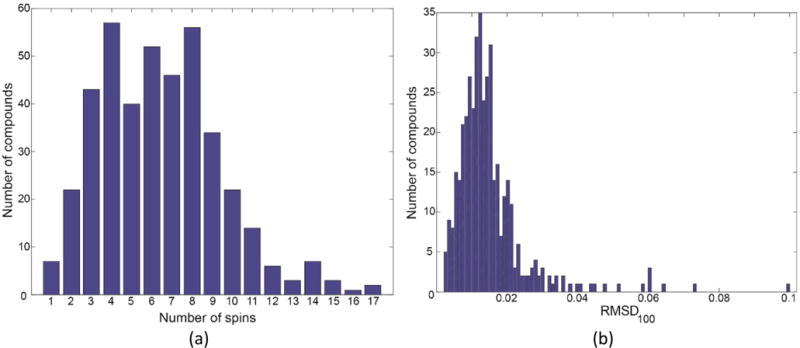
Statistics on simulated spectra from 415 compounds. The histogram (a) shows the number of spins on the x-axis versus the corresponding number of compounds on the y-axis. (b) Histogram of the RMSD100 values representing the differences between the simulated and experimental spectra of these compounds.
The RMSD100 exhibited no dependence on the number of spins simulated; the major factor was the quality of the experimental spectrum. For example, the poorest fit (RMSD100 = 0.1), which was for the spectrum of 4-isopropylbenzyl alcohol (BMRB ID, bmse000599), resulted from distortion in the experimental spectrum caused by the effects of water suppression.
As shown in Figure 6, a spin system matrix obtained with GISSMO makes it possible to simulate 1D-1H NMR spectra accurately at different field strengths. This feature will be useful for adapting existing spectra of small molecules in databases for use in analyzing NMR-based metabolomics data collected from spectrometers operating at different field strengths, including those under development that resonate 1H at 1.2 GHz. The spin system matrix representation should be helpful for parametrizing the effects of other changes in experimental conditions, such as concentration, solvent, temperature, or pH. For example, the parametrized spin system matrix can be used to empirically model pH effects by regressing on the spin parameters from spectra of a sample at several different pH values. In order to help users to estimate the effects of pH changes in spin system matrices, we provide the pKa values of the metabolites on our web server. These pKa values were extracted from the Handbook of Chemistry and Physics50 or alternatively from the PubChem51 or HMDB52–54 databases. By comparing these pKa values with the pH of the reference samples used for our optimization process (pH 7.4), we are able to specify the pH range over which the simulated spectra should be reasonably accurate.
Figure 6.
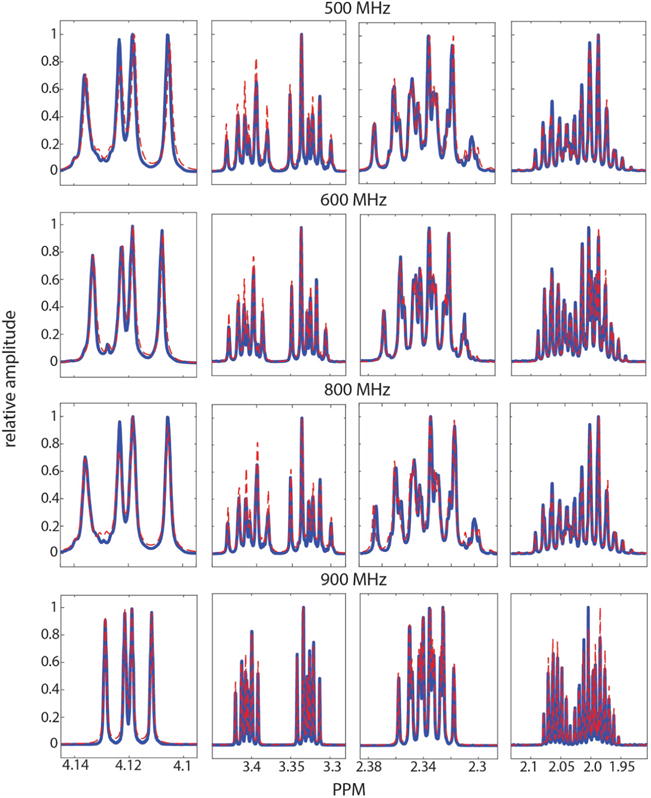
Comparison of experimental and simulated 1D-1H spectra of L-proline at different field strengths. We used GISSMO to optimize the spin system matrix of L-proline against an experimental spectrum obtained at 900 MHz. The extracted parameters were used to generate the simulated spectra at 500, 600, 800, and 900 MHz (red lines). These are compared to the experimental spectra of L-proline collected at the four field strengths (blue lines). Fitting of the simulated spectrum at 500 and 600 MHz was improved by adjusting the line width from 0.440 Hz, the value used for fitting the 900 MHz spectrum, to 0.526 Hz. The same line width is used for the 800 MHz as that for the 900 MHz spectrum.
We have developed an XML data-format representation of spin system matrices for use in storing the optimized spin system matrices. Spin system matrices can be loaded via the GISSMO GUI and used to simulate spectra at any magnetic field strength. The GUI, along with the current set of data, is installed and ready to use as a virtual machine (VM), which can be downloaded from (http://gissmo.nmrfam.wisc.edu/). In addition, the software package is available through the NMRBox55 project (https://nmrbox.org/).
The GISSMO software package is not constrained to investigations of metabolites; it is capable of calculating spin system matrices for a wide range of small molecules, including natural products and drug molecules. The Supporting Information details the procedures used in calculating a spin system matrix against an experimental NMR spectrum.
We plan to extend the GISSMO software package to enable refinement of spin system matrices to account for different solution conditions (e.g., compound concentration, pH, and temperature) and for the presence of other compounds in a mixture. In these cases, the initial point will be the spin system matrices of the constituent compounds derived from optimization against NMR spectra determined under standard solution conditions. We also plan to extend the analysis to spin system matrices of isotopomers involved in metabolic flux studies.
CONCLUSIONS
Characterization of the NMR spectra of small molecules through accurate parametric descriptions based on their spin system matrices has the potential of significantly improving the interpretation of NMR-based metabolic profiling and ligand-affinity screening. While reference databases provide experimental data for numerous compounds, these data are limited by the specific conditions under which the data were collected, such as spectrometer field strength, pH, temperature, ionic strength, and compound concentration. The GISSMO package presented here offers an efficient way to derive accurate spin system matrices for compounds of interest. The parametrization of spectra helps to address the need for accurate spectral signatures of compounds for NMR-based metabolomics at different NMR field strengths. Our web server makes available the spin system matrix representation of many metabolites commonly detected by 1D-1H NMR spectroscopy. The next steps in this development will be to incorporate these ideographic fingerprints into computational algorithms used to analyze the results of NMR-based metabolic profiling and ligand screening investigations. Toward this aim, we are in the process of incorporating these data, including the data model, into the BMRB database.
Supplementary Material
Acknowledgments
This study made use of the National Magnetic Resonance Facility at Madison, WI, which is supported by National Institutes of Health (NIH) Grant P41GM103399. Metabolite data were from BMRB, which is supported by NIH Grant GM109046. H.D., H.R.E., and J.R.W. are supported in part by the National Center for Biomolecular NMR Data Processing and Analysis, which is supported by NIH Grant P41GM111135.
Footnotes
Supporting Information
The Supporting Information is available free of charge on the ACS Publications website at DOI: 10.1021/acs.analchem.7b02884.
Explanation of the several modules of the graphical user interface used in conducting the guided optimization of a spin system matrix (PDF)
ORCID
John L. Markley: 0000-0003-1799-6134
Author Contributions
H.D. devised the algorithms, developed the software, and wrote the initial version of the manuscript. W.M.W. provided expertise in chemistry and NMR, helped devise algorithms, and optimized the spin system matrices for all compounds described here. M.T. collected NMR data. J.R.W. implemented the web server. J.L.M. helped write and edit the manuscript. H.R.E. conceived of the idea and helped write and edit the manuscript.
Notes
The authors declare no competing financial interest.
References
- 1.Ravanbakhsh S, Liu P, Bjordahl TC, Mandal R, Grant JR, Wilson M, Eisner R, Sinelnikov I, Hu X, Luchinat C, Greiner R, Wishart DS. PLoS One. 2015;10:e0124219. doi: 10.1371/journal.pone.0124219. [DOI] [PMC free article] [PubMed] [Google Scholar]
- 2.Clarke CJ, Haselden JN. Toxicol Pathol. 2008;36:140–147. doi: 10.1177/0192623307310947. [DOI] [PubMed] [Google Scholar]
- 3.Zhang S, Liu L, Steffen D, Ye T, Raftery D. Metabolomics. 2012;8:323–334. [Google Scholar]
- 4.Beckonert O, Keun HC, Ebbels TM, Bundy J, Holmes E, Lindon JC, Nicholson JK. Nat Protoc. 2007;2:2692–2703. doi: 10.1038/nprot.2007.376. [DOI] [PubMed] [Google Scholar]
- 5.Jupin M, Michiels PJ, Girard FC, Spraul M, Wijmenga SS. J Magn Reson. 2014;239:34–43. doi: 10.1016/j.jmr.2013.11.019. [DOI] [PubMed] [Google Scholar]
- 6.Larive CK, Barding GA, Dinges MM. Anal Chem. 2015;87:133–146. doi: 10.1021/ac504075g. [DOI] [PubMed] [Google Scholar]
- 7.Elmsjo A, Rosqvist F, Engskog MK, Haglof J, Kullberg J, Iggman D, Johansson L, Ahlstrom H, Arvidsson T, Riserus U, Pettersson C. Nutr Diabetes. 2015;5:e182. doi: 10.1038/nutd.2015.31. [DOI] [PMC free article] [PubMed] [Google Scholar]
- 8.Palma M, Hernandez-Castellano LE, Castro N, Arguello A, Capote J, Matzapetakis M, de Almeida AM. Mol BioSyst. 2016;12:2094–2107. doi: 10.1039/c5mb00851d. [DOI] [PubMed] [Google Scholar]
- 9.Vermathen M, Paul LEH, Diserens G, Vermathen P, Furrer J. PLoS One. 2015;10:e0128478. doi: 10.1371/journal.pone.0128478. [DOI] [PMC free article] [PubMed] [Google Scholar]
- 10.Whigham LD, Butz DE, Dashti H, Tonelli M, Johnson LK, Cook ME, Porter WP, Eghbalnia HR, Markley JL, Lindheim SR, Schoeller DA, Abbott DH, Assadi-Porter FM. Curr Metabolomics. 2013;1:269–278. doi: 10.2174/2213235X01666131203230512. [DOI] [PMC free article] [PubMed] [Google Scholar]
- 11.Napolitano JG, Lankin DC, McAlpine JB, Niemitz M, Korhonen S-P, Chen S-N, Pauli GF. J Org Chem. 2013;78:9963–9968. doi: 10.1021/jo4011624. [DOI] [PMC free article] [PubMed] [Google Scholar]
- 12.Campos-Olivas R. Curr Top Med Chem. 2011;11:43–67. doi: 10.2174/156802611793611887. [DOI] [PubMed] [Google Scholar]
- 13.Harner MJ, Frank AO, Fesik SW. J Biomol NMR. 2013;56:65–75. doi: 10.1007/s10858-013-9740-z. [DOI] [PMC free article] [PubMed] [Google Scholar]
- 14.Cala O, Guillière F, Krimm I. Anal Bioanal Chem. 2014;406:943–956. doi: 10.1007/s00216-013-6931-0. [DOI] [PubMed] [Google Scholar]
- 15.Kim HY, Wyss DF. In: Chemical Biology: Methods and Protocols. Hempel JE, Williams CH, Hong CC, editors. Springer; New York, NY: 2015. pp. 197–208. [DOI] [Google Scholar]
- 16.Fernández C, Jahnke W. Drug Discovery Today: Technol. 2004;1:277–283. doi: 10.1016/j.ddtec.2004.10.003. [DOI] [PubMed] [Google Scholar]
- 17.Cala O, Krimm I. J Med Chem. 2015;58:8739–8742. doi: 10.1021/acs.jmedchem.5b01114. [DOI] [PubMed] [Google Scholar]
- 18.Ulrich EL, Akutsu H, Doreleijers JF, Harano Y, Ioannidis YE, Lin J, Livny M, Mading S, Maziuk D, Miller Z, Nakatani E, Schulte CF, Tolmie DE, Kent Wenger R, Yao H, Markley JL. Nucleic Acids Res. 2007;36:D402–D408. doi: 10.1093/nar/gkm957. [DOI] [PMC free article] [PubMed] [Google Scholar]
- 19.Markley JL. Acc Chem Res. 1975;8:70–80. [Google Scholar]
- 20.Garcia-Viloca M, Gelabert R, Gonzalez-Láfont À, Moreno M, Lluch JM. J Am Chem Soc. 1998;120:10203–10209. [Google Scholar]
- 21.Cavanagh J, Fairbrother WJ, Palmer AGP, III, Rance M, Skelton NJ. Protein NMR Spectroscopy: Principles and Practice. 2nd. Academic Press; Burlington, MA, USA: 2007. [Google Scholar]
- 22.Lewis IA, Schommer SC, Hodis B, Robb KA, Tonelli M, Westler WM, Sussman MR, Markley JL. Anal Chem. 2007;79:9385–9390. doi: 10.1021/ac071583z. [DOI] [PMC free article] [PubMed] [Google Scholar]
- 23.Cui Q, Lewis IA, Hegeman AD, Anderson ME, Li J, Schulte CF, Westler WM, Eghbalnia HR, Sussman MR, Markley JL. Nat Biotechnol. 2008;26:162–164. doi: 10.1038/nbt0208-162. [DOI] [PubMed] [Google Scholar]
- 24.Markley JL, Bruschweiler R, Edison AS, Eghbalnia HR, Powers R, Raftery D, Wishart DS. Curr Opin Biotechnol. 2017;43:34–40. doi: 10.1016/j.copbio.2016.08.001. [DOI] [PMC free article] [PubMed] [Google Scholar]
- 25.Eghbalnia HR, Romero PR, Westler WM, Baskaran K, Ulrich EL, Markley JL. Curr Opin Biotechnol. 2017;43:56–61. doi: 10.1016/j.copbio.2016.08.005. [DOI] [PMC free article] [PubMed] [Google Scholar]
- 26.Corio PL. Structure of High-Resolution NMR Spectra. Academic Press; New York, NY, USA: 1967. [Google Scholar]
- 27.Anderson W, McConnell HM. J Chem Phys. 1957;26:1496–1504. [Google Scholar]
- 28.Corio PL. Chem Rev. 1960;60:363–429. [Google Scholar]
- 29.Keeler J. Understanding NMR Spectroscopy. 2nd. Wiley; Hoboken, NJ, USA: 2010. p. 526. [Google Scholar]
- 30.Bain AD, Berno B. Prog Nucl Magn Reson Spectrosc. 2011;59:223–244. doi: 10.1016/j.pnmrs.2010.12.002. [DOI] [PubMed] [Google Scholar]
- 31.Kamienska-Trela K, Wojcik J. Nuclear Magnetic Resonance. Vol. 41. Royal Society of Chemistry; London: 2012. Applications of spin-spin couplings; pp. 183–229. [DOI] [Google Scholar]
- 32.Ellison A. J Chem Educ. 1983;60:425. [Google Scholar]
- 33.Binev Y, Marques MMB, Aires-de-Sousa J. J Chem Inf Model. 2007;47:2089–2097. doi: 10.1021/ci700172n. [DOI] [PubMed] [Google Scholar]
- 34.Smith SA, Levante TO, Meier BH, Ernst RR. J Magn Reson Ser A. 1994;106:75–105. [Google Scholar]
- 35.Goodwin DL, Kuprov I. J Chem Phys. 2015;143:084113. doi: 10.1063/1.4928978. [DOI] [PubMed] [Google Scholar]
- 36.Castillo AM, Patiny L, Wist J. J Magn Reson. 2011;209:123–130. doi: 10.1016/j.jmr.2010.12.008. [DOI] [PubMed] [Google Scholar]
- 37.Binev Y, Corvo M, Aires-de-Sousa J. Journal of chemical information and computer sciences. 2004;44:946–949. doi: 10.1021/ci034229k. [DOI] [PubMed] [Google Scholar]
- 38.Lehtivarjo J, Niemitz M, Korhonen S-P. J Chem Inf Model. 2014;54:810–817. doi: 10.1021/ci500057f. [DOI] [PubMed] [Google Scholar]
- 39.Cheshkov DA, Sinitsyn DO, Sheberstov KF, Chertkov VA. J Magn Reson. 2016;272:10–19. doi: 10.1016/j.jmr.2016.08.012. [DOI] [PubMed] [Google Scholar]
- 40.Laatikainen R, Niemitz M, Weber U, Sundelin J, Hassinen T, Vepsaläiänen J. J Magn Reson Ser A. 1996;120:1–10. [Google Scholar]
- 41.Stephenson DS, Binsch G. J MagnReson (1969–1992) 1980;37:395–407. [Google Scholar]
- 42.Mlynárik V, Cudalbu C, Xin L, Gruetter R. J Magn Reson. 2008;194:163–168. doi: 10.1016/j.jmr.2008.06.019. [DOI] [PubMed] [Google Scholar]
- 43.Nagana Gowda GA, Gowda YN, Raftery D. Anal Chem. 2015;87:706–715. doi: 10.1021/ac503651e. [DOI] [PMC free article] [PubMed] [Google Scholar]
- 44.Merrifield CA, Lewis M, Claus SP, Beckonert OP, Dumas M-E, Duncker S, Kochhar S, Rezzi S, Lindon JC, Bailey M, Holmes E, Nicholson JK. Mol BioSyst. 2011;7:2577–2588. doi: 10.1039/c1mb05023k. [DOI] [PubMed] [Google Scholar]
- 45.Govindaraju V, Young K, Maudsley A. A. NMR Biomed. 2000;13:129–153. doi: 10.1002/1099-1492(200005)13:3<129::aid-nbm619>3.0.co;2-v. [DOI] [PubMed] [Google Scholar]
- 46.Dashti H, Westler WM, Markley JL, Eghbalnia HR. Sci Data. 2017;4:170073. doi: 10.1038/sdata.2017.73. [DOI] [PMC free article] [PubMed] [Google Scholar]
- 47.Lagarias JC, Reeds JA, Wright MH, Wright PE. SIAM J Optimization. 1998;9:112–147. [Google Scholar]
- 48.Nelder JA, Mead R. Computer Journal. 1965;7:308–313. [Google Scholar]
- 49.Carugo O, Pongor S. Protein Sci. 2001;10:1470–1473. doi: 10.1110/ps.690101. [DOI] [PMC free article] [PubMed] [Google Scholar]
- 50.Lide DR, editor. Handbook of Chemistry and Physics. 84th. CRC Press; Boca Raton, FL, USA: 2003. [Google Scholar]
- 51.Kim S, Thiessen PA, Bolton EE, Chen J, Fu G, Gindulyte A, Han L, He J, He S, Shoemaker BA, Wang J, Yu B, Zhang J, Bryant SH. Nucleic Acids Res. 2016;44:D1202–D1213. doi: 10.1093/nar/gkv951. [DOI] [PMC free article] [PubMed] [Google Scholar]
- 52.Wishart DS, Jewison T, Guo AC, Wilson M, Knox C, Liu Y, Djoumbou Y, Mandal R, Aziat F, Dong E, Bouatra S, Sinelnikov I, Arndt D, Xia J, Liu P, Yallou F, Bjorndahl T, Perez-Pineiro R, Eisner R, Allen F, et al. Nucleic Acids Res. 2012;41:D801–807. doi: 10.1093/nar/gks1065. [DOI] [PMC free article] [PubMed] [Google Scholar]
- 53.Wishart DS, Knox C, Guo AC, Eisner R, Young N, Gautam B, Hau DD, Psychogios N, Dong E, Bouatra S, Mandal R, Sinelnikov I, Xia J, Jia L, Cruz JA, Lim E, Sobsey CA, Shrivastava S, Huang P, Liu P, et al. Nucleic Acids Res. 2008;37:D603–D610. doi: 10.1093/nar/gkn810. [DOI] [PMC free article] [PubMed] [Google Scholar]
- 54.Wishart DS, Tzur D, Knox C, Eisner R, Guo AC, Young N, Cheng D, Jewell K, Arndt D, Sawhney S, Fung C, Nikolai L, Lewis M, Coutouly MA, Forsythe I, Tang P, Shrivastava S, Jeroncic K, Stothard P, Amegbey G, et al. Nucleic Acids Res. 2007;35:D521–526. doi: 10.1093/nar/gkl923. [DOI] [PMC free article] [PubMed] [Google Scholar]
- 55.Maciejewski MW, Schuyler AD, Gryk MR, Moraru I, Romero PR, Ulrich ER, Eghbalnia HR, Livny M, Delaglio F, Hoch J. Biophys J. 2017;112:1529–1534. doi: 10.1016/j.bpj.2017.03.011. [DOI] [PMC free article] [PubMed] [Google Scholar]
Associated Data
This section collects any data citations, data availability statements, or supplementary materials included in this article.


