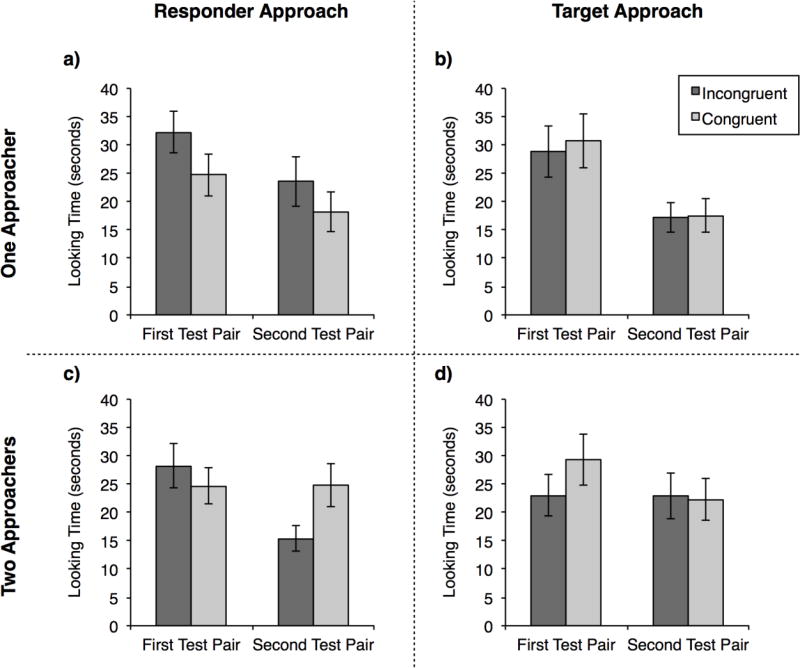
Figure 6.
Mean looking times for each test pair from the four conditions of Experiment 4. Responder approach conditions are represented on the left and target approach conditions on the right. Conditions with a single approacher are represented on the top row, and those with two approachers on the bottom row. Error bars represent SEM.

