

LETTER FORMAT
Noroviruses are the leading cause of foodborne gastroenteritis outbreaks and childhood diarrhea globally, estimated to be responsible for 200,000 deaths of children each year1–4. Thus, reducing norovirus-associated disease is a critical priority. Development of vaccines and therapeutics has been hindered by limited understanding of basic norovirus pathogenesis and cell tropism. While macrophages (Mφ), dendritic cells (DC), B cells, and stem cell-derived enteroids can all support infection of certain noroviruses in vitro5–7, efforts to define in vivo norovirus cell tropism have generated conflicting results: Certain studies detected infected intestinal immune cells8–12, other studies detected epithelial cells13, and still others detected immune and epithelial cells14–16. Major limitations of these studies are that they were performed on tissue sections from immunocompromised or germ-free hosts, chronically infected hosts where the timing of infection was unknown, or following non-biologically relevant inoculation routes. Here we report that the dominant cellular targets of a murine norovirus inoculated orally into immunocompetent mice are Mφ, DC, B cells and T cells in the gut-associated lymphoid tissue (GALT). Importantly, we also demonstrate that a norovirus can infect T cells, a previously unrecognized target, in vitro. These findings represent the most extensive analyses to date of in vivo norovirus cell tropism in orally inoculated, immunocompetent hosts at the peak of acute infection, and thus they significantly advance our basic understanding of norovirus pathogenesis.
Previous efforts to identify norovirus-infected cells along the gastrointestinal (GI) tract relied on detection of viral structural or nonstructural proteins; and results of these studies have generally reported a low number of infected cells8–10,13–16. This is incongruous with the extremely high amount of virus shed in the stool of norovirus-infected hosts17–20. Thus, we hypothesized that rare pockets of robust norovirus infection exist along the GI tract that had yet to be detected either due to insufficient sensitivity of detection methods, insufficient sampling of the target tissue, and/or confounding issues with high background signal inherent to intestinal tissue. RNAScope in situ hybridization (ISH) was an attractive approach to address these possibilities due to its exquisite sensitivity and specificity. The mouse model of norovirus infection is well-established, has been widely used to gain insight into general norovirus pathogenesis, and was ideally suited to our purposes as wild-type mice are susceptible to oral murine norovirus infection21. We first validated probes specific to plus-strand and minus-strand murine norovirus 1 (MNV-1) RNA, the latter being a replication intermediate only produced during intracellular replication and therefore indicative of productive infection of target cells, using a murine Mφ cell line (RAW264.7) known to be permissive to MNV-16. As expected, nearly all infected cells were positive for both plus- and minus-strand genomes while minimal signal was observed in mock-inoculated cells (Supplementary Fig. 1a). To next test whether virus-specific probes could detect infected cells in vivo, we inoculated wild-type B6 mice with 107 TCID50 units MNV-1 by the peroral route and collected intestinal tissue at 24 hours post-infection (hpi), representing the peak of acute infection22. Three consecutive pieces comprising the entire small intestine in (SI-1, -2, and -3) and the colon (CO) were processed as described in the Methods (Supplementary Fig. 1b). Confirming RNA integrity of our samples, intestinal sections hybridized with a positive control probe specific to the housekeeping peptidyl-prolyl cis-trans isomerase B (PPIB) transcript displayed strong and uniform signal throughout the intestine whereas sections hybridized with a nonspecific negative control probe targeting the bacterial dapB transcript were devoid of signal (Supplementary Fig. 1c). Confirming specificity of virus probes, intestinal sections from naive mice hybridized with either the plus-strand or minus-strand viral probes were also devoid of signal (Supplementary Fig. 1d). Tissue sections from naive or mock-inoculated mice were probed in parallel with virus-infected tissue sections in every experiment of this study to ensure absence of background signal.
We next hybridized sections from swiss rolls of MNV-1-infected mice at 24 hpi with the plus-strand virus probe. Consistent with virus titer data (Supplementary Fig. 2a), viral foci were observed in SI-2 and SI-3 of all infected mice; however, there were minimal to no viral foci detected in SI-1 or CO rolls (Supplementary Fig. 2b shows all rolls and layers from a representative experiment, with viral foci boxed). Importantly, virus-positive signal was not uniformly detected in the five layers of a given roll, even in SI-2 and SI-3 (Supplementary Fig. 2b). The localization of minus-strand viral RNA mirrored that of plus-strand RNA, although at expectedly reduced levels (Supplementary Fig. 2c). The paucity of signal in SI-1 and CO rolls was surprising given the modest but detectable virus titers in these intestinal segments (Supplementary Fig. 2a). One possible explanation is that virus titers reflect both tissue-associated and mucosa-bound virus and are thus not necessarily an accurate reflection of infection; whereas ISH detects only tissue-associated virus. However, we observed no reduction in virus titers upon removal of the mucosa (Supplementary Fig. 3) and we previously reported that nearly all virus titered from intestinal segments at 24 hpi reflects newly synthesized virus in contrast to residual input virus5. An alternative possibility is that the sporadic nature of infection minimizes the likelihood of detecting viral foci in regions with modest levels of infection and that more extensive sampling of SI-1 and CO is required to detect existing viral foci by RNAscope ISH. We speculate that this nonuniform nature of infection contributed to the difficulty that we and others have had in previous attempts to detect norovirus-infected cells in intestinal sections. In spite of its patchy nature, a clear pattern of infection emerged: A majority of virus-positive signal was detected in the gut-associated lymphoid tissue (GALT) comprised of Peyer’s patches and isolated lymphoid follicles (ILFs). Overall, these data indicate that the GALT within the distal two-thirds of the small intestine (i.e. the jejunum and ileum) is the primary target of MNV-1; while the proximal third of the small intestine (i.e. the duodenum) and the colon support modest levels of infection.
To begin determining the types of cells targeted by MNV-1, intestinal sections hybridized with plus- and minus-strand viral probes were analyzed at higher magnification. While plus-strand genomes were detected throughout the GALT, minus-strand antigenomes were preferentially detected in the subepithelial dome with minimal signal in the B cell-rich germinal centers (Fig. 1a). Productive infection as indicated by the presence of minus-strand antigenomes was typically confined to subepithelial cells (Fig. 1b, left inset) although, in very rare instances, minus-strand antigenomes were also observed in the follicle-associated epithelium (FAE) (Fig. 1b, right inset). To gain insight into the relative contribution of FAE versus subepithelial cell infection, cells positive for minus-strand viral RNA were enumerated in each layer of each intestinal segment from six infected mice. No minus-strand viral RNA was detected in CO and very few dots were observed in SI-1 (Supplementary Fig. 2c). On the other hand, there were an average of 335 subepithelial cells, 64 cells in the FAE, and 33 undefinable cells positive for viral minus-strand RNA in layers of SI-2 and SI-3 (Fig. 1b). We infrequently detected intestinal villi with substantial numbers of lamina propria cells positive for plus-strand genomes, and even less frequently minus-strand genomes (Fig. 1c). These data suggest the predominant targets of acute norovirus infection are immune cells within the GALT.
Figure 1. MNV-1 infects subepithelial dome cells in the GALT.

a) Representative images of infected GALT hybridized with MNV-1-specific probes. Scale bars indicate 100μm. b) Representative images of a Peyer’s patch in which minus-strand viral RNA was only detected in subepithelial cells (left inset, typical pattern) versus a Peyer’s patch in which minus-strand viral RNA was detected in the FAE and subepithelial cells (right inset, rare pattern). The relative contribution of subepithelial cell versus FAE infection within the GALT was quantified as described in the Methods. Scale bars indicate 100μm. c) Representative images of intestinal villi hybridized with MNV-1-specific probes. Scale bars indicate 100μm. The vertical lines apparent in certain images are a byproduct of the image stitching process used by the slide scanner to create high-resolution images (see Methods).
To discern the specific types of cells productively infected within the GALT, we next performed multi-probe hybridizations with the minus-strand viral RNA probe and a panel of cell-specific probes (CD11c+CD4− for DC and CD11c+CD4+ for Mφ23; CD19+ for B cells; CD3+ for T cells; and EpCAM+ for epithelial cells) using RNAscope fluorescent ISH (FISH). The expected distribution of each cell type was observed throughout the intestinal tissue; and infected cells were predominantly observed in the GALT (Fig. 2A and Supplementary Fig. 4), consistent with chromogenic assays although the FISH assay was notably less sensitive than the chromogenic assay (Supplementary Fig. 5). Viral minus-strand RNA was detected in CD11c+CD4− DC (Fig. 2b), CD11c+CD4+ Mφ (Fig. 2c), CD19+ B cells (Fig. 2d), and CD3+ T cells (Fig. 2e). Although we occasionally detected viral minus-strand RNA in the FAE in chromogenic assays (Fig. 1b), we did not observe EpCAM-positive infected cells by RNAscope FISH. It is possible that this is explained by the difference in chromogenic and fluorescent assay sensitivities (Supplementary Fig. 5). Alternatively, these cells could be intraepithelial lymphocytes (IEL), a possibility that will be probed in future studies. The absence of substantial epithelial cell infection along the GI tract is consistent with our and others’ previous reports that epithelial cells do not support MNV infection in vitro5,24,25 (and Fig. 4a). Because Peyer’s patches were observed to be the major target of MNV-1 infection, we next measured virus titers in Rag1−/− mice which lack Peyer’s patches. Indeed, virus titers were significantly reduced in all intestinal regions of Rag1−/− mice compared to wild-type B6 mice (Fig. 3).
Figure 2. MNV-1 infects Mφ, DC, B cells, and T cells in the small intestinal GALT.


Serial sections of SI-3 from MNV-1-infected mice at 24 hpi (n = 3) were hybridized with the MNV-1 minus-strand viral RNA-specific probe (green) and probes specific to the indicated cell markers (red or magenta). Cell nuclei were stained using DAPI (blue). Images taken at 20X magnification (a) and 63X magnification (b–e). In panels B–E, individual cells are outlined in white. Mock-inoculated mice (n = 2) were tested in parallel and no virus signal was observed (e.g., Supplementary Fig. 1d). The entire experiment was repeated twice. Scale bars represent 50μm (a) and 5μm (b–e).
Figure 4. MNV-1 infects T cells nonlytically in vitro, and infection correlates with CD300lf expression frequency.

a–b) Duplicate wells of the indicated cell lines were infected with mock inoculum or MNV-1 at MOI 5. Virus titers were determined by TCID50 assay on culture supernatants (a) and cell viability was assessed by propidium iodide staining (b) at the indicated time points. Error bars denote SEM. c) The frequency and abundance of cells expressing the MNV-1 receptor CD300lf were determined on naïve cells by flow cytometric staining using a matched isotype antibody as a negative control. d) Peyer’s patches cells from B6 mice (n=6) were stained with two panels of antibodies (see Methods). The frequency and abundance of DC/Mφ (CD45+ CD11c+), B cells (CD45+CD19+B220+), T cells (CD45+CD3+), and intestinal epithelial cells (CD45−EpCAM+) expressing CD300lf were determined. For all panels, experiments were performed three times.
Figure 3. MNV-1 titers are reduced in Peyer’s patch-deficient Rag1−/− mice.
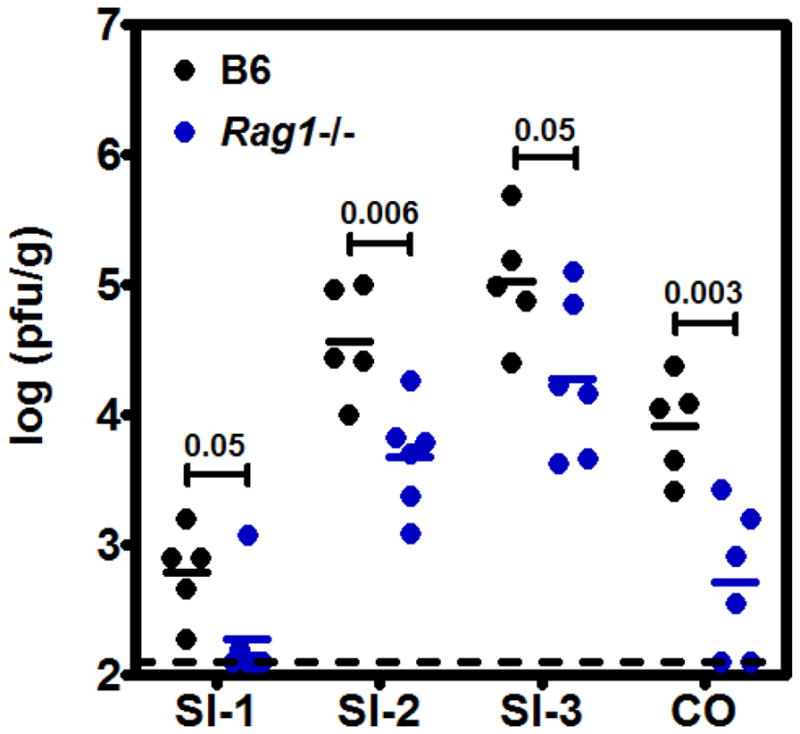
Groups (n = 2–3) of B6 (black dots) and Rag1−/− (blue dots) mice were infected perorally with 106 TCID50 units MNV-1. At 24 hpi, virus titers were determined by plaque assay. The entire experiment was repeated twice (n = 5–6 mice total per group). The data are reported as pfu/g of tissue. The two mouse strains were compared for each tissue using unpaired two-tailed t tests for statistical purposes and the P values are indicated above each set of values.
Although DC, Mφ, and B cells have been previously demonstrated to support norovirus infection in vitro5,6, productive norovirus infection of T cells has not been reported. To this end, we next infected the murine T cell line EL4 with MNV-1 at MOI 5 and analyzed virus growth kinetics. The murine Mφ cell line RAW264.7 and murine B cell lines M12 and WEHI served as positive controls, while the murine intestinal epithelial cell line CMT-93 served as a negative control5. Peak titers in RAW264.7 cells were observed at 24 hpi at which point virus decay was observed (Fig. 4a), coinciding with nearly complete loss in cell viability (Fig. 4b). Peak titers in M12 and WEHI cells were observed at 72 and 24 hpi, respectively (Fig. 4a). These cell lines displayed variable levels of cytopathicity, with M12 cultures displaying a modest loss in viability over 96 h of infection and the WEHI cells displaying a more substantial initial loss in viability but recovering by 72 hpi (Fig. 4b). The CMT-93 cells failed to support MNV-1 infection (Fig. 4a). These results are all consistent with our previously published findings5. The T cell line EL4 was permissive to MNV-1 albeit reaching reduced peak titers compared to all other permissive cells lines; the kinetics of infection were similar to those in M12 cells (Fig. 4a). Remarkably, there was no reduction in viability of infected EL4 cultures compared to mock-inoculated cultures (Fig. 4b), demonstrating that T cell infection is nonlytic in spite of substantial release of progeny virus into the supernatant. Because the MNV receptor has recently been identified as the CD300lf molecule26,27, we tested whether permissivity in cell lines directly correlated with receptor levels (Fig. 4c and Supplementary Fig. 7): Indeed, RAW264.7 and WEHI cell lines displayed the highest frequency (86% and 92%, respectively) and abundance of CD300lf positivity, with M12 and EL4 lines expressing these molecules at reduced frequencies (26% and 19%, respectively) and abundance. Nonpermissive CMT-93 cells did not express appreciable levels of CD300lf. To further substantiate the correlation between receptor expression and permissivity, we identified another CD300lf-negative cell line, Neuro2A, which failed to support MNV infection (Figs. 4a–c and Supplementary Fig. 7). Finally, we measured CD300lf expression frequencies on Peyer’s patch cell types. Consistent with in vitro observations, permissive immune cells expressed the receptor to varying degrees while epithelial cells expressed minimal CD300lf (Fig. 4d and Supplementary Fig. 8c). Overall, these data demonstrate that T cells are a novel target of MNV-1 infection in vitro and in vivo, and that viral infection of T cells is nonlytic in vitro. Interestingly, viral capsid protein was detected in intestinal T cells of biopsy tissue from immunocompromised patients chronically infected with a human norovirus14, suggesting that T cells are a common but previously unrecognized target of noroviruses.
In summary, our data prove that the cell tropism of a norovirus is predominantly distal ileum GALT immune cells, including Mφ, DC, B cells, and T cells, as well as rare cells within the FAE. Importantly, these data were generated in immunocompetent hosts following oral inoculation at the peak of acute infection. Our results are consistent with those of Karandikar et al., in which biopsies from chronically infected immunocompromised people were analyzed for the presence of viral protein14: In these subjects, a majority of viral antigen was detected in the intestinal lamina propria which contains a variety of immune cells while epithelial cells were a minor target of infection (see Supplementary Table 2 in Karandikar et al.14). This consistency between human and murine norovirus cell tropism lends significant weight to the power of the mouse model of infection for general pathogenesis studies. Infection of the GALT was not absolute in our model since there were numerous Peyer’s patches and ILFs in SI-2 and SI-3 of infected mice that were devoid of signal. The sporadic nature of infection provides an explanation for the difficulty in detecting infected cells in previous studies. Moreover, these data suggest that a yet-to-be-defined host factor either promotes infection at infrequent regions of the gut; or that an inhibitory factor may prevent infection of a majority of the tissue. For example, M cells overlying the FAE display regional and species-specific variability in glycan expression patterns28. Considering that noroviruses are well-established to bind host glycans29 and to exploit M cells for virus entry24,25, this could represent a critical regulator of norovirus tropism. This host regulation of norovirus infection along the intestinal tract will be an exciting future area of research to be explored.
METHODS
Cells and viruses
The RAW264.7 (ATCC), 293T (provided by Fanxiu Zhu, Florida State University), M12 (provided by Scott Tibbetts, University of Florida), WEHI (provided by Scott Tibbetts, University of Florida), EL4 (provided by Dorina Avram, University of Florida), CMT-93 (ATCC), and Neuro2A (provided by David Bloom, University of Florida) cell lines tested negative for mycoplasma. Cell lines were not authenticated by our laboratory. RAW264.7, 293T, EL4, and CMT-93 lines were grown in Dulbecco’s modified Eagle media (DMEM; Corning) supplemented with 10% fetal bovine serum (FBS; Omega), 100 U/mL of penicillin, 100 μg/mL streptomycin, and 2 mM L-glutamine; EL4 cells were also supplemented with 0.05 mM 2-mercaptoethanol. M12 and WEHI lines were cultured in Roswell Park Memorial Institute 1640 media (RPMI; Corning) supplemented with 10% FBS, 100 U/mL penicillin, 100 μg/mL streptomycin, 2mM L-glutamine, and 0.05 mM 2-mercaptoethanol. Neuro2A cells were grown in Eagle’s Minimum Essential media (MEM; Corning) supplemented with 10% FBS, 100 U/mL penicillin, 100 μg/mL streptomycin, 1.5 g/L sodium bicarbonate, and 2 mM L-glutamine. Stocks of recombinant MNV-1 (GenBank accession number KC782764) were generated as previously described30. In brief, 293T cells were transfected with 5 μg of infectious clone plasmid DNA per 106 cells using Lipofectamine 2000 (Life Technologies) and lysed by freeze-thawing 1 d post transfection. 293T lysates were used to infect RAW264.7 cells at MOI 0.05. RAW264.7 lysates were prepared when ~90% of cells displayed cytopathic effect (CPE) and purified through a 25% sucrose cushion. Viral stocks were titered using a standard TCID50 assay20.
Mice and infections
Specific-pathogen-free (SPF) mice used in this study were bred and housed in animal facilities at University of Florida. All animal experiments were performed in strict accordance with federal and university guidelines. The animal protocol was approved by the Institutional Animal Care and Use Committee at the University of Florida (study number 201408668). Experiments were not performed in a blinded fashion nor was randomization used. Eight- to ten-week old, sex-matched C57BL/6J (Jackson no. 000664; referred to as B6) or B6RAG1−/− (Jackson no. 002216; referred to as Rag1−/−) mice were inoculated perorally (p.o.) with the indicated dose of MNV-1. Both male and female mice were used. For virus load determination, tissue samples were harvested at 24 hpi and titrated by plaque assay, as previously described30,31. To remove the mucosal layer in certain experiments, intestinal segments were cut open longitudinally, scraped with a plastic cell spreader, and washed vigorously three times with 15 ml phosphate buffered saline (PBS) each. For quantitative analyses, sample sizes were chosen after power analysis to obtain a power of 80% at α = 0.05. For RNAscope studies, intestinal swiss rolls were generated at 24 hpi. Specifically, the small intestine was dissected into three consecutive segments of equivalent length referred to as SI-1, SI-2, and SI-3 and each segment was rolled separately. The colon was processed as a single large intestinal (CO) swiss roll. Swiss rolls were immediately fixed in 10% buffered formalin for 16 hours, transferred to PBS, and then paraffin-embedded and sectioned by the University of Florida Molecular Pathology Core. Serial sections of 4 μm thickness were cut from each of five layers per swiss roll at 500 μm intervals (Supplementary Fig. 1b). Paraffin-embedded tissue blocks and slides were stored at 4°C within a desiccator to maintain RNA integrity. For qualitative analyses, sample sizes of mock (n=4) and infected (n=6) mice were chosen due to extensive sampling of each mouse, which provided a definitive representation of MNV-1 cell tropism.
RNAscope ISH
For preparing in vitro samples, RAW264.7 cells were grown on coverslips in six-well plates at a density of 1×10⁶ cells/mL and infected with mock inoculum or MNV-1 at MOI 5. At 16 hpi, cells were fixed in 10% buffered formalin, dehydrated in a series of ethanol submersions, and rehydrated in PBS prior to probe hybridization. For preparing tissue sections, formalin-fixed paraffin-embedded (FFPE) tissues were deparaffinized at 60°C for 30 minutes followed by xylene treatment prior to dehydration. All RNAscope ISH assays were performed using the RNAscope 2.5 HD Assay-RED kit according to manufacturer’s instruction (Advanced Cell Diagnostics, Newark, CA). In brief, cells or tissues were hybridized with custom-designed probes specific for plus-strand or minus-strand MNV-1 RNA for 2 h at 40°C. A positive control probe specific to the PPIB housekeeping gene transcript and a negative control probe specific to the bacterial dapB transcript were used as quality controls in each experiment. Sections were stained with 50% hematoxylin to visualize cellular architecture. Images of RAW264.7 cells were acquired using a Zeiss Axioskop 2 with color Axiocam HR camera and Axiovision 4.7 software. Tissue sections were imaged using either an Aperio ScanScope XT slide scanner and analyzed using Aperio ImageScope software (Leica Biosystems), or a Zeiss Axioskop 2 with color Axiocam HR camera and Axiovision 4.7 software. The Aperio ScanScope XT slide scanner uses line-scanning technology to create high-resolution images. In some instances (e.g., the right panels of Fig. 1c), vertical lines appeared as a byproduct of the image stitching process; these were not a result of manual image manipulation. Uninfected cells or tissues were analyzed in every experiment, with the intent to exclude experiments in which nonspecific signal was observed in negative control slides. However, the only nonspecific signal observed in any experiment was associated with fat dissected with intestinal tissue; this signal was blurry and faint in contrast to the expected punctate signal, and was observed at comparable levels in naïve and infected tissues. Thus, this signal was clearly distinguishable from positive signal and did not lead to exclusion of samples. To quantify the abundance of productively infected subepithelial cells and cells in the FAE in stained tissue sections (Fig. 1b), individual dots corresponding to minus-strand viral RNA were counted throughout each layer of a given swiss roll and averaging these values for each roll. This process was performed on six individual mice and the averaged data for SI-2 and SI-3 of each mouse are presented. Therefore, each dot represents the number of infected cells counted in 60 tissue sections (5 layers per segment × 2 segments per mouse × 6 mice). Minimal viral signal was detected in SI-1 rolls and no signal was detected in CO rolls (Supplementary Fig. 2c). The same analysis was performed for mock-inoculated intestinal tissue sections but no viral foci were observed (Supplementary Fig. 1d). Hematoxylin staining of the tissue enabled the differentiation of subepithelial cells and cells within the FAE since the single layer of epithelial cells plus interspersed IEL lining the entire gut wall has a defined location and morphology. In cases where the infected cell type was questionable, we counted these as undefinable. In three instances, a Peyer’s patch had too many subepithelial cells positive for minus-strand signal to count reliably; these were given a value of 1000 positive subepithelial cells which represents a conservative estimate. The values for each layer of a given roll (e.g., L1–L5 for SI-3) were averaged; and the SI-2 and SI-3 values for individual mice were then averaged.
RNAscope FISH
The RNAscope Multiplex Fluorescent Detection Kit v2 (Advanced Cell Diagnostics, Newark, CA) was used to perform dual or triple hybridizations with the MNV-1 minus-strand probe and cell-specific probes (CD11c and CD4 for DC [CD11c+CD4−] and Mφ [CD11c+CD4+]; CD19 for B cells; CD3 for T cells; and EpCAM for epithelial cells) on FFPE tissue sections. Serial sections from individual layers were hybridized with the viral minus-strand probe and one or two of the five cell-specific probes. After horseradish peroxidase (HRP) addition to the probes, a tryamide signal amplification (TSA)-conjugated cyanine 5 (Cy5) fluorophore (Perkin Elmer) was used to visualize viral minus-strand RNA and a TSA-conjugated Cy3 (CD11c, CD19, CD3, and EpCAM) or fluorescein (FITC; CD4) fluorophore was used to visualize the cell-specific transcript. Tissues were counterstained with DAPI and mounted using ProLong Gold Antifade Mountant (ThermoFisher Scientific). Images for FISH were acquired using a Carl Zeiss LSM710 confocal microscope (Germany) using the ZEN Digital Imaging software (Zeiss). Z-stacks were taken at 63x magnification using 0.5 or 1 intervals. Single color controls, along with positive and negative control probes (PPIB and DapB, respectively) were stained in parallel.
Virus growth curves and viability assays
RAW264.7, M12, WEHI, EL4, CMT-93, and Neuro2A cells were infected with mock inoculum or MNV-1 at MOI 5 and incubated for 1 h at room temperature. Cells were then washed once with PBS to remove unbound virus and incubated at 37°C. Supernatants were collected from duplicate wells per condition at 0, 24, 48, 72, and 96 hpi and virus titers determined by standard TCID50 assay, as has been described20,31. From the same infections, cells at each time point were incubated with propidium iodide (BD Pharmingen) at a final concentration of 2.5 μg/ml for 5 min at room temperature. Flow cytometric analysis was performed on a FACSCalibur instrument with BD CellQuest Pro software (BD Biosciences) and FCSExpress software used for analysis. Data are reported as the percentage of cells in infected wells that did not incorporate dye compared to the percentage of cells in mock-inoculated wells at the same time point that did not incorporate dye (relative viability). Unstained cells were used to set the gate (Supplementary Fig. 6).
Flow cytometric assay using cell lines
Cells were resuspended in FACS buffer containing 1% BSA and 0.5 μg/mL anti-mouse CD16/CD32 (eBioscience) to block Fc receptors. All cell lines were stained with a polyclonal anti-mouse CD300lf antibody (R&D Systems, AF2788) or appropriate isotype control antibody (R&D Systems, AB-108-C) at 0.1 μg per 106 cells, and then with donkey anti-goat IgG secondary antibody conjugated to AlexaFluor 488 (Abcam, ab150129) at 0.05 μg per 106 cells. Cells were washed extensively and resuspended in FACS buffer for data acquisition on a FACSCalibur instrument with BD CellQuest Pro software. Data were analyzed using FCS Express 4 (De Novo Software) and are presented as the frequency of CD300lf-positive cells and the mean fluorescence intensity (MFI) as a measure of receptor abundance. Gates were set using isotype control antibody staining (Supplementary Fig. 7).
Flow cytometric assay using in vivo samples
Spleens and Peyer’s patches were harvested from 3 male or 3 female B6 mice per experiment into 10% DMEM containing 1mg/mL collagenase D (Sigma-Aldrich, 11088858001)and incubated on a shaker at 37°C for 30 minutes before mechanical disruption through a 70μm cell strainer to generate single-cell suspensions. Cells were washed in PBS and incubated with Live/Dead Fixable Aqua dye (ThermoFisher, L34965). Fc receptors were then blocked as described above and cells were stained with a primary antibody against CD300lf (R&D Systems, AF2788). Cells were then washed and stained with a cocktail of fluorescent antibodies against specific cell surface markers and an Alexa Fluor 647-conjugated donkey anti-goat secondary antibody for detection of CD300lf (Abcam, ab150131). The following antibodies were used in one multicolor panel alongside CD300lf (panel 1): anti-mouse CD19 PE (clone 1D3, eBioscience, 12-0193), anti-mouse B220 PE-Cy7 (clone RA3-6B2, BioLegend, 103221), anti-mouse CD11c FITC (clone N418, BioLegend, 117305), and anti-mouse CD45 Pacific Blue (clone 30-F11, BioLegend, 103125). The following antibodies were used in a separate panel alongside CD300lf (panel 2): anti-mouse CD3 PE (clone 145-2C11, eBioscience, 12-0031-82), anti-mouse EpCAM PerCP-Cy5.5 (clone G8.8, BioLegend, 118219), and anti-mouse CD45 Pacific Blue (clone 30-F11, BioLegend, 103125). Cells were washed twice and data were acquired immediately without fixation of cells using a BD LSR-II flow cytometer with FACS Diva software. All compensation and FMO controls were performed on splenocytes except for epithelial cells and CD300lf FMO controls in which case Peyer’s patch cells were used; and FMO controls were used to set gates (Supplementary Fig. 8b). Data were analyzed with FCS Express 4 (De Novo Software). Using panel 1, B cells (CD19+B220+) and DC and Mφ (CD11c+) were identified among CD45+ cells after doublet exclusion. The frequency of each cell type expressing CD300lf was then determined as well as the MFI. Using panel 2, T cells were defined as CD3+ within the CD45+ gate and epithelial cells were defined as EpCam+ within the CD45− gate. Again, CD300lf expression frequency and MFI of these cell types was quantified.
Data Availability
All relevant data are available from the authors and/or are included in the manuscript or supplementary information. The RNAscope probes used in this study were designed by Advanced Cell Diagnostics, Newark, CA).
Supplementary Material
Acknowledgments
We are grateful to Christian Jobin and Xiaolun Sun (University of Florida) for technical guidance in swiss rolling, Hugues Lelouard (Centre d’Immunologie de Marseille-Luminy) for insightful discussions on Peyer’s patch cell types, Jamie Shirley (University of Florida) for technical guidance in multicolor flow cytometric analysis, and David C. Machart and Lynda Schneider (University of Florida Molecular Pathology Core) for their assistance in processing histology samples. We would also like to thank Chris Fisher and Terri Edwards (University of Florida) for their assistance with microscopic analyses; and Dorina Avram, David Bloom, Scott Tibbetts and Fanxiu Zhu for providing cell lines. This work was also supported by the technical guidance provided by ACDBio in terms of optimizing RNAscope assays. This work was funded by NIH R01AI116892 and NIH R01AI081921.
Footnotes
CONTRIBUTIONS
K.R.G, A.N.R., S.Z., and S.M.K. designed the study and analyzed results. K.R.G. performed and analyzed RNAscope-based FISH assays and quantified chromogenic assays. S.Z. and A.H. performed mouse infections, harvests and plaque assays, and S.Z. performed RNAscope-based chromogenic assays. A.N.R. performed and analyzed in vitro infections and viability assays on cell lines as well as CD300lf expression on cell lines and Peyer’s patch cells. N.C. and M.M. assisted with fluorescence microscopy. N.C. and B.B.D. performed flow cytometric analyses of in vivo samples guided by the expertise of S.M.W and M.M. D.T.P. performed TCID50 assays and analyzed data. C.R. and B.G. assisted with analyzing chromogenic assays using a slide scanner. K.R.G., A.N.R., and S.M.K. prepared the manuscript. M.M. and S.Z. edited the manuscript.
REFERENCEES
- 1.Patel MM. Systematic Literature Review of Role of Noroviruses in Sporadic Gastroenteritis. Emerg Infect Dis. 2008;14:1224–1231. doi: 10.3201/eid1408.071114. [DOI] [PMC free article] [PubMed] [Google Scholar]
- 2.Payne DC, et al. Norovirus and Medically Attended Gastroenteritis in U.S. Children. N Engl J Med. 2013;368:1121–1130. doi: 10.1056/NEJMsa1206589. [DOI] [PMC free article] [PubMed] [Google Scholar]
- 3.Koo HL, Ajami N, Atmar RL, DuPont HL. Noroviruses: The Principal Cause of Foodborne Disease Worldwide. Discov Med. 2010;10:61–70. [PMC free article] [PubMed] [Google Scholar]
- 4.Ahmed SM, et al. Global prevalence of norovirus in cases of gastroenteritis: a systematic review and meta-analysis. Lancet Infect Dis. 2014;14:725–730. doi: 10.1016/S1473-3099(14)70767-4. [DOI] [PMC free article] [PubMed] [Google Scholar]
- 5.Jones MK, et al. Enteric Bacteria Promote Human and Murine Norovirus Infection of B cells. Science. 2014;346:755–759. doi: 10.1126/science.1257147. [DOI] [PMC free article] [PubMed] [Google Scholar]
- 6.Wobus CE, et al. Replication of Norovirus in Cell Culture Reveals a Tropism for Dendritic Cells and Macrophages. PLoS Biol. 2004;2:e432. doi: 10.1371/journal.pbio.0020432. [DOI] [PMC free article] [PubMed] [Google Scholar]
- 7.Ettayebi K, et al. Replication of human noroviruses in stem cell–derived human enteroids. Science. 2016:aaf5211. doi: 10.1126/science.aaf5211. [DOI] [PMC free article] [PubMed] [Google Scholar]
- 8.Mumphrey SM, et al. Murine Norovirus 1 Infection Is Associated with Histopathological Changes in Immunocompetent Hosts, but Clinical Disease Is Prevented by STAT1-Dependent Interferon Responses. J Virol. 2007;81:3251–3263. doi: 10.1128/JVI.02096-06. [DOI] [PMC free article] [PubMed] [Google Scholar]
- 9.Bok K, et al. Chimpanzees as an animal model for human norovirus infection and vaccine development. Proc Natl Acad Sci. 2011;108:325–330. doi: 10.1073/pnas.1014577107. [DOI] [PMC free article] [PubMed] [Google Scholar]
- 10.Taube S, et al. A Mouse Model for Human Norovirus. mBio. 2013;4:e00450–13. doi: 10.1128/mBio.00450-13. [DOI] [PMC free article] [PubMed] [Google Scholar]
- 11.Ward JM, et al. Pathology of Immunodeficient Mice With Naturally Occurring Murine Norovirus Infection. Toxicol Pathol. 2006;34:708–715. doi: 10.1080/01926230600918876. [DOI] [PubMed] [Google Scholar]
- 12.Lay MK, et al. Norwalk virus does not replicate in human macrophages or dendritic cells derived from the peripheral blood of susceptible humans. Virology. 2010;406:1–11. doi: 10.1016/j.virol.2010.07.001. [DOI] [PMC free article] [PubMed] [Google Scholar]
- 13.Cheetham S, et al. Pathogenesis of a Genogroup II Human Norovirus in Gnotobiotic Pigs. J Virol. 2006;80:10372–10381. doi: 10.1128/JVI.00809-06. [DOI] [PMC free article] [PubMed] [Google Scholar]
- 14.Karandikar UC, et al. Detection of human norovirus in intestinal biopsies from immunocompromised transplant patients. J Gen Virol. 2016;97:2291–2300. doi: 10.1099/jgv.0.000545. [DOI] [PMC free article] [PubMed] [Google Scholar]
- 15.Souza M, Azevedo MSP, Jung K, Cheetham S, Saif LJ. Pathogenesis and Immune Responses in Gnotobiotic Calves after Infection with the Genogroup II.4-HS66 Strain of Human Norovirus. J Virol. 2008;82:1777–1786. doi: 10.1128/JVI.01347-07. [DOI] [PMC free article] [PubMed] [Google Scholar]
- 16.Otto PH, et al. Infection of Calves with Bovine Norovirus GIII.1 Strain Jena Virus: an Experimental Model To Study the Pathogenesis of Norovirus Infection. J Virol. 2011;85:12013–12021. doi: 10.1128/JVI.05342-11. [DOI] [PMC free article] [PubMed] [Google Scholar]
- 17.Atmar RL, et al. Norwalk virus shedding after experimental human infection. Emerg Infect Dis. 2008;14:1553–1557. doi: 10.3201/eid1410.080117. [DOI] [PMC free article] [PubMed] [Google Scholar]
- 18.Kirby AE, Shi J, Montes J, Lichtenstein M, Moe Cl. Disease course and viral shedding in experimental Norwalk virus and Snow Mountain virus infection. J Med Virol. 2014 doi: 10.1002/jmv.23905. [DOI] [PubMed] [Google Scholar]
- 19.Teunis PFM, et al. Shedding of norovirus in symptomatic and asymptomatic infections. Epidemiol Infect. 2014:1–8. doi: 10.1017/S095026881400274X. FirstView. [DOI] [PMC free article] [PubMed] [Google Scholar]
- 20.Thackray LB, et al. Murine Noroviruses Comprising a Single Genogroup Exhibit Biological Diversity despite Limited Sequence Divergence. J Virol. 2007;81:10460–10473. doi: 10.1128/JVI.00783-07. [DOI] [PMC free article] [PubMed] [Google Scholar]
- 21.Karst SM, Wobus CE. Viruses in Rodent Colonies: Lessons Learned from Murine Norovirus. Annu Rev Virol. 2015;2:525–48. doi: 10.1146/annurev-virology-100114-055204. [DOI] [PMC free article] [PubMed] [Google Scholar]
- 22.Liu G, Kahan SM, Jia Y, Karst SM. Primary High-Dose Murine Norovirus 1 Infection Fails To Protect from Secondary Challenge with Homologous Virus. J Virol. 2009;83:6963–6968. doi: 10.1128/JVI.00284-09. [DOI] [PMC free article] [PubMed] [Google Scholar]
- 23.Bonnardel J, et al. Innate and Adaptive Immune Functions of Peyer’s Patch Monocyte-Derived Cells. Cell Rep. 2015;11:770–784. doi: 10.1016/j.celrep.2015.03.067. [DOI] [PubMed] [Google Scholar]
- 24.Gonzalez-Hernandez MB, et al. Murine Norovirus Transcytosis across an In Vitro Polarized Murine Intestinal Epithelial Monolayer Is Mediated by M-Like Cells. J Virol. 2013;87:12685–12693. doi: 10.1128/JVI.02378-13. [DOI] [PMC free article] [PubMed] [Google Scholar]
- 25.Gonzalez-Hernandez MB, et al. Efficient norovirus and reovirus replication in the mouse intestine requires microfold (M) cells. J Virol. 2014 doi: 10.1128/JVI.00204-14. JVI.00204-14. [DOI] [PMC free article] [PubMed] [Google Scholar]
- 26.Orchard RC, et al. Discovery of a proteinaceous cellular receptor for a norovirus. Science. 2016;353:933–936. doi: 10.1126/science.aaf1220. [DOI] [PMC free article] [PubMed] [Google Scholar]
- 27.Haga K, et al. Functional receptor molecules CD300lf and CD300ld within the CD300 family enable murine noroviruses to infect cells. Proc Natl Acad Sci. 2016;113:E6248–E6255. doi: 10.1073/pnas.1605575113. [DOI] [PMC free article] [PubMed] [Google Scholar]
- 28.Miller H. Intestinal M cells: The fallible sentinels? World J Gastroenterol. 2007;13:1477. doi: 10.3748/wjg.v13.i10.1477. [DOI] [PMC free article] [PubMed] [Google Scholar]
- 29.Taube S, Jiang M, Wobus CE. Glycosphingolipids as receptors for non-enveloped viruses. Viruses. 2010;2:1011–1049. doi: 10.3390/v2041011. [DOI] [PMC free article] [PubMed] [Google Scholar]
- 30.Zhu S, et al. Identification of immune and viral correlates of norovirus protective immunity through comparative study of intra-cluster norovirus strains. PLoS Pathog. 2013;9:e1003592. doi: 10.1371/journal.ppat.1003592. [DOI] [PMC free article] [PubMed] [Google Scholar]
- 31.Kahan SM, et al. Comparative murine norovirus studies reveal a lack of correlation between intestinal virus titers and enteric pathology. Virology. 2011;421:202–210. doi: 10.1016/j.virol.2011.09.030. [DOI] [PMC free article] [PubMed] [Google Scholar]
- 32.Hyde JL, et al. Mouse Norovirus Replication Is Associated with Virus-Induced Vesicle Clusters Originating from Membranes Derived from the Secretory Pathway. J Virol. 2009;83:9709–9719. doi: 10.1128/JVI.00600-09. [DOI] [PMC free article] [PubMed] [Google Scholar]
Associated Data
This section collects any data citations, data availability statements, or supplementary materials included in this article.
Supplementary Materials
Data Availability Statement
All relevant data are available from the authors and/or are included in the manuscript or supplementary information. The RNAscope probes used in this study were designed by Advanced Cell Diagnostics, Newark, CA).