Abstract
Background
Resting wakefulness is not a unitary state, with evidence accumulating that spontaneous reorganization of brain activity can be assayed through functional magnetic resonance imaging (fMRI). The dynamics of correlated fMRI signals among functionally-related brain regions, termed dynamic functional connectivity (dFC), may represent nonstationarity arising from underlying neural processes. However, given the dimensionality and noise inherent in such recordings, seeming fluctuations in dFC could be due to sampling variability or artifacts.
New method
Here, we highlight key methodological considerations when evaluating dFC in resting-state fMRI data.
Comparison with Existing Method
In particular, we demonstrate how dimensionality reduction of fMRI data, a common practice often involving principal component analysis, may give rise to spurious dFC phenomenology due to its effect of decorrelating the underlying time-series.
Conclusion
We formalize a dFC assessment that avoids dimensionality reduction and use it to show the existence of at least two FC states in the resting-state.
Keywords: Resting-state functional magnetic resonance, dynamic functional connectivity (dFC), FC state analysis, spatiotemporal analysis
1. Introduction
Resting-state functional magnetic resonance imaging (fMRI) is a non-invasive tool to evaluate the large-scale organization of the brain when a subject is not performing an explicit task [1, 2]. Functional connectivity (FC) is a measure of association (usually, the correlation) between blood-oxygen-level dependent (BOLD) signals of distinct brain regions. Such analysis has revealed a number of resting-state networks (RSN) [3], each consisting of regions grouped by putative functional relevance as they recapitulate activation patterns of task-based paradigms.
Changes in resting-state FC have been reported at time scales of seconds to minutes [4, 5]. Thus, a sliding time window analysis has been increasingly used in the literature in order to study temporal fluctuations in FC, termed dynamic functional connectivity (dFC) [6, 7, 8, 9, 10, 11]. Within this framework, the obtained FC patterns are interpreted as a set of discrete states, called “FC states,” each representing a different configuration of RSNs during resting wakefulness [12, 13, 14, 15, 16, 17, 18, 19]. From this point of view, wakefulness is characterized by the sequential, but potentially stochastic, traversal of FC states [20].
However, the nature of fMRI recordings has complicated the development of dFC methodologies. For example, scanner drift, head motion, and physiological noise [21, 22], may lead to the appearance of signal nonstationarity [23, 24]. Moreover, it is unclear whether the temporal precision of the BOLD signal would be adequate to represent FC states in the brain. However, despite these potential confounds, it is argued that proper parameter choice (e.g., sliding window length) can enable detection of legitimate neurophysiological dFC temporal fluctuations [25, 26, 27].
Another potential issue regarding dFC methods is a statistical confound due to sampling variability [28]. In this scenario, data that are mathematically stationary and originate from a single FC state may give rise to multiple discrete FC states due to inconsistent sampling. Here, we examine this potential confound with specific regard for dimensionality reduction of the BOLD time-series. This processing step is often performed via principal components analysis (PCA) to reduce computational burden or to remove spurious artifact and noise [29, 30, 31, 32]. PCA linearly transforms the original fMRI data into a basis of mutually uncorrelated components [33]. Here, we consider temporal PCA, as utilized in [28], which reduces the spatial dimensionality in the transformed domain by retaining the components with high variability [34]. In other words, after applying temporal PCA to the BOLD signal, we obtain a signal in the transformed domain with the same number of time points and reduced number of regions in the spatial dimension. We will proceed to show that applying PCA in this way prior to FC state analysis can lead to interpretations that do not fully account for the structure of the data.
Specifically, our contributions are: (i) We illustrate that dimensionality reduction of the analyzed signals, due to its decorrelating action, may lead to inadequate assessment of dFC by promoting the separation of windows into clusters of differing statistics; (ii) We show that in the absence of dimensionality reduction, the composition (i.e. correlation matrix) and occupancy (i.e., percent of the time) of a FC state must be considered when testing for the validity of FC states; (iii) We show that incorporating these considerations allows for the extraction of at least two interpretable FC states during resting wakefulness.
2. Materials and Methods
2.1. Participants
This is a secondary analysis performed following an initial investigation on the average changes in functional connectivity following the transition between wakefulness and anesthetized states [35]. All aspects of this study were conducted under a protocol approved by the Washington University Human Research Protection Office. All the participants were between 18 to 40 years of age. The following exclusion criteria were considered in this study: use of over-the-counter antihistamines, antiemetics, herbal supplements, ethanol, or illicit drugs within a week of the study; disturbance in normal sleep pattern within the past 14 days; sedation, general anesthesia, or upper respiratory infection in the past 30 days; known auditory or physical impairments; known family history of malignant hyperthermia; implanted magnetic resonance imaging (MRI)-incompatible metal or prosthetic.
2.2. Experimental BOLD Data Acquisition and Pre-processing
We report analyses of fMRI data acquired from 10 human volunteers (Siemens 3T Trio, TR 2.2s, TE 27ms, flip angle = 90 degrees, 36 slices, 200 volumes/run). Two echo-planar BOLD imaging runs were acquired from each volunteer during quiet eyes-closed passivity (resting-state), prior to induction of general anesthesia. Pre-processing of data was performed as previously described [35]. Epochs contaminated by artifact related to micromovements of the head were censored. Regression of the whole brain global signal was also carried out. It should be noted that although global signal regression remains a controversial technique, it has been shown that it decreases the spurious changes in correlated BOLD signals that are introduced by head motion [36, 37, 38].
2.3. Cortical Segmentation into Resting-State Networks
In this study, 6 × 6 × 6 mm regions were used to segment cortical gray matter. 1076 regions were selected using a winner-take-all algorithm with at least 50% gray matter and more than 90% probability of exclusive assignment to one of the seven RSNs. A previously published parcellation method [39] was used to assign brain regions to each RSN. A brief summary of this method is as follows: a multi-layer perceptron was trained to associate BOLD correlation maps corresponding to predefined seeds with specific RSN identities. In this study, we considered seven RSNs including the Default Mode Network (DMN), Dorsal Attention Network (DAN), Ventral Attention Network (VAN), Frontal Parietal Control Network (FPC), Visual Network(VIS), Language Network (LAN), and Somatomotor Network (SMN). DMN constitutes brain areas that show higher activity at rest than while performing a task [40, 41]. Maintaining attention to locations or features are thought to be associated with DAN [42, 43]. VAN is considered to be involved in detecting novel stimuli and initiating shifts of attention [44, 45, 46]. FPC is hypothesized to be associated with working memory. Also, the FPC is thought to be responsible for configuring the brain’s moment-to-moment information processing [47]. Visual and language processing are associated with VIS and LAN, respectively [48, 49, 50]. SMN is thought to be responsible for motor and sensory processing [45, 46, 51]. We then selected 15 representatives of each RSN by repeated pseudo-random re-sampling of regions from different RSNs. These sub-sampled data (105 voxels) have been made zero-mean and then used in our FC state analysis. In all of the figures presented in this paper, the assignment of 105 voxels to seven RSNs are as follows: DAN: 1–15; VAN: 16–30; SMN: 31–45; VIS: 46–60; FPC: 61–75; LAN: 76–90; DMN: 91–105.
2.4. Functional connectivity processing
In all analyses presented in this paper, the BOLD signals were band-pass filtered between 0.008 and 0.1 Hz using a 10th order Butterworth filter [52]. All the data analyses were performed using MATLAB (The MathWorks, Inc., MA, USA) scripts generated for this study.
2.5. Dynamic functional connectivity
In order to characterize the temporal dynamics of functional connectivity, we used a sliding window analysis of the BOLD signal [20, 21]. Computing correlations on shorter sub-trial windows (i.e., binning) can provide more temporal information at the expense of increased noise susceptibility [6]. We estimated the sliding window functional connectivity matrix for each time window. In this study, we used 50 samples (110 seconds) as the sliding window lengths to find FC states. For all the analyses, overlapping was performed with a separation of 5 samples (11 seconds) between consecutive sliding window centers.
2.6. FC state analysis of resting wakefulness
To evaluate FC states across subjects, we applied the k-means clustering technique to the correlation matrices obtained from all ten subjects. Thus, 737 sliding windows (with 110 seconds for the length of each window) from all subjects were used in the clustering. Correlation values between all region-pairs were included, resulting in (105 × 104)/2 = 5460 features per matrix. The clustering algorithm was performed with random initialization of centroid points and was repeated 100 times to increase chances of escaping local minima. As the simplest scenario to assess altered FC states dynamics during resting wakefulness, we selected the number of clusters k = 2 in the k-means algorithm.
2.7. Simulated BOLD Data
We generated different cases of synthetic BOLD signals, described below, to generate positive and negative controls for the presence of FC states in the signals. To control for the spectral content, we matched the power spectrum of the synthetic data to that of the experimental BOLD signal.
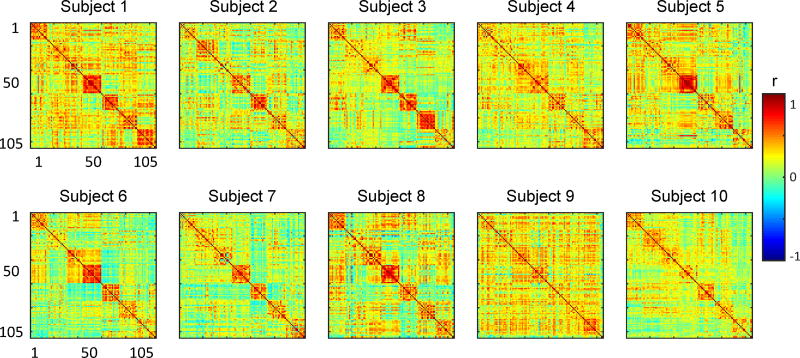
Simulated Stationary BOLD with corrected power spectrum. We generated stationary simulated BOLD fMRI time-series following [28]. Specifically, first we generated random samples from a normal distribution. We used the same number of time points and voxels as in the experimental BOLD data for each subject. Then, we filtered these time-series utilizing the average power spectrum calculated from the experimental BOLD data. Then, we matched the simulated time-series covariance matrix to the one from the experimental data (by projecting the simulated time-series data onto the eigenvectors of the covariance matrix from the experimental data calculated over the entire scan time). By doing so, we generate a stationary synthesized time-series for all subjects in the dataset that has a static FC (time-averaged FC) and frequency content similar to the static FC and the average power spectrum of the actual BOLD signal, respectively. The static FC of each subject, calculated over the entire scan time, is provided in the Appendix (Figure 6).
Simulated Non-stationary BOLD with corrected power spectrum. A non-stationary simulated BOLD fMRI time-series is generated based on the FC state analysis results on the experimental BOLD signal. For each subject, we consider two FC states with the assumption that the subject is transitioning between these two FC states over time during resting wakefulness (see the Appendix for more details). In this case, we extracted the FC states (and corresponding FC state assignment) for each window using the method described in section 2.6 for each individual subject. Then for each window, we generated a stationary time-series which match the covariance of the assigned FC state. Again we forced the power spectrum of the simulated BOLD to be similar to the average power spectrum of the actual BOLD signal. This is our positive control for the presence of FC states.
Simulated Stationary BOLD with uncorrected power spectrum. We generated stationary simulated BOLD fMRI time-series for each subject as in Case I, but we did not modify the power spectrum of the simulated signal.
Figure 6.
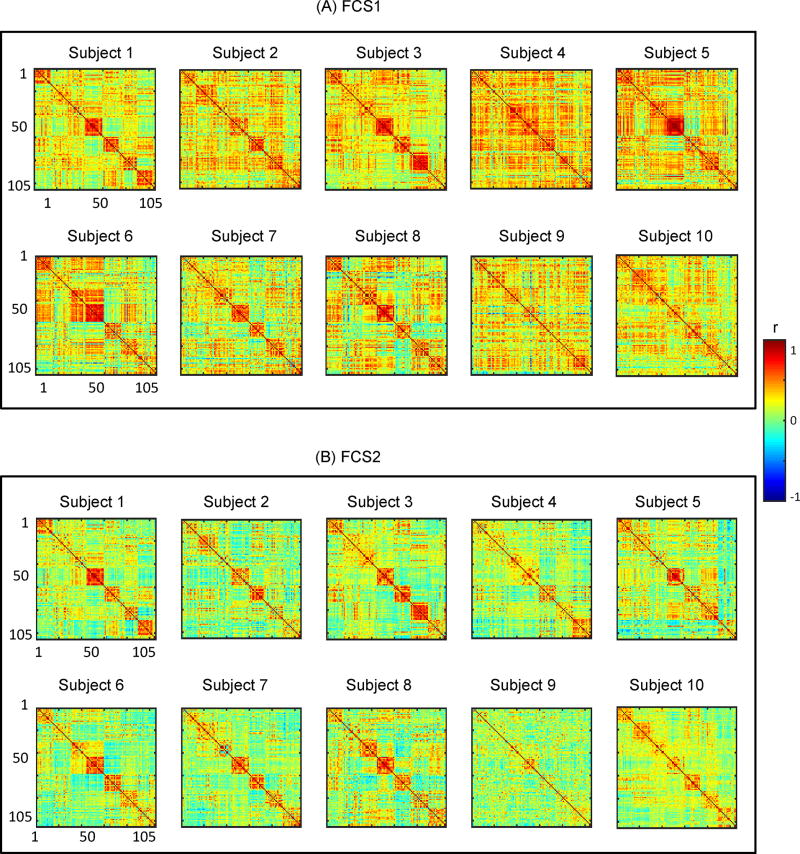
Static FC of each subjects, calculated over the entire scan time, for all individuals in our dataset.
2.8. FC state occupancy, entropy and similarity
For a particular individual, we define the occupancy of a FC state as the ratio of windows assigned to that FC state relative to the total number of sliding windows. We denote the occupancy of subject i being at FC state j, j = 1, 2 as , which is bounded between 0 and 1. The entropy of occupancy for subject i is defined as . A zero entropy means that there are no transitions between FC states while a unit value for entropy means that the subject is revisiting all FC states with equal probability. We calculated the correlation between FC states for each case of simulated BOLD separately to compare FC states obtained from the experimental BOLD signals to FC states obtained from different simulated BOLD time-series. To quantify the relation between FC states similarity and entropy of occupancy in simulated BOLD cases I–II, we conducted a regression analysis to quantify the beta value (β), the R2and a p-value (P).
2.9. Statistical Analysis
We compare FC states obtained from the experimental BOLD signals to FC states obtained from each different simulated fMRI time-series.
Differences in occupancy of being at a particular FC state across different BOLD time-series, were assessed using a two-sample Kolmogorov–Smirnov test (K–S test). The two-sample K-S test is a nonparametric test for cases where the sample distributions are unknown which returns a test decision for the null hypothesis that two samples are from the same continuous distribution. Self-similarity of FC states across different BOLD time-series data, real and simulated, were tested using t-test on the z-values of FC states.
3. Results
3.1. Simulated and experimental BOLD signal can give rise to similar FC states
We first compare dFC state analysis on the experimental BOLD signal and the synthesized data from the different controls. For each of the positive and negative controls, we perform analysis with and without the application of PCA to the initial time-series data. When PCA is utilized, the original time-series data are dimensionality reduced from 105 to 30 dimensions prior to clustering, as in [28]. In our data, the percentage of variance that was retained after PCA reduction was 92.2% on average. We consider k = 2 for the k-means analysis.
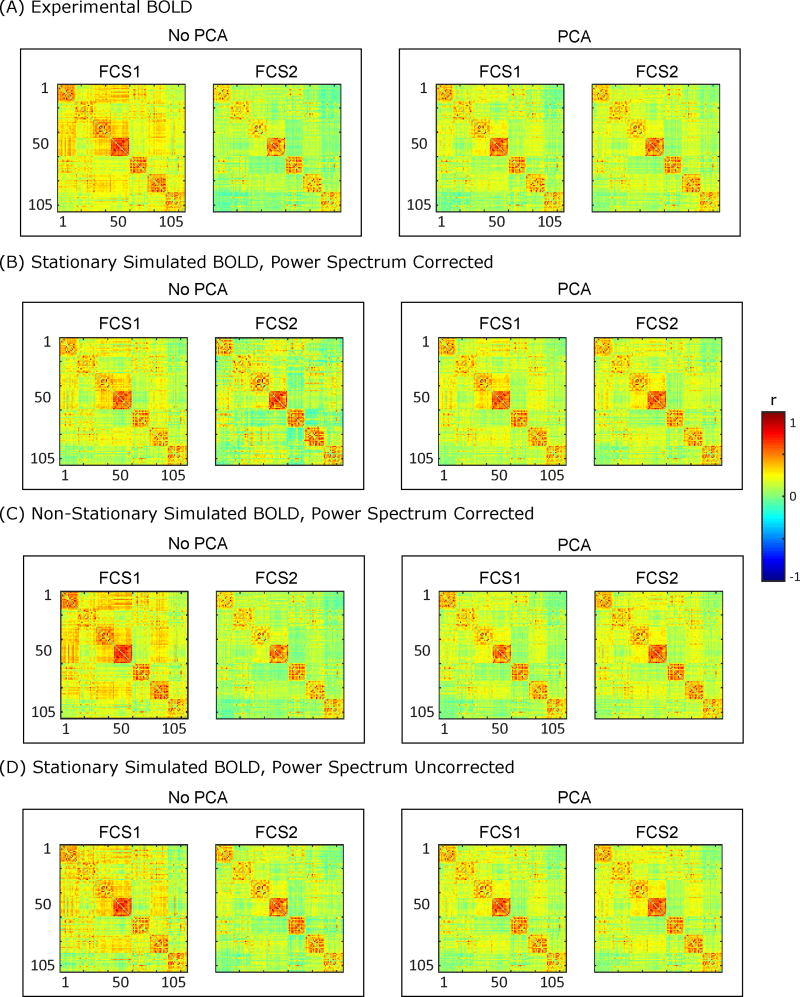
Figure 1 illustrates the correlation matrices corresponding to the two FC states, FC state 1 (FCS1) and FC state 2 (FCS2), obtained for the simulated and experimental BOLD data. It can be concluded from this plot that the FC states from all controls are indeed similar to the ones obtained from the experimental BOLD signals. The pairwise similarity of FC states from the experimental BOLD signals to the simulated BOLD data from case I, case II and case III (with 100 realizations per case) was 0.89±0.04, 0.97±0.01, and 0.90±0.02 (mean±SD), respectively. Thus, control cases can indeed generate FC states that appear similar to those obtained from the actual data. However, the difference between FC states is obscured following the use of PCA, which tends to homogenize the extracted FC states (Figure 2B). This plot suggests that FC states are less similar without PCA, while with the application of PCA, FC states manifest greater similarity.
Figure 1.
Two FC states (FCS1 and FCS2) obtained with and without PCA for (A) experimental BOLD signal, (B) stationary simulated BOLD with corrected power spectrum, (C) Non-stationary simulated BOLD with corrected power spectrum, and (D) stationary simulated BOLD with uncorrected power spectrum. For all the simulated cases, the covariance matrix and power spectrum of each subject are used to generate the simulated BOLD time-series for that particular subject. The presence or absence of FC states is not definitive in this type of visualization, particularly with the use of PCA.
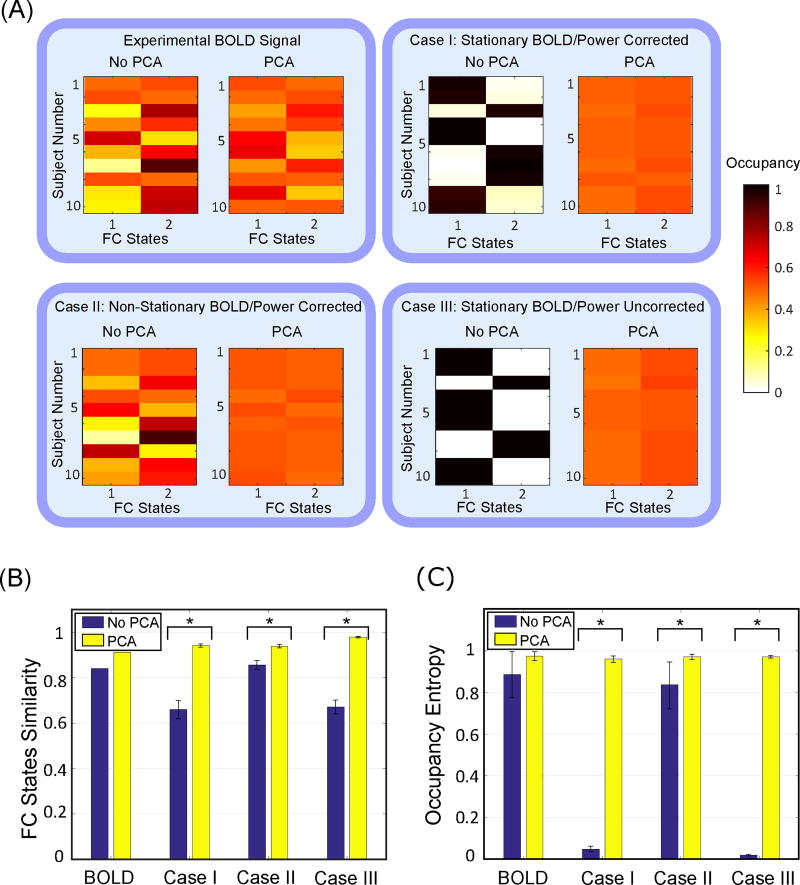
Figure 2.
(A) FC state occupancy across different subject for the experimental BOLD signal, cases I (stationary simulated BOLD, power spectrum corrected), case II (non-stationary simulated BOLD, power spectrum corrected), and case III (stationary simulated BOLD, power spectrum uncorrected) with and without applying PCA to original time-series data. (B) FC state similarity (correlation between two FC states) and (C) FC state entropy for the experimental BOLD, cases I-III with and without applying PCA to original time-series data. Error bars stand for standard deviation (SD).
3.2. FC state occupancy can differentiate simulated and experimental signals and is obscured by PCA
While the above is suggestive of a potential confound (i.e., stationary data giving rise to apparent FC states), to fully study the validity of FC states we must consider occupancy in addition to the FC state similarity. The FC state occupancy (i.e., the fraction of windows assigned to that FC state) across different subjects for the experimental BOLD signal, and control cases I–III are shown in Figure 2A.
It can be concluded from this plot that occupancy of either of the FC states in the experimental BOLD signal is entropic, and each subject exhibits transitions between these two FC states during the recording. The same entropic behavior is observed in the non-stationary synthesized time-series (i.e., case II), as expected. However, for both case I and case III, the FC state occupancy obtained without using PCA shows mostly one FC state for each subject, which means that simulated subject does not exhibit any transitions between the two FC states. Statistical analysis confirmed that the occupancy of the first FC state is significantly different between the experimental BOLD signal and simulated stationary BOLD data regardless of whether the power spectral properties have been simulated in case I (K-S test, P = 0.031, stat = 0.6) or not as in case III (K-S test, P = 0.007, stat = 0.7). Moreover, the experimental BOLD signal is not significantly different from case II (K-S test, P = 0.975, stat = 0.2), where we simulate nonstationary BOLD data with power spectrum approximating that of the experimental signals.
However, application of PCA to the time-series data prior to FC state extraction changes the occupancy, especially for the stationary simulated signals (case I, III). We further quantified the FC state similarity (correlation between two FC states) and FC state entropy for cases with and without PCA, shown in Figure 2B,C. We tested the difference between FC states similarity with and without PCA by utilizing t-tests on z-values of correlations (applying Fisher inverse transform to correlation values) over subjects. The statistical results show significant difference with and without PCA for all the cases I–III with P ≪ 0.001. We further analyzed the differences in the occupancy entropy over subjects, with and without applying PCA to the original time-series data. The results of such statistical analyses are as follows: (K-S test for the experimental BOLD, P = 0.111, stat = 0.5), (K-S test for case I, P ≪ 0.001, stat = 1), (K-S test for case II, P ≪ 0.001, stat = 1), (K-S test for case III, P = 0.001, stat = 0.8). The results of statistical tests on the occupancy, of being at a particular FC state, are reported in the Appendix. This analysis confirms that application of PCA does indeed homogenize FC states both in terms of their FC state similarities and in terms of their occurrences in time.
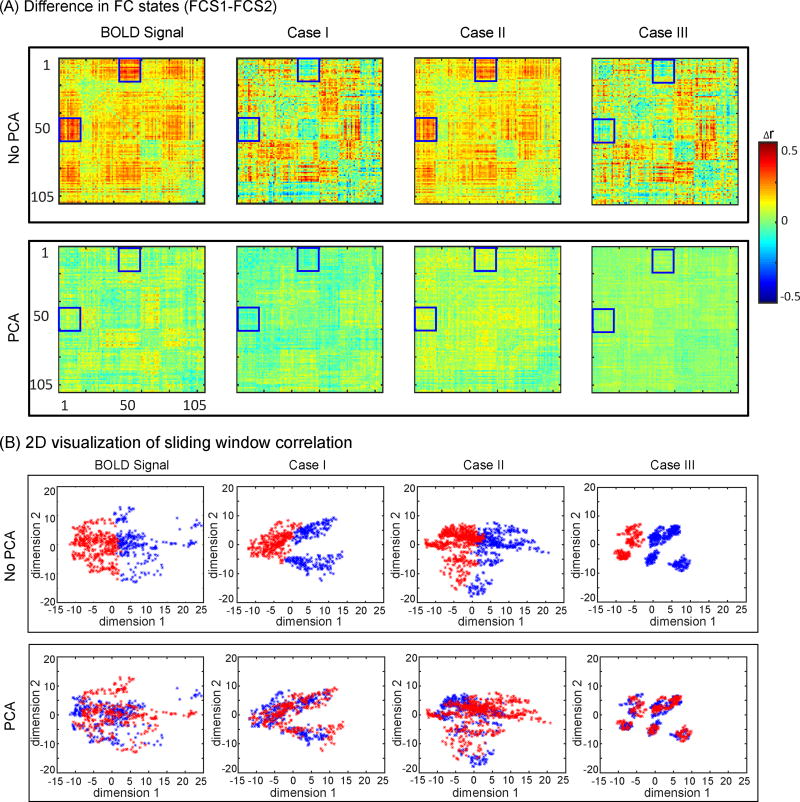
Figure 3A depicts the difference between two FC states, separately obtained with and without applying PCA to time-series data from the experimental BOLD signal and simulated BOLD in cases I–III. In Figure 3B, the FC state identity of each sliding window is projected onto the first two principal components. This figure clearly shows how applying PCA can fundamentally alter the distribution of time epochs to different FC states.
Figure 3.
(A) Difference between two FC states, separately, obtained from the experimental BOLD signal and simulated BOLD in cases I (stationary simulated BOLD, power spectrum corrected), case II (non-stationary simulated BOLD, power spectrum corrected), and case III (stationary simulated BOLD, power spectrum uncorrected). Top panel shows FC states difference without PCA, while bottom panel represents FC states difference with PCA application. Blue squares represent interaction between VIS and DAN networks. (B) Sliding window correlations projected onto the first two principal components colored by FC state identity. Top panel shows sliding window correlations without PCA, while bottom panel represents FC states sliding window correlations with PCA application to original time-series data.
3.3. Accounting for occupancy reveals RSN-specific differences in FC states
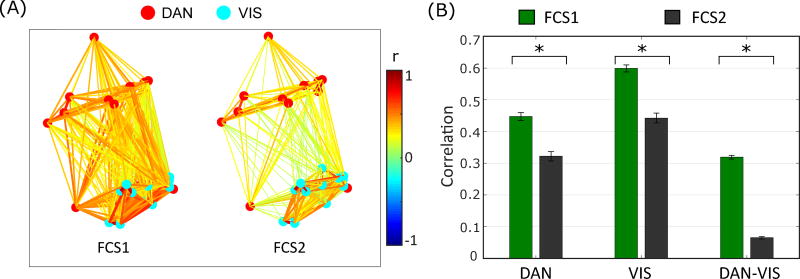
The above methodological considerations indicate that when occupancy is fully taken into account, the experimental BOLD signal does indeed appear to exhibit transitioning between FC states. To evaluate the salience of these FC states from a physiological perspective, we performed a brief analysis to identify the key differences in the FCS1 and FCS2. We found that the most prevalent difference between these FC states manifests in the correlation between the DAN and VIS RSNs (Figure 4A). Specifically, we note that strong correlation between VIS and DAN in the first FC state is absent in the second one.
Figure 4.
Connectivity patterns of the two FC states for DAN and VIS networks. All connections with correlation value less than 0.1 are set to zero. (B) Mean correlation connectivity within DAN, within VIS, and between DAN and VIS, for FC states 1 and 2. Error bars represent standard error of the mean.
This connectivity difference between the first and second FC states for all the connections (30 × 29/2 = 435 connections) are shown in Figure 4A for region-pairs within DAN and VIS networks, and was significant by paired t-test (p ≪ 0.001) after correction for multiple comparisons (30 × 29/2 = 435 connections). Figure 4B shows the comparison of connections within DAN, connections within VIS, and connections between DAN and VIS. A two-way ANOVA (on z-values of correlations) with FC states (first or second FC state) and network (within DAN, within VIS, and between DAN and VIS) as factors shows a significant main effect of FC state (F1,864 = 482.62, P ≪ 0.001), a significant main effect of network (F2,864 = 659.38, P ≪ 0.001), and a significant network by FC state interaction (F2,864 = 28.54, P ≪ 0.001).
3.4. Decorrelating actions of PCA lead to spurious FC state dynamics
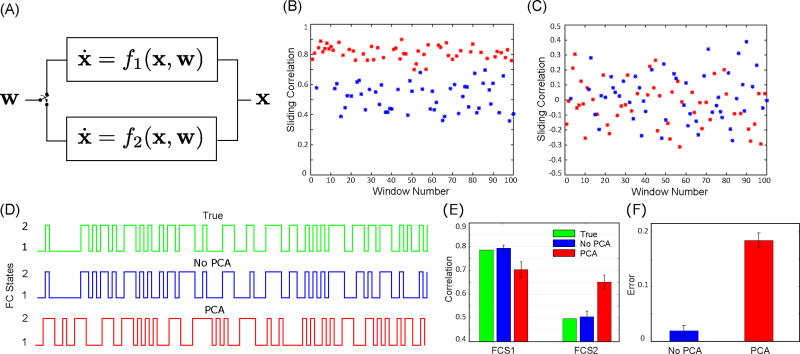
The above analyses reveal a clearly problematic methodological step in FC state analysis, i.e., the application of dimensionality reduction prior to state extraction. The observed effects can potentially be understood in terms of the decorrelating actions of PCA. To substantiate this notion, we also performed analysis on a toy example consisting of non-stationary data randomly generated from two different noise-driven linear dynamical systems f1 and f2 (red and blue colors) (see the Appendix for the exact specification of f1 and f2). A random switch determines which dynamical system is sampled at each window. Sliding correlation analyses of the synthesized data without and with PCA are shown in Figure 5B and 5C, respectively. The correlation in 5C fluctuates about a mean of zero, as expected due to the effect of PCA. We then applied the FC state analysis and observed substantial errors in finding the true FC states after employing PCA (Figure 5D). Figure 5E shows the pairwise correlation for both FC states with and without PCA. The estimated correlation error is highlighted in Figure 5F. The exact covariance and correlation matrices, alongside the estimated ones, with and without PCA are reported in the Appendix.
Figure 5.
(A) A two dimensional non-stationary data, x, randomly generated using two different dynamical systems f1 and f2 (red and blue colors) over time. A switch operating randomly determines which dynamical system processes the input white noise, w, at each time instant. Sliding correlation analysis of the synthesized data (B) before and (C) after applying PCA. (D) (Green) True FC state of the synthesized data chosen by the switch operating randomly. (Blue) Estimated FC states with application of PCA to the synthesized data. (Red) Estimated FC states with application of PCA to the synthesized data. (E) Results of FC state analysis for estimating correlation between two time-series in both FC states with and without PCA over 100 realization of random synthesized data. (F) Estimated correlation error with and without applying PCA to time-series data for both FC states. Error bars stand for standard deviation (SD).
4. Discussion
We evaluated the presence of FC states in the experimental BOLD signal acquired during eyes closed wakefulness and whether conventional cluster-based extraction methods could be susceptible to obscuring their assessment. We showed that dimensionality reduction (PCA) may be a problematic analysis step insofar as it could change the FC state similarity and occupancy of the extracted FC states. Taking this into account, we showed that FC states can, in fact, be reliably deduced in different positive controls of non-stationary simulated BOLD data and a toy example. Further, FC states extracted from experimental BOLD signals are interpretable from a physiological perspective.
4.1. Limitations of PCA in dFC analysis for FC state extraction
PCA is commonplace in FC analysis, given the high dimensionality of signals generated by BOLD fMRI and high-density EEG. It should be noted that similar to FC state extraction in BOLD fMRI data, EEG/MEG microstate analysis has been carried out for cases of high temporal resolution data [53, 54]. However, such a step has the effect of providing linearly uncorrelated signals throughout a recording. Thus, subsequent window-based clustering of the post-PCA data will, almost by definition, produce a highly entropic distribution of ‘FC states’ (as shown in the toy example) which means that each individual can have a high frequency of transitions between two or more FC states. Thus, projecting the original data into alternative bases, for instance by applying PCA on the BOLD fMRI time-course, must be handled with care when performing FC state analysis.
4.2. FC state occupancy is a key feature in dFC analysis
Consistent with the findings of [28], we observed that the stationary simulated BOLD time-series from control case I and case III resulted in similar FC states as the ones obtained from the experimental BOLD signal. This similarity may be due to the fact that in these negative controls, the average covariance of each subject is used to synthesize the stationary data. However, when we excluded PCA from the analysis stream, the stationary nature of the simulated data was immediately revealed, since each (simulated) subject tended to classify exclusively into one FC state. That is, all sliding covariance matrices from a simulated subject tend to be classified into the FC state closest to the average covariance of the (actual) subject in question. In contrast, the FC state occupancy for each individual subject is entropic for the experimental BOLD signal and positive control case II, with nonstationary simulated BOLD signals.
4.3. Dynamic reorganization of RSN interactions during resting wakefulness
With all methodological considerations taken into account, our analyses suggest the transition among at least two FC states in resting wakefulness marked by differences in DAN-VIS interactions. Specifically, connections between DAN and VIS networks in individuals during resting-state transition between modes of high and low dFC. These fluctuations are compatible with several prior characterizations of FC, including eye movement associated with waxing and waning outward attention [55, 56], or the modulation of VIS by DAN [57, 58] potentially due to subjects transitioning between wakefulness and light sleep. While further exploration is warranted to fully characterize these relationships, they are indicative of the potential prevalence of dynamic fluctuations in functional connectivity, thus highlighting the importance of such analytical methods in future studies.
5. Appendix
5.1. Toy example
In the toy example of Figure 5, the input white noise first passed through an infinite impulse response (IIR) filter with z-transform in the form of . The coefficients of the IIR filter for f1 are as follows:
This filter acts as a lowpass filter with cutoff frequency of 0.15Hz. The coefficients of the IIR filter for f2 are as follows:
This filter acts as a bandpass filter in the range of [0.05, 0.15]Hz. The filtered data are then constrained to have a prespecified covariance matrix. Different covariance matrices were used for systems f1 and f2 which are as follows:
5.2. Statistical analysis of occupancy
The results of the statistical test on occupancy of a particular FC state (without loss of generality FC state 1) with and without applying PCA on the original time-series data for different cases are as follows: (K-S test for the experimental BOLD case, P = 0.111, stat = 0.5), (K-S test for the case I, P = 0.031, stat=0.6), (K-S test for the case II, P = 0.007, stat=0.7), (K-S test for the case III, P = 0.031, stat=0.6).
5.3. Static functional connectivity of each subjects
Figure 6 demonstrates the static FC of each subject, calculated over the entire scan time.
5.4. Non-stationary simulation of the BOLD time-series
To simulate a non-stationary BOLD time-series data, we use the results of FC state analysis on the experimental BOLD signal. After applying FC state analysis to the experimental BOLD signal, we fixed the FC state index for each sliding window for all subjects. Then for all sliding windows which are assigned to the first FC state, we calculate the average covariance matrix for all subjects individually. This analysis results in Figure 7A which shows the first FC states for different subjects. In a similar way, we can find covariance matrix associated with the second FC state for each subject (Figure 7B). We then use these covariance matrices to simulate the BOLD signal with similar FC state transitions as the experimental BOLD signal for each subject.
Figure 7.
FC states used for simulation of time-series data in case II. (A) Correlation matrices associated to the first FC state for each individual obtained from FC state analysis of the BOLD signal. (B) Correlation matrices associated to the second FC state for each individual obtained from FC state analysis of the BOLD signal.
5.5. Mean power spectrum and mean correlation matrix across all the subjects
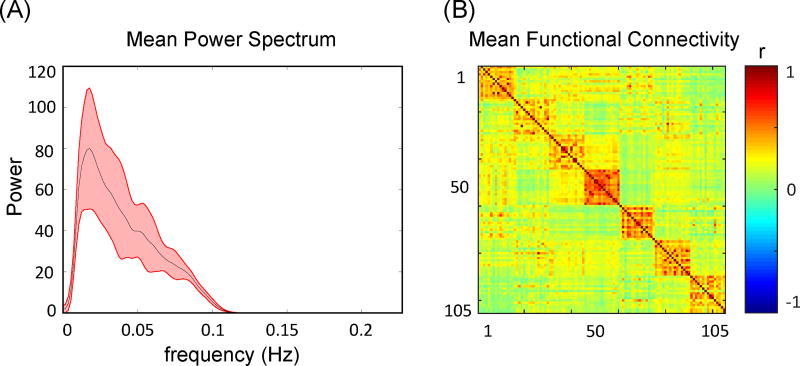
Figure 8 illustrates the mean correlation matrix and mean power spectrum of all subjects in our dataset.
Figure 8.
(A) Mean power spectrum and (B) mean static functional connectivity of all subjects in our dataset.
Highlights.
Limitations and potential confounds of dimensionality reduction in extracting dFC states from fMRI recordings are evaluated.
It is shown that the decorrelating actions of principal component analysis can lead to spurious FC state dynamics.
This limitation is characterized by analyzing the composition and occupancy of FC states in positive and negative controls.
Accounting for this limitation, two interpretable FC states are extracted during resting wakefulness.
Acknowledgments
ShiNung Ching holds a Career Award at the Scientific Interface from the Burroughs-Wellcome Fund. This work was partially supported by AFOSR 15RT0189, NSF ECCS 1509342 NSF CMMI 1537015 and grant 1R21NS096590-01A1, from the US Air Force Office of Scientific Research, the US National Science Foundation, and the National Institute of Neurological Disorders and Stroke, respectively. Ben Palanca was supported by the Foundation for Anesthesia Education and Research (FAER MRTG-CT-02/15/2010), National Institute on Aging 1R21AG052821-01, and the Washington University Institute of Clinical and Translational Sciences grant UL1 TR000448 KL2TR000450 from the National Center for Advancing Translational Sciences. The content is solely the responsibility of the authors and does not necessarily represent the official views of the NIH. We thank anonymous reviewers and the editor for their constructive comments which helped to improve the manuscript.
Footnotes
Publisher's Disclaimer: This is a PDF file of an unedited manuscript that has been accepted for publication. As a service to our customers we are providing this early version of the manuscript. The manuscript will undergo copyediting, typesetting, and review of the resulting proof before it is published in its final citable form. Please note that during the production process errors may be discovered which could affect the content, and all legal disclaimers that apply to the journal pertain.
Author contributions statement
Acquisition of data: BP. Analysis and interpretation of data: MK, SC, BP. Drafting of the manuscript: MK, SC. MK, SC, and BP revised the manuscript critically for important intellectual content. All authors reviewed the manuscript.
References
- 1.Biswal B, Zerrin Yetkin F, Haughton VM, Hyde JS. Functional connectivity in the motor cortex of resting human brain using echo-planar mri. Magnetic resonance in medicine. 1995;34:537–541. doi: 10.1002/mrm.1910340409. [DOI] [PubMed] [Google Scholar]
- 2.Rosazza C, Minati L. Resting-state brain networks: literature review and clinical applications. Neurological Sciences. 2011;32:773–785. doi: 10.1007/s10072-011-0636-y. [DOI] [PubMed] [Google Scholar]
- 3.Damoiseaux J, Rombouts S, Barkhof F, Scheltens P, Stam C, Smith SM, et al. Consistent resting-state networks across healthy subjects. Proceedings of the national academy of sciences. 2006;103:13848–13853. doi: 10.1073/pnas.0601417103. [DOI] [PMC free article] [PubMed] [Google Scholar]
- 4.Honey C, Sporns O, Cammoun L, Gigandet X, Thiran JP, Meuli R, et al. Predicting human resting-state functional connectivity from structural connectivity. Proceedings of the National Academy of Sciences. 2009;106:2035–2040. doi: 10.1073/pnas.0811168106. [DOI] [PMC free article] [PubMed] [Google Scholar]
- 5.Van Dijk KR, Hedden T, Venkataraman A, Evans KC, Lazar SW, Buckner RL. Intrinsic functional connectivity as a tool for human connectomics: theory, properties, and optimization. Journal of neurophysiology. 2010;103:297–321. doi: 10.1152/jn.00783.2009. [DOI] [PMC free article] [PubMed] [Google Scholar]
- 6.Kafashan M, Palanca BJ, Ching S. Bounded-observation kalman filtering of correlation in multivariate neural recordings; 36th Annual International Conference of the IEEE Engineering in Medicine and Biology Society (EMBC); 2014. pp. 5052–5055. [DOI] [PMC free article] [PubMed] [Google Scholar]
- 7.Sakoğlu Ü, Pearlson GD, Kiehl KA, Wang YM, Michael AM, Calhoun VD. A method for evaluating dynamic functional network connectivity and task-modulation: application to schizophrenia. Magnetic Resonance Materials in Physics, Biology and Medicine. 2010;23:351–366. doi: 10.1007/s10334-010-0197-8. [DOI] [PMC free article] [PubMed] [Google Scholar]
- 8.Calhoun VD, Miller R, Pearlson G, Adalı T. The chronnectome: time-varying connectivity networks as the next frontier in fMRI data discovery. Neuron. 2014;84:262–274. doi: 10.1016/j.neuron.2014.10.015. [DOI] [PMC free article] [PubMed] [Google Scholar]
- 9.Kang J, Wang L, Yan C, Wang J, Liang X, He Y. Characterizing dynamic functional connectivity in the resting brain using variable parameter regression and kalman filtering approaches. Neuroimage. 2011;56:1222–1234. doi: 10.1016/j.neuroimage.2011.03.033. [DOI] [PubMed] [Google Scholar]
- 10.Keilholz SD. The neural basis of time-varying resting-state functional connectivity. Brain connectivity. 2014;4:769–779. doi: 10.1089/brain.2014.0250. [DOI] [PMC free article] [PubMed] [Google Scholar]
- 11.Kafashan M, Ching S, Palanca BJ. Sevoflurane alters spatiotemporal functional connectivity motifs that link resting-state networks during wakefulness. Frontiers in Neural Circuits. 2016;10:107. doi: 10.3389/fncir.2016.00107. [DOI] [PMC free article] [PubMed] [Google Scholar]
- 12.Allen EA, Damaraju E, Plis SM, Erhardt EB, Eichele T, Calhoun VD. Tracking whole-brain connectivity dynamics in the resting state. Cerebral cortex. 2012:bhs352. doi: 10.1093/cercor/bhs352. [DOI] [PMC free article] [PubMed] [Google Scholar]
- 13.Chen JE, Chang C, Greicius MD, Glover GH. Introducing co-activation pattern metrics to quantify spontaneous brain network dynamics. NeuroImage. 2015;111:476–488. doi: 10.1016/j.neuroimage.2015.01.057. [DOI] [PMC free article] [PubMed] [Google Scholar]
- 14.Hutchison RM, Morton JB. Tracking the brain’s functional coupling dynamics over development. The Journal of Neuroscience. 2015;35:6849–6859. doi: 10.1523/JNEUROSCI.4638-14.2015. [DOI] [PMC free article] [PubMed] [Google Scholar]
- 15.Liu X, Chang C, Duyn JH. Decomposition of spontaneous brain activity into distinct fmri co-activation patterns. Frontiers in systems neuroscience. 2013;7 doi: 10.3389/fnsys.2013.00101. [DOI] [PMC free article] [PubMed] [Google Scholar]
- 16.Hutchison RM, Womelsdorf T, Gati JS, Everling S, Menon RS. Resting-state networks show dynamic functional connectivity in awake humans and anesthetized macaques. Human brain mapping. 2013;34:2154–2177. doi: 10.1002/hbm.22058. [DOI] [PMC free article] [PubMed] [Google Scholar]
- 17.Amico E, Gomez F, Di Perri C, Vanhaudenhuyse A, Lesenfants D, Boveroux P, et al. Posterior cingulate cortex-related co-activation patterns: a resting state fmri study in propofol-induced loss of consciousness. PloS one. 2014;9:e100012. doi: 10.1371/journal.pone.0100012. [DOI] [PMC free article] [PubMed] [Google Scholar]
- 18.Liang Z, Liu X, Zhang N. Dynamic resting state functional connectivity in awake and anesthetized rodents. NeuroImage. 2015;104:89–99. doi: 10.1016/j.neuroimage.2014.10.013. [DOI] [PMC free article] [PubMed] [Google Scholar]
- 19.Thompson GJ, Pan WJ, Keilholz SD. Different dynamic resting state fMRI patterns are linked to different frequencies of neural activity. Journal of neurophysiology. 2015;114:114–124. doi: 10.1152/jn.00235.2015. [DOI] [PMC free article] [PubMed] [Google Scholar]
- 20.Barttfeld P, Uhrig L, Sitt JD, Sigman M, Jarraya B, Dehaene S. Signature of consciousness in the dynamics of resting-state brain activity. Proceedings of the National Academy of Sciences. 2015;112:887–892. doi: 10.1073/pnas.1418031112. [DOI] [PMC free article] [PubMed] [Google Scholar]
- 21.Hutchison RM, Womelsdorf T, Allen EA, Bandettini PA, Calhoun VD, Corbetta M, et al. Dynamic functional connectivity: promise, issues, and interpretations. Neuroimage. 2013;80:360–378. doi: 10.1016/j.neuroimage.2013.05.079. [DOI] [PMC free article] [PubMed] [Google Scholar]
- 22.Van Dijk KR, Sabuncu MR, Buckner RL. The influence of head motion on intrinsic functional connectivity mri. Neuroimage. 2012;59:431–438. doi: 10.1016/j.neuroimage.2011.07.044. [DOI] [PMC free article] [PubMed] [Google Scholar]
- 23.Leonardi N, Van De Ville D. On spurious and real fluctuations of dynamic functional connectivity during rest. Neuroimage. 2015;104:430–436. doi: 10.1016/j.neuroimage.2014.09.007. [DOI] [PubMed] [Google Scholar]
- 24.Wilson RS, Mayhew SD, Rollings DT, Goldstone A, Przezdzik I, Arvanitis TN, et al. Influence of epoch length on measurement of dynamic functional connectivity in wakefulness and behavioural validation in sleep. NeuroImage. 2015;112:169–179. doi: 10.1016/j.neuroimage.2015.02.061. [DOI] [PubMed] [Google Scholar]
- 25.Hindriks R, Adhikari M, Murayama Y, Ganzetti M, Mantini D, Logothetis N, et al. Can sliding-window correlations reveal dynamic functional connectivity in resting-state fmri? NeuroImage. 2016;127:242–256. doi: 10.1016/j.neuroimage.2015.11.055. [DOI] [PMC free article] [PubMed] [Google Scholar]
- 26.Lindquist MA, Xu Y, Nebel MB, Caffo BS. Evaluating dynamic bivariate correlations in resting-state fmri: A comparison study and a new approach. Neuroimage. 2014;101:531–546. doi: 10.1016/j.neuroimage.2014.06.052. [DOI] [PMC free article] [PubMed] [Google Scholar]
- 27.Zalesky A, Breakspear M. Towards a statistical test for functional connectivity dynamics. Neuroimage. 2015;114:466–470. doi: 10.1016/j.neuroimage.2015.03.047. [DOI] [PubMed] [Google Scholar]
- 28.Laumann TO, Snyder AZ, Mitra A, Gordon EM, Gratton C, Adeyemo B, et al. On the stability of bold fMRI correlations. Cerebral Cortex. 2016 doi: 10.1093/cercor/bhw265. [DOI] [PMC free article] [PubMed] [Google Scholar]
- 29.Bullmore E, Rabe-Hesketh S, Morris R, Williams S, Gregory L, Gray J, et al. Functional magnetic resonance image analysis of a large-scale neurocognitive network. NeuroImage. 1996;4:16–33. doi: 10.1006/nimg.1996.0026. [DOI] [PubMed] [Google Scholar]
- 30.Mashal N, Faust M, Hendler T. The role of the right hemisphere in processing nonsalient metaphorical meanings: Application of principal components analysis to fmri data. Neuropsychologia. 2005;43:2084–2100. doi: 10.1016/j.neuropsychologia.2005.03.019. [DOI] [PubMed] [Google Scholar]
- 31.Sugiura M, Watanabe J, Maeda Y, Matsue Y, Fukuda H, Kawashima R. Different roles of the frontal and parietal regions in memory-guided saccade: A pca approach on time course of bold signal changes. Human brain mapping. 2004;23:129–139. doi: 10.1002/hbm.20049. [DOI] [PMC free article] [PubMed] [Google Scholar]
- 32.Damaraju E, Allen E, Belger A, Ford J, McEwen S, Mathalon D, et al. Dynamic functional connectivity analysis reveals transient states of dysconnectivity in schizophrenia. NeuroImage: Clinical. 2014;5:298–308. doi: 10.1016/j.nicl.2014.07.003. [DOI] [PMC free article] [PubMed] [Google Scholar]
- 33.Friman O, Borga M, Lundberg P, Knutsson H. Exploratory fmri analysis by autocorrelation maximization. NeuroImage. 2002;16:454–464. doi: 10.1006/nimg.2002.1067. [DOI] [PubMed] [Google Scholar]
- 34.Calhoun VD, Adali T, Pearlson GD, Pekar J. A method for making group inferences from functional mri data using independent component analysis. Human brain mapping. 2001;14:140–151. doi: 10.1002/hbm.1048. [DOI] [PMC free article] [PubMed] [Google Scholar]
- 35.Palanca BJA, Mitra A, Larson-Prior L, Snyder AZ, Avidan MS, Raichle ME. Resting-state functional magnetic resonance imaging correlates of sevoflurane-induced unconsciousness. The Journal of the American Society of Anesthesiologists. 2015;123:346–356. doi: 10.1097/ALN.0000000000000731. [DOI] [PMC free article] [PubMed] [Google Scholar]
- 36.Power JD, Barnes KA, Snyder AZ, Schlaggar BL, Petersen SE. Spurious but systematic correlations in functional connectivity mri networks arise from subject motion. Neuroimage. 2012;59:2142–2154. doi: 10.1016/j.neuroimage.2011.10.018. [DOI] [PMC free article] [PubMed] [Google Scholar]
- 37.Power JD, Mitra A, Laumann TO, Snyder AZ, Schlaggar BL, Petersen SE. Methods to detect, characterize, and remove motion artifact in resting state fmri. Neuroimage. 2014;84:320–341. doi: 10.1016/j.neuroimage.2013.08.048. [DOI] [PMC free article] [PubMed] [Google Scholar]
- 38.Yan CG, Cheung B, Kelly C, Colcombe S, Craddock RC, Di Martino A, et al. A comprehensive assessment of regional variation in the impact of head micromovements on functional connectomics. Neuroimage. 2013;76:183–201. doi: 10.1016/j.neuroimage.2013.03.004. [DOI] [PMC free article] [PubMed] [Google Scholar]
- 39.Hacker CD, Laumann TO, Szrama NP, Baldassarre A, Snyder AZ, Leuthardt EC, et al. Resting state network estimation in individual subjects. Neuroimage. 2013;82:616–633. doi: 10.1016/j.neuroimage.2013.05.108. [DOI] [PMC free article] [PubMed] [Google Scholar]
- 40.Sestieri C, Shulman GL, Corbetta M. Attention to memory and the environment: functional specialization and dynamic competition in human posterior parietal cortex. The Journal of Neuroscience. 2010;30:8445–8456. doi: 10.1523/JNEUROSCI.4719-09.2010. [DOI] [PMC free article] [PubMed] [Google Scholar]
- 41.Sestieri C, Corbetta M, Romani GL, Shulman GL. Episodic memory retrieval, parietal cortex, and the default mode network: functional and topographic analyses. The Journal of neuroscience. 2011;31:4407–4420. doi: 10.1523/JNEUROSCI.3335-10.2011. [DOI] [PMC free article] [PubMed] [Google Scholar]
- 42.Shulman GL, Astafiev SV, Franke D, Pope DL, Snyder AZ, McAvoy MP, et al. Interaction of stimulus-driven reorienting and expectation in ventral and dorsal frontoparietal and basal ganglia-cortical networks. The Journal of Neuroscience. 2009;29:4392–4407. doi: 10.1523/JNEUROSCI.5609-08.2009. [DOI] [PMC free article] [PubMed] [Google Scholar]
- 43.Tosoni A, Shulman GL, Pope AL, McAvoy MP, Corbetta M. Distinct representations for shifts of spatial attention and changes of reward contingencies in the human brain. Cortex. 2013;49:1733–1749. doi: 10.1016/j.cortex.2012.03.022. [DOI] [PMC free article] [PubMed] [Google Scholar]
- 44.Astafiev SV, Stanley CM, Shulman GL, Corbetta M. Extrastriate body area in human occipital cortex responds to the performance of motor actions. Nature neuroscience. 2004;7:542–548. doi: 10.1038/nn1241. [DOI] [PubMed] [Google Scholar]
- 45.Corbetta M, Kincade JM, Ollinger JM, McAvoy MP, Shulman GL. Voluntary orienting is dissociated from target detection in human posterior parietal cortex. Nature neuroscience. 2000;3:292–297. doi: 10.1038/73009. [DOI] [PubMed] [Google Scholar]
- 46.Kincade JM, Abrams RA, Astafiev SV, Shulman GL, Corbetta M. An event-related functional magnetic resonance imaging study of voluntary and stimulus-driven orienting of attention. The Journal of neuroscience. 2005;25:4593–4604. doi: 10.1523/JNEUROSCI.0236-05.2005. [DOI] [PMC free article] [PubMed] [Google Scholar]
- 47.Dosenbach NU, Fair DA, Miezin FM, Cohen AL, Wenger KK, Dosenbach RA, et al. Distinct brain networks for adaptive and stable task control in humans. Proceedings of the National Academy of Sciences. 2007;104:11073–11078. doi: 10.1073/pnas.0704320104. [DOI] [PMC free article] [PubMed] [Google Scholar]
- 48.Sylvester CM, Shulman GL, Jack AI, Corbetta M. Asymmetry of anticipatory activity in visual cortex predicts the locus of attention and perception. The Journal of Neuroscience. 2007;27:14424–14433. doi: 10.1523/JNEUROSCI.3759-07.2007. [DOI] [PMC free article] [PubMed] [Google Scholar]
- 49.Sylvester CM, Jack AI, Corbetta M, Shulman GL. Anticipatory suppression of nonattended locations in visual cortex marks target location and predicts perception. The Journal of Neuroscience. 2008;28:6549–6556. doi: 10.1523/JNEUROSCI.0275-08.2008. [DOI] [PMC free article] [PubMed] [Google Scholar]
- 50.Sylvester CM, Shulman GL, Jack AI, Corbetta M. Anticipatory and stimulus-evoked blood oxygenation level-dependent modulations related to spatial attention reflect a common additive signal. The Journal of Neuroscience. 2009;29:10671–10682. doi: 10.1523/JNEUROSCI.1141-09.2009. [DOI] [PMC free article] [PubMed] [Google Scholar]
- 51.Petacchi A, Laird AR, Fox PT, Bower JM. Cerebellum and auditory function: An ale meta-analysis of functional neuroimaging studies. Human brain mapping. 2005;25:118–128. doi: 10.1002/hbm.20137. [DOI] [PMC free article] [PubMed] [Google Scholar]
- 52.Bright MG, Murphy K. Is fMRI “noise” really noise? resting state nuisance regressors remove variance with network structure. NeuroImage. 2015;114:158–169. doi: 10.1016/j.neuroimage.2015.03.070. [DOI] [PMC free article] [PubMed] [Google Scholar]
- 53.Brodbeck V, Kuhn A, von Wegner F, Morzelewski A, Tagliazucchi E, Borisov S, et al. Eeg microstates of wakefulness and nrem sleep. Neuroimage. 2012;62:2129–2139. doi: 10.1016/j.neuroimage.2012.05.060. [DOI] [PubMed] [Google Scholar]
- 54.Van de Ville D, Britz J, Michel CM. Eeg microstate sequences in healthy humans at rest reveal scale-free dynamics. Proceedings of the National Academy of Sciences. 2010;107:18179–18184. doi: 10.1073/pnas.1007841107. [DOI] [PMC free article] [PubMed] [Google Scholar]
- 55.Kastner S, Pinsk MA, De Weerd P, Desimone R, Ungerleider LG. Increased activity in human visual cortex during directed attention in the absence of visual stimulation. Neuron. 1999;22:751–761. doi: 10.1016/s0896-6273(00)80734-5. [DOI] [PubMed] [Google Scholar]
- 56.Spadone S, Della Penna S, Sestieri C, Betti V, Tosoni A, Perrucci MG, et al. Dynamic reorganization of human resting-state networks during visuospatial attention. Proceedings of the National Academy of Sciences. 2015;112:8112–8117. doi: 10.1073/pnas.1415439112. [DOI] [PMC free article] [PubMed] [Google Scholar]
- 57.Corbetta M, Shulman GL. Control of goal-directed and stimulus-driven attention in the brain. Nature reviews neuroscience. 2002;3:201–215. doi: 10.1038/nrn755. [DOI] [PubMed] [Google Scholar]
- 58.Bressler SL, Tang W, Sylvester CM, Shulman GL, Corbetta M. Top-down control of human visual cortex by frontal and parietal cortex in anticipatory visual spatial attention. The Journal of neuroscience. 2008;28:10056–10061. doi: 10.1523/JNEUROSCI.1776-08.2008. [DOI] [PMC free article] [PubMed] [Google Scholar]


