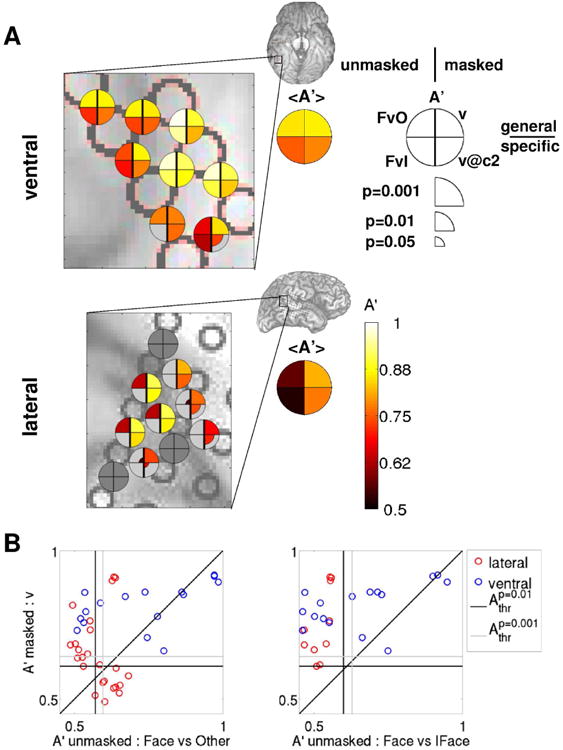
Figure 7. Comparison between decoding visibility in the masked paradigm and decoding image category in the unmasked paradigm: both ventral and lateral areas can discriminate visibility, but only ventral areas can discriminate upright from inverted faces.

(A) Decoding accuracies A′ for a selected group of electrodes from the example subject 153 (the same as shown in Fig. 6A,B) are shown color-coded on the ventral (top) and lateral (bottom) brain images. Accuracies in upright face decoding using the unmasked protocol are shown in the left quadrants (top: upright face vs. other categories; bottom: upright vs. inverted face), accuracies in visibility decoding using the masked protocol are shown in right quadrants (top: v; bottom: v@c2), as indicated in the legend. Only decoding accuracies that are significant at p<0.05 (uncorrected for multiple comparisons) are shown, with larger symbol size indicating higher significance. Brain images show the areas that are enlarged in the main panels. Summary disks indicate the average A′ among the face-responsive electrodes in the selected area. (B) v decoding accuracies in the masked paradigm are plotted against the corresponding decoding accuracies when discriminating upright faces in the unmasked paradigm for each electrode from the example subject that is significant at p<0.01 in at least one of the decoding analyses for each pair of decoding analyses. A more generic unmasked decoding analysis is shown in the left panel (upright faces vs. other categories), a more specific in the right panel (upright vs. inverted faces). The vertical (horizontal) black [gray] line indicates the p=0.01 [0.001] significance threshold for the decoding analysis corresponding to the x (y) axis, averaged over electrodes.
