

Abstract
Human frontal cortex is commonly described as being insensitive to sensory modality, however several recent studies cast doubt on this view. Our laboratory previously reported two visual-biased attention regions interleaved with two auditory-biased attention regions bilaterally within lateral frontal cortex. These regions selectively formed functional networks with posterior visual-biased and auditory-biased attention regions. Here, we conducted a series of functional connectivity analyses to validate and expand this analysis to 469 subjects from the Human Connectome Project (HCP). Functional connectivity analyses replicated the original findings and revealed a novel hemispheric connectivity bias. We also subdivided lateral frontal cortex into 21 thin-slice ROIs and observed bilateral patterns of spatially alternating visual-biased and auditory-biased attention network connectivity. Finally, we performed a correlation difference analysis that revealed five additional bilateral lateral frontal regions differentially connected to either the visual-biased or auditory-biased attention networks. These findings leverage the HCP dataset to demonstrate that sensory-biased attention networks may have widespread influence in lateral frontal cortical organization.
Keywords: attention networks, auditory attention, connectomics, Human Connectome Project, resting state functional connectivity, visual attention
Graphical abstract
1. INTRODUCTION
The degree to which human frontal cortex conducts sensory modality-specific processing remains a controversial issue in neuroscience. Non-human primate research suggests that several areas within dorsal and ventral subdivisions of lateral frontal cortex exhibit a preferred sensory modality (Barbas and Mesalum 1981; Petrides and Pandya 1999; Romanski 2012; Romanski 2007; Romanski and Goldman-Rakic 2002). On the other hand, human-based functional MRI (fMRI) studies of visual and auditory sensory processing in lateral frontal cortex (LFC) typically report either a relative lack of sensitivity to sensory modality (Lewis et al., 2000; Johnson and Zatorre 2006; Ivanoff et al., 2009; Karabanov et al., 2009; Tark and Curtis 2009; Tombu et al., 2011; Braga et al., 2013) or a bias for a single sensory modality (Crottaz-Herbette et al., 2004; Jantzen et al., 2005; Rämä and Courtney 2005; Salmi et al., 2007). However, consistent with non-human primate studies, two recent human fMRI studies (Michalka et al., 2015; Mayer et al., 2017) and one study combining functional and structural connectivity (Braga et al., 2017) found that distinct regions of LFC exhibit strong biases for vision or audition. Another study also reported sensitivity to sensory modality within LFC (Tamber-Rosenau et al., 2013).
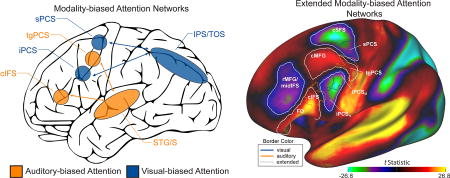
Using a task-based fMRI paradigm that controlled for task difficulty and stimulus drive (see Supplemental Methods and Supplemental Figure 1), our laboratory previously reported that the contrast of visual spatial attention to auditory spatial attention revealed two visual-biased regions interleaved with two auditory-biased regions in lateral frontal cortex (Michalka et al., 2015). These four regions are located along the precentral sulcus and inferior frontal sulcus (Figure 1); from dorsal to ventral, these regions are: superior precentral sulcus (sPCS), transverse gyrus intersecting precentral sulcus (tgPCS), inferior precentral sulcus (iPCS), and caudal inferior frontal sulcus (cIFS). sPCS & iPCS are visual-biased and tgPCS & cIFS are auditory-biased. In posterior cortical regions, this contrast of sensory attention modalities also revealed visual-biased activation along the intraparietal sulcus and transverse occipital sulcus (IPS/TOS) and auditory-biased activation in superior temporal gyrus and sulcus (STG/S; Figure 1). This study also demonstrated, using resting-state functional connectivity, that the frontal and posterior areas segregated into two sensory-biased networks: a visual-biased network, consisting of sPCS, iPCS & IPS/TOS and an auditory-biased network, consisting of tgPCS, cIFS & STG/S.
Figure 1.

Visual- vs. auditory-biased attention networks from Michalka et al. (2015). (A) Task-based fMRI contrast of visual- vs. auditory-spatial attention (VASA) from a representative individual. Bilaterally, 2 visual-biased attention regions, superior precentral sulcus (sPCS) and inferior precentral sulcus (iPCS), were observed to be interleaved with 2 auditory-biased attention regions, transverse gyrus intersecting the precentral sulcus (tgPCS) and caudal inferior frontal sulcus (cIFS). In posterior cortex, visual attention recruited intraparietal sulcus/transverse occipital gyrus (IPS/TOS), while auditory attention recruited superior temporal gyrus/sulcus (STG/S). (B) Summary of rsFC results from Michalka et al. (2015). sPCS, iPCS & IPS/TOS selectively form a visual-biased network, while tgPCS, cIFS & STG/S selectively form an auditory-biased network.
The Michalka et al. (2015) study successfully employed individual subject analysis to localize small, neighboring, functionally differentiated regions. Such regions can be challenging to identify with group averaging techniques. The individual-subject approach to cortical mapping has previously proven effective in human visual neuroscience, but commonly employs only small numbers of subjects (e.g. DeYoe et al., 1996; Tootell et al., 1997; Hansen et al., 2007; Swisher et al., 2007; Heinzle, Kahnt, and Haynes 2011). Even though this approached revealed all eight bilateral ROIs in 90% of subjects, the study has been critiqued due to its small sample size (N=10) (Mayer et al., 2017). The standard deviation of the location of these sensory-biased LFC regions was, on average, 87% of the radial width of the ROIs, thus the anatomical blurring inherent in group-average analyses could mask the existence of these areas even in larger N studies. In order to demonstrate the rigor and generality of these observations, and in light of recent publications detailing the challenges of reproducibility in neuroimaging (Poldrack et al., 2016), we seek to reproduce these laboratory-specific findings with a much larger sample size. Specifically, we define probabilistic ROIs based on task-based fMRI in a small number (N=9) of individual subjects and apply these ROIs to examine resting-state functional connectivity patterns in a large (N=469) publically available dataset from the Human Connectome Project (HCP; Smith et al., 2013; Van Essen et al., 2013). Resting-state functional connectivity (rsFC) can be a powerful technique for identifying functional brain networks (e.g., Biswal et al., 1995; Power et al., 2011; Yeo et al., 2011; Glasser et al., 2016), and here we use this approach to examine sensory-biased attention networks in lateral frontal cortex.
Our analyses reproduce our previous finding of a bilateral pattern of four interleaved lateral frontal lobe regions in a large dataset. The large N of the study afforded the power to make new observations; we identify five additional bilateral regions in LFC that exhibit selective functional connectivity to visual or auditory sensory-biased attention networks. The identification of these regions suggests that the influence of sensory modality may extend more anteriorly across LFC and provides candidate ROIs to be examined in future task-based studies.
2. MATERIALS AND METHODS
2.1 Subject Datasets
Two separate datasets were used for this work: 1) visual vs. auditory spatial attention task fMRI (t-fMRI) data (see Supplemental Materials) and resting state fMRI (rs-fMRI) from 9 healthy individuals previously published in Michalka et al. (2015), hereafter referred to as VASA9, and 2) rs-fMRI data from 469 subjects of the publically available HCP dataset (Van Essen et al., 2013; www.humanconnectome.org) and supported by the WU-Minn HCP Consortium, hereafter referred to as HCP469. The respective Institutional Review Boards of Boston University and Washington University approved all experimental procedures. All subjects provided written informed consent in accordance with the guidelines set by each institution. The VASA9 subjects consisted of healthy, right handed, native English speakers (mean age 27.6 ± 2.7, range 22–31, 5 females) recruited from the Boston University community. This dataset contained structural MRI, t-fMRI and rs-fMRI acquisitions. T-fMRI from the VASA9 dataset was used to create regions of interest (ROIs) from the observed lateral frontal, temporal and parietal sensory-biased attention regions. The HCP469 dataset was used for replication and extension of the Michalka et al. (2015) intrinsic functional connectivity results and novel large-scale characterization of lateral frontal sensory-biased attention networks. rs-fMRI and anatomical cortical surface reconstruction data from the ‘S500’ release dataset were used for this study. See Van Essen et al. (2013) for additional details on this dataset. Of the subjects available in this release, only subjects that possessed at least one pair of left-to-right and right-to-left phase encoded rs-fMRI acquisitions were included. Subjects that exceeded a priori motion thresholds of 1.5 mm total displacement or 0.5 mm mean framewise displacement (FD) were excluded from the study. Timepoints with FD over 0.5 mm were classified as spikes in movement and subjects with greater than 5% of timepoints categorized as spikes were excluded. Exclusion of subjects according to these criteria resulted in sample size of 469 subjects.
2.2 MRI Acquisition
2.2.1 VASA9 Dataset
The VASA9 dataset was acquired at the Center for Brain Science Neuroimaging Facility at Harvard University using a 3-Tesla Siemens Tim Trio MRI scanner (Siemens, Erlangen, Germany) equipped with a 32-channel phased array head coil. T-fMRI and rs-fMRI were acquired with a gradient echo echo-planar imaging sequence sensitive to blood oxygen level dependent contrast (repetition time (TR)/echo time (TE) = 2600/30 ms, flip angle (FA) = 90°, 42 axial slices, 3 mm slice thickness, in-plane resolution 3.125 × 3.125 mm). Rs-fMRI acquisitions were 139 or 256 TRs long and subjects participated in one or two runs each and all available data were used. During rs-fMRI acquisitions, subjects were instructed keep their eyes open, maintain fixation on a centrally presented cross, allow their minds to wander and avoid mental activities such as counting. Details of the task paradigm are described below. In addition, high-resolution (1.0 × 1.0 × 1.0 mm) T1-weighted magnetization-prepared rapid gradient echo structural images were acquired for cortical surface reconstruction.
2.2.2 HCP469
The acquisition protocols for the HCP dataset have been detailed extensively elsewhere (Barch et al., 2013; Smith et al., 2013; Sotiropoulos et al., 2013; Van Essen et al., 2013). Briefly, subjects underwent two days of scanning on the custom Siemens CONNECTOM Skyra MRI scanner (Siemens, Erlangen, Germany) at Washington University in St. Louis. Across the two days of scanning, high-resolution (0.7 mm isotropic voxels) T1-weighted MEMPRAGE and T2-weighted SPACE structural images and up to four gradient-echo echo planar imaging rs-fMRI sequences (TR/TE = 720/33.1 ms, FA = 52°, multiband factor = 8, 72 slices, 2 mm isotropic voxels, 1200 TRs) were acquired. rs-fMRI was acquired in pairs of left-right and right-left phase encoding, one pair on each scan day. Pairs of ‘minimally preprocessed’ + FIX denoised left-to-right and right-to-left phase encoded rs-fMRI acquisitions were further preprocessed, concatenated and used to perform connectivity analyses (see Resting State Data Preprocessing).
2.3 Visual and Auditory Sustained Attention fMRI Task
The nine subjects from the VASA9 dataset each participated in three to six t-fMRI acquisitions during which they performed a visual and auditory sustained attention (VASA) task (Supplemental Figure 1). Both visual and auditory stimuli were presented during all trials during each block and the key task manipulation was the attended sensory modality. Subjects were instructed to monitor one of four rapid serially presented streams of letters and numbers (two auditory, two visual) for any one of four target digits (1, 2, 3, or 4). Subjects attended to only one sensory modality at a time, but auditory and visual stimuli were always presented jointly within each trial to balance stimulus presentation across trials. The non-relevant streams contained only digits to increase the overall difficulty of the task. A visually presented cue was presented prior to the task block to direct the subject to the relevant stream and responses to target stimuli were recorded by pressing the corresponding key on an MRI-safe keypad. Each run consisted of 12 blocks that were evenly divided into the six conditions (‘listen left’, ‘listen right’, ‘watch left’, ‘watch right’, ‘passive’ (sensorimotor control), or ‘fixation’ without the stimuli). Six distractor streams (digits 1–6,8,9) were included as flanking stimuli around the covertly attended visual locations (three flankers each) to balance task difficulty in the visual attention condition to the auditory attention condition (Supplemental Figure 1). Each block contained 40 rapid serial presentations of the 10 stimuli (2 auditory, 2 visual, 6 visual distractors) and lasted 26 seconds. During a sensorimotor control condition, subjects were presented with the same four auditory and visual streams, however they contained only digits. Subjects were instructed to press each of the four response keys once at any point during the block. For additional details regarding the VASA paradigm, stimulus presentation and data acquisition see Supplemental Methods.
2.4 Analysis of t-fMRI Data
Analysis of the VASA t-fMRI data from the VASA9 dataset was carried out in individual native surface space with FreeSurfer’s FS-FAST toolset (https://surfer.nmr.mgh.harvard.edu/fswiki/FsFast). Functional runs were corrected for head movement, slice-time corrected, intensity normalized, resampled onto the subject’s individual reconstructed cortical surfaces using trilinear interpolation and spatially smoothed with a 3 mm full-width half-maximum 2D Gaussian kernel along the cortical surface. Acquisition time series were analyzed with a general linear model by fitting each vertex with regressors that matched the task conditions. For additional details related to preprocessing and analysis of the VASA task see Supplemental Methods.
2.5 Resting State Preprocessing
2.5.1 VASA9 Dataset
Resting state data were preprocessed in a similar manner as the VASA t-fMRI data. Additionally, the rs-fMRI data was further preprocessed to attenuate artifacts that could induce spurious correlations between regions. Several sources of potential signal contamination were first removed via multiple regression, including signal averaged separately over the whole brain, white matter and ventricles, as well as six head motion parameters calculated during motion correction and their temporal derivatives. Time points during which movement exceeded an a priori threshold of 0.5 mm, calculated via framewise displacement (FD; Power et al., 2014), were corrected by linearly interpolating between the neighboring timepoints to censor potentially contaminated signal prior to application of a bandpass filter to isolate frequencies between 0.01 and 0.08.
2.5.2 HCP469
Data from the HCP is ‘minimally preprocessed’ (MPP) by the HCP prior to being made available to the public (Glasser et al., 2013). This preprocessing includes substantial artifact correction (gradient nonlinearity correction, motion correction, EPI distortion correction), as well as independent component-based automated temporal denoising (FIX, Griffanti et al., 2014, Salimi-Khorshidi et al., 2014), highpass filtering (0.0005 Hz cutoff) and registration to MNI152 template space. We used custom MATLAB functions to perform additional preprocessing steps on the MPP+FIX HCP data, including (in order): linear interpolation across high-motion timepoint (> 0.5 mm FD), application of a fourth-order Butterworth temporal bandpass filter to isolate frequencies between 0.009 and 0.08 Hz, temporal denoising and high-motion timepoint censoring via deletion. Evidence exists that physiological artifact still exists in MMP+FIX HCP rs-fMRI data (Burgess et al., 2016), however controversy still exists in the field in regards to the proper methods for addressing temporal noise in rs-fMRI data. To this end, we implemented two separate temporal denoising procedures for the MPP+FIX HCP data to account for physiological artifacts and non-neuronal contributions to the resting state signal: 1) mean ‘grayordinate’ signal regression (MGSR; Burgess et al., 2016) and 2) aCompCor (Behzadi et al., 2007). For the MGSR pipeline, the average signal across all cortical vertices and subcortical voxels was calculated and, along with its first temporal derivative, removed from each grayordinate via multiple regression. We present results calculated with the MGSR pipeline in the main body of the manuscript and the aCompCor pipeline in the Supplemental Materials, however we note that the pattern of rsFC findings are nearly identical across the two techniques when the baseline differences are taken into account. Following linear interpolation, bandpass filtering, temporal denoising and censoring, pairs of left-to-right and right-to-left phase encoded rs-fMRI data acquired on the same day were temporally demeaned and concatenated before rsFC analyses were conducted.
2.6 Probabilistic ROI Definition and Analysis
The VASA study (Michalka et al., 2015) identified four bilateral frontal ROIs (two visual-biased and two auditory-biased) and two bilateral posterior ROIs (one visual-biased and one auditory-biased) in all nine individual subjects. To facilitate transfer of the twelve VASA-derived ROIs from the VASA9 dataset (native surface space) to the HCP469 dataset (fs_LR surface space), individual native surface space subject results from the auditory vs. visual t-fMRI contrast were thresholded at p < 0.05 (uncorrected), projected to the fsaverage template surface via spherical registration and trilinear interpolation (Fischl et al., 1999) and then binarized. This uncorrected threshold was chosen to generate larger regions that, when summed, would encapsulate the expected variability in precise region location across the HCP469 dataset. The probability of any surface vertex belonging to any of the 12 regions of interest was calculated by quantifying the percentage of subjects for which auditory- or visually-biased activation was present (Figure 2). To balance the spatial specificity for each of the ROIs with sensitivity to individual subject variability, a vertex inclusion threshold of 33% (i.e. three out of nine subjects) was chosen. Vertices with equal probability of membership to more than one neighboring ROI were assigned to the smaller of the two regions. This process resulted in four frontal (two auditory, two visual) and two posterior (one auditory, one visual) probabilistic regions per hemisphere (Figure 3A). CIFTI-based fs_LR dense labels corresponding to Figures 3 and 6 will be made available through the Brain Analysis Library of Spatial Maps and Atlases (BALSA) database (Van Essen et al., 2016).
Figure 2.

Subject overlap maps for each frontal and posterior region of interest. Each ROI generated by the VASA fMRI task (Michalka et al., 2015), including sPCS, tgPCS, iPCS, cIFS, IPS/TOS and STG/S (all bilaterally) were thresholded at p<0.05 (uncorrected), binarized, resampled to the surface and summed over subjects. Vertices showing activation for three or greater subjects (green to dark red) were included in that region’s corresponding probabilistic ROI definition.
Figure 3.

Seed-to-seed rsFC results from the HCP469 dataset. (A) Probabilistic ROIs are displayed for each hemisphere, along with their corresponding modality bias predicted by the original dataset. (B) Results of seed-to-seed rsFC analyses using the probabilistic ROIs revealed a pattern of correlation between the frontal and posterior sensory-biased attention regions that strongly replicates the findings of Michalka et al., 2015. Non-parametric unpaired and paired t-tests, FWE-corrected, 10000 sign-flips.
Figure 6.

Spatial relationship between MultiModal Parcellation (MMP) and probabilistic ROIs from VASA9. To visualize the overlap between our results and the MMP parcellation (Glasser et al., 2016), probabilistic ROIs generated from the VASA study (Michalka et al., 2015) were mapped from the fsaverage surface to the fs_LR surface using pre-calculated surface registrations and methodology made available by the HCP (https://goo.gl/UMrX50).
2.7 Frontal Hull Definition and Analysis
In order to further quantify the interleaved spatial arrangement of the four frontal regions, a larger all-encompassing lateral frontal ROI was created. For each hemisphere separately, a convex hull that surrounded the four probabilistic frontal regions was first defined upon the surface. This hull was slightly dilated to account for remaining inter-subject variability in ROI location. The hull was also expanded at the most superior and inferior extents to capture an expected drop in connectivity bias outside of the most superior and inferior extents of the underlying sensory-biased attention regions. This space was then split into 21 segments per hemisphere (average width (geodesic distance): 5.54 ± 1.79 mm, average area: 170.66 ± 57.5 mm2) by hand at approximately equal distances along the primary axis local to each segment (Figure 4A). This approach facilitated a finer sampling of the general LFC region than the larger probabilistic ROI approach allowed and takes advantage of the small voxel size of HCP rs-fMRI data (2mm isotropic). These hull segments were then entered into seed-to-seed rsFC analyses.
Figure 4.

Results from the lateral frontal hull rsFC analysis. (A) Representation of the lateral frontal hull in each hemisphere. Each of the 21 segments are colored according to their bias (blue/visual or orange/auditory) as shown in panel B. (B) The dorsal-to-ventral segmental profile of connectivity reveals alternating regions of biased connectivity to the posterior IPS/TOS and STG/S attention regions. Gray dashed lines indicate probable areal boundaries based on line crossings. Shading indicates standard error of measurement. Gray shading indicates a likely transition into a visual-biased attention region anterior to RH cIFS at slices 20 and 21. Non-parametric paired t-tests, FWE-corrected, 10000 sign-flips..
2.8 Functional Connectivity Analyses
The correlation of each probabilistic frontal ROI with the probabilistic posterior visual-and auditory-biased ROIs was performed by extracting signal from each hemisphere’s IPS/TOS and STG/S ROIs and calculating the Pearson correlation coefficient with signal extracted from each of the eight frontal regions shown in Figure 2. This resulted in both ipsilateral and contralateral frontal-posterior functional connectivity to both the IPS/TOS and STG/S ROIs for each frontal ROI for each HCP469 subject. Similarly, to conduct the frontal hull analysis, signal was extracted from each of the hull segments and correlated with signal extracted from the ipsilateral IPS/TOS and STG/S ROIs; resulting in two values per segment per hemisphere. All correlation values were normalized using Fisher’s r-to-Z transformation prior to aggregation and compared using nonparametric paired and unpaired t-tests using FSL’s PALM software (Winkler et al., 2014; 2015). Group level mean Z scores were converted back to correlation coefficients for reporting purposes.
2.9 Auditory vs. Visual Correlation Difference Analysis
The probabilistic IPS/TOS and STG/S ROIs were used as seeds in a correlation difference analysis on individual subjects of the HCP469 dataset in order to assess whether additional lateral frontal regions possess differential functional connectivity with the sensory-biased attention networks beyond those identified by the VASA t-fMRI contrast (Michalka et al., 2015). For each subject, the average rs-fMRI signal from ipsilateral STG/S and IPS/TOS ROIs was extracted and used to conduct separate vertex-wise rsFC analyses. This analysis was performed separately for each hemisphere using ipsilateral ROIs. Correlation maps were thresholded at zero to exclude negative correlations before subtracting the IPS/TOS correlation map from the STG/S correlation map. Thresholding was performed for the dual purpose of minimizing the influence of ambiguous negative correlations and to remove anti-correlation with the default mode network often reported for rsFC analyses using an IPS seed. Individual results were aggregated and a group level comparison was performed using PALM, correcting for multiple comparisons (p<0.0001, FWE-corrected, 10000 sign-flips, cluster extend threshold z = 3.1) (Figure 5, Supplemental Figure 5). The resulting brain maps identify regions of significantly greater functional connectivity to ipsilateral STG/S or IPS/TOS ROIs.
Figure 5.

Group level results of the correlation difference regression rsFC analysis. By directly contrasting connectivity to IPS/TOS and STG/S probabilistic ROIs, several additional bilateral frontal regions with divergent connectivity to posterior sensory-biased attention regions are revealed. Each prefrontal probabilistic frontal region is extended to include adjacent cortex with matching sensory-bias.
Following correction for multiple comparisons, the 2D spatial gradient for each vertex of the Cohen’s d effect size map was calculated across the cortex by computing the local first spatial derivative using the -cifti-gradient function of the wb_command software package. Local extreme values (min and max) of the effect size gradient map were calculated with wb_command’s -cifti-extrema function. The probabilistic labels were overlayed on these maps and new ROIs, which were refer to as ‘extended network’ ROIs, were manually delineated on the surface using combined information from all three metrics (Cohen’s d, effect size gradient map and the local extrema of the gradient map) and the probabilistic labels (Supplemental Figure 5). Test statistics, significance and average effect size for each ROI are reported in Table 2.
Table 2.
Correlation difference analysis results. Surface area, t statistic and Cohen’s d effect size are reported for equivalent probabilistic LFC ROIs and extended network sensory-biased ROIs identified in the correlation difference analysis. T statistic and Cohen’s d were extracted following group level comparison.
| Region | Area (mm2) | T statistic | Cohen’s d | |
|---|---|---|---|---|
| Right | ||||
| Visual | cSFS | 563.71 | −17.05 | 0.69 |
| sPCS | 592.56 | −14.06 | 0.65 | |
| d-iPCSd | 161.75 | −16.64 | 0.77 | |
| v-iPCSv | 299.52 | −14.28 | 0.68 | |
| rMFG/midIFS | 753.01 | −9.73 | 0.45 | |
| Auditory | cMFG | 279.02 | 11.71 | 0.34 |
| tgPCS | 252.68 | 11.94 | 0.55 | |
| cIFS | 203.90 | 2.10 | 0.10 | |
| FO | 716.97 | 16.76 | 0.45 | |
| Left | ||||
| Visual | cSFS | 590.73 | −16.17 | 0.79 |
| sPCS | 312.99 | −11.59 | 0.54 | |
| iPCSd | 179.57 | −14.29 | 0.66 | |
| iPCSv | 829.60 | −16.14 | 0.75 | |
| rMGF/midIFS | 709.29 | −9.78 | 0.45 | |
| Auditory | cMFG | 827.72 | 12.11 | 0.54 |
| tgPCS | 326.71 | 9.47 | 0.44 | |
| cIFS | 254.22 | 8.26 | 0.38 | |
| FO | 1242.49 | 16.59 | 0.77 | |
3. RESULTS
3.1 Probabilistic ROI Creation
Our prior work (Michalka et al., 2015), employing a task that contrasted visual spatial attention with auditory spatial attention under equal stimulus conditions, revealed a total of twelve (6 per hemisphere) sensory-biased attention regions: sPCS, iPCS and IPS/TOS (visual-biased), and tgPCS, cIFS and STG/S (auditory-biased) (Figure 1). All 12 regions were identified by task activation in nine of ten subjects. Here, we constructed template space probabilistic maps detailing the level of overlap across subject (N=9) for each of these 12 ROIs based upon the individual task-defined ROI (Figure 2). In general, each region possessed a core of high overlap (red) and a larger surround of three-subject overlap (green). Only right cIFS did not contain any vertices of greater than five-subject overlap, indicating high anatomical variability in the location of this ROI across subjects.
In order to generate ROIs that we could map onto subjects from the HCP dataset, we thresholded each of the probabilistic maps at 33% (minimum three-subject). The visually-biased ROIs, sPCS and iPCS (Figure 3A), were found to be larger in the right hemisphere than in the left, while auditory-biased frontal regions, tgPCS and cIFS, were found to be larger in the left when compared to the right, indicating either hemispheric bias in the relative sizes of the regions or greater anatomical variability in spatial location. Our results appear distinct from a recent analysis (Wang et al., 2015), based on the Yeo 17-network parcellation (Yeo et al., 2011), which reported that the ventral attention network is right lateralized and the language network is left lateralized. Here, our visual-biased ROIs primarily fall in the dorsal attention and cognitive control networks of Yeo-17 and our auditory-biased ROIs exhibit very little overlap with the language network of Yeo-17 (Supplemental Figure 2).
3.2 Probabilistic ROI Functional Connectivity Analysis
Using the probabilistic ROIs defined from the VASA9 dataset, we examined rsFC between these ROIs in 469 HCP subjects. Figure 3B displays results for the probabilistic ROI seed-to-seed rsFC analysis (also see Supplemental Figure 3). The original within-subject ROI analysis (Michalka et al., 2015) revealed strong modality-specific attention network functional connectivity for visual-biased sPCS and iPCS and auditory-biased tgPCS and cIFS (Figure 1B). Here, analysis of the HCP469 data set, using probabilistic ROIs defined from the VASA9 subjects, identified this pattern of sensory-specific attention network functional connectivity for all eight frontal ROIs (Figure 3B, Supplemental Figure 3). Both visual-biased attention regions, sPCS and iPCS, in each hemisphere demonstrated significantly higher functional connectivity to the posterior visual ROI, IPS/TOS, than to the posterior auditory ROI, STG/S (Figure 3B, Table 1, Supplemental Figure 3). Conversely, tgPCS and cIFS in each hemisphere demonstrated significantly higher functional connectivity to STG/S than to IPS/TOS. Thus for all eight frontal cortical ROIs this analysis replicated in 469 novel subjects the bilateral pattern of connectivity between frontal sensory-biased attention regions and posterior sensory regions originally observed in the nine subjects of the Michalka et al., (2015) study.
Table 1.
Frontal-to-posterior ROI connectivity. Individual ROI surface area and Pearson’s r-values are reported for the correlation of individual visual or auditory probabilistic LFC ROIs with the ipsilateral posterior visual- and auditory-biased ROIs. t-statistics (t), significant values (p) and repeated measures effect sizes (dRM) from paired t-tests are reported for correlation strength between frontal and posterior ROIs. Correlation values for individual subjects were converted with Fisher’s r-to-z transformation, averaged, and converted back to Pearson correlations for reporting. Non-parametric paired t-tests, FWE-corrected, 10000 sign-flips, Holm-Bonferroni corrected.
| Auditory Attention | Visual Attention | ||||||
|---|---|---|---|---|---|---|---|
|
| |||||||
| Region | Area (mm2) |
STG/S Correlation |
IPS/TOS Correlation |
t-test (IPS/TOS vs. STG/S) |
|||
| r | r | t | p | dRM | |||
|
| |||||||
| Right | |||||||
|
| |||||||
| Visual | sPCS | 585.92 | 0.12 | 0.50 | 30.64 | < 0.0001 | 1.41 |
|
| |||||||
| iPCS | 179.61 | 0.09 | 0.45 | 26.16 | < 0.0001 | 1.21 | |
|
| |||||||
| Auditory | tgPCS | 264.03 | 0.34 | 0.10 | −20.74 | < 0.0001 | 0.96 |
|
| |||||||
| cIFS | 226.62 | 0.17 | 0.11 | −4.89 | 0.0012 | 0.23 | |
|
| |||||||
| Left | |||||||
|
| |||||||
| Visual | sPCS | 312.99 | 0.09 | 0.37 | 18.64 | < 0.0001 | 0.86 |
|
| |||||||
| iPCS | 179.57 | 0.07 | 0.39 | 21.44 | < 0.0001 | 0.99 | |
|
| |||||||
| Auditory | tgPCS | 326.71 | 0.41 | 0.14 | −19.93 | < 0.0001 | 0.92 |
|
| |||||||
| cIFS | 254.22 | 0.29 | 0.08 | −15.44 | < 0.0001 | 0.71 | |
We observed complementary hemispheric asymmetries in the functional connectivity results. Functional connectivity (within-hemisphere) was significantly stronger between IPS/TOS and visual-biased sPCS (p<0.001, t=12.63) and iPCS (p<0.0001, t=6.04) in the right hemisphere than in the left. Conversely, within-hemisphere functional connectivity was significantly stronger between STG/S and auditory-biased tgPCS (p<0.001, t=8.49) and cIFS (p<0.0001, t=10.88) in the left hemisphere than in the right (Table 1).
3.3 Lateral Frontal Hull rsFC Analysis
In order to better quantify the interleaved spatial arrangement of the frontal ROIs, we examined sensory-biased attention network rsFC within LFC at a finer scale, using a set of thin-slice ROIs. To create these ROIs the original LFC ROIs within of each hemisphere were combined into a single convex hull and then manually divided into 21 slices, each oriented approximately perpendicular to the primary axis of the hull (Figure 4A; see Materials and Methods). For each thin-slice ROI, seed-to-seed rsFC with STG/S (auditory) and IPS/TOS (visual) was computed. The normalized correlation values between each segment of the lateral frontal hull and the STG/S and IPS/TOS ROIs were subtracted to obtain a measure of sensory-bias per segment and dichotomized. The resulting connectivity bias map (shown by fill colors of Figure 4A) demonstrated an interleaved profile of alternating visual-auditory biased connectivity along the superior-inferior axis of the hull. The normalized correlation values for each segment (with each of the posterior ROIs) revealed a clearly visible alternating sinusoidal pattern of connectivity (Figure 4B, Supplemental Figure 4). Paired t-tests at each segment revealed non-significant differences near curve crossings (Figure 4B, gray dashed lines), indicating regions of transition between sensory modality. Gray shading (Figure 4B, lower panel) indicates a likely transition into a visual-biased attention region anterior to right cIFS that may correspond to a visual-biased region identified in the correlation difference analysis (see rMFG/midIFS ROI in section 3.4, Figure 5). Within each hemisphere, the hull connectivity profiles to posterior auditory-biased and visual-biased regions are negatively correlated (left: r=-0.6542, p<0.0013; right: r=-0.6739, p<0.0016). This analysis provides a finer-scale demonstration that all eight (four bilateral) sensory-biased lateral frontal regions identified in the VASA9 dataset can be localized in the novel HCP469 dataset using resting-state and confirms their interleaved organization. This is a key confirmation of the Michalka et al. (2015) findings and reveals this pattern in a group average for the first time.
3.4 Whole-Brain Correlation Difference Analysis
The four bilateral sensory-biased frontal lobe regions are positioned in caudal portions of LFC. Based on prior results, it is not clear if these networks, defined on the basis of bias for attended sensory modality, are components of larger modality-biased networks supporting higher order cognition that extend more anteriorly within LFC. To examine this question, we conducted a within-hemisphere vertex-wise correlation difference analysis using signal extracted from ipsilateral IPS/TOS and STG/S regions to probe a greater spatial extent of LFC for differential connectivity to these sensory-biased posterior attention regions. Whole-brain maps of the vertex-wise correlation to each seed were computed, negative correlations were set to zero, and the two positive correlation maps were subtracted (see Materials and Methods for further details). This analysis directly contrasts correlation from posterior sensory-biased attention cortices, IPS/TOS (visual) vs. STG/S (auditory), to localize regions that possess a bias in connectivity for either sensory-biased attention network.
As expected, the probabilistic, task-defined, visual-biased sPCS and iPCS ROIs aligned well with probabilistic regions exhibiting greater connectivity to IPS/TOS, while auditory-biased tgPCS and cIFS ROIs aligned well with regions exhibiting greater connectivity to STG/S (Figure 5, Supplemental Figure 5). Surprisingly, strong preferences for connectivity to IPS/TOS (visual attention) or STG/S (auditory attention) extended more anteriorly within bilateral LFC. This analysis reveals an extended network of putative visual-biased attention regions (ExtNetVIS) and an extended network of putative auditory-biased attention regions (ExtNetAUD) bilaterally in LFC. ExtNetVIS comprises three large regions per hemisphere, while ExtNetAUD comprises two large regions per hemisphere.
Each of the probabilistic VASA9 ROIs lay at one end of a larger ROI. Adjacent to and contiguous with each VASA9 ROI is a secondary region (or ‘buddy area’) that shares the same rsFC bias in the correlation difference analysis. The ExtNetVIS region that encompasses sPCS extends anteriorly into the caudal portion of the superior frontal sulcus (cSFS). The inferior branch of the precentral sulcus divides into a dorsal segment (iPCSd) that intersects the inferior frontal sulcus and corresponds to the iPCS ROI from the VASA9 dataset, and a ventral segment (iPCSv) that lies ventral to the inferior frontal sulcus. The ExtNetAUD region that encompasses tgPCS extends anteriorly into the caudal portion of the middle frontal gyrus (cMFG), while the ExtNetAUD region that encompasses cIFS extends rostro-ventrally into the frontal operculum (FO). Additionally, a third ExtNetVIS region spans rostral middle frontal gyrus and the middle portion of the inferior frontal sulcus (rMFG/midIFS). rMFG/midIFS is not contiguous with visual-biased sPCS or iPCS. The ExtNetVIS connectivity is notably stronger in the midIFS portion of this region.
These functional connectivity results suggest that differential influence of posterior sensory-biased attention network nodes on functional organization within LFC may extend more anteriorly than previously reported. Specifically, this analysis suggests that cSFS, iPCSv, and rMFG/midIFS may exhibit a functional bias toward visual attention processes, while cMFG and FO may be recruited by auditory attention processes. These hypotheses could be examined through task-based fMRI studies. Additionally, these identified regions may prove to be useful ROIs for broader analyses of lateral frontal cortical function.
4. DISCUSSION
Here, we presented three forms of resting-state functional connectivity analysis to investigate sensory-biased attention networks in LFC. This analysis of 469 subjects from the Human Connectome Project dataset (Smith et al., 2013; Van Essen et al., 2013) confirms and extends our previously published results localizing four bilateral lateral frontal attention regions that selectively form functional networks with well-established visual or auditory attention regions (Michalka et al., 2015). We first created cortical surface-based probabilistic ROIs from nine subjects of the original study and applied them to 469 HCP subjects. The ROIs were defined from a task-based fMRI contrast of visual spatial attention vs. auditory spatial attention (with equivalent multi-sensory stimuli across conditions). The posterior seeds were used in all three analyses. Seed-to-seed resting-state analysis between the frontal and posterior seeds replicated, in novel HCP subjects, the sensory-biased connectivity findings of the prior study for all eight (4 areas × 2 hemispheres) frontal ROIs (Figure 3, Supplemental Figure 3). To more finely capture the pattern of intrinsic connectivity in LFC, we created 21 thin-slice ROIs running along the precentral sulcus and inferior frontal sulcus in each hemisphere. Seed-to-seed resting-state analysis between these 21 frontal seeds and the 2 posterior seeds within each hemisphere revealed alternating patterns of two clear regions with stronger connectivity to visual-biased posterior regions and two clear regions with stronger connectivity to auditory-biased posterior regions (Figure 4, Supplemental Figure 4). The highly negative correlation between these two opposing sinusoidal curves indicated that they are nearly antiphase. This finding robustly replicated the Michalka et al. (2015) findings. Finally, we performed a correlation difference seed-to-vertex analysis to reveal regions that had significantly stronger connectivity with either the posterior visual attention or posterior auditory attention seeds. This analysis not only nicely captured the four bilateral sensory-biased frontal regions identified previously, but also revealed an adjacent region (‘buddy area’) for each frontal ROI with matched selectivity for visual or auditory sensory-biased attention networks. These four additional bilateral regions, along with a fifth additional bilateral frontal ROI (rMFG/midIFS) generally lie anterior to the original four bilateral ROIs; this suggests that sensory modality-biased attention network membership could shape the functional organization of much of lateral frontal cortex.
A growing body of research has indicated the utility of characterizing individual differences in rsFC profiles (e.g. Finn et al., 2015; Glasser et al., 2016) and task activation (e.g. Swisher et al., 2007; Thirion et al., 2007; Seghier et al., 2008; Glasser et al., 2016). Analyses of the frontal cortex, especially, can benefit from the use of individual subject analyses due to the high degree of variability in functional regions between subjects (Mueller et al., 2013) and the coarse degree to which frontal cortex has been mapped relative to primary sensory cortices. We hypothesized that we could leverage our previous individual-subject results from investigating sustained auditory/visual attention to localize these regions in a much larger sample where group-level analyses typically obscure relatively smaller frontal sub-regions. Our results show that the pattern of alternating visual and auditory bias can be reliably found in a large dataset using only a probabilistically defined search space and seed-to-seed functional connectivity. These techniques illustrate how large datasets can be leveraged to validate and extend laboratory results. Given the high costs of fMRI, these approaches provide a cost-effective means to demonstrate reproducibility of rsFC network findings. The high quality of the HCP dataset also makes it an appealing choice for these analyses.
The large N of the HCP dataset also revealed new findings that we could not observe with the original small N study. Although sPCS, tgPCS, iPCS and cIFS were robust bilaterally, we did observe complementary patterns of hemispheric asymmetry with visual-biased sPCS and iPCS stronger in the right hemisphere, in terms of ipsilateral rsFC strength, and auditory-biased tgPCS and cIFS more prominent in the left hemisphere. These novel findings may relate to well-characterized hemispheric biases for visual attention and language/auditory processing. For instance, Wang et al. (2015) noted a hemispheric asymmetry in the size of ‘language’ (left lateralized) and ‘ventral attention’ (right lateralized) networks from the Yeo et al. (2011) 17-network parcellation; however, we note that the hemispheric asymmetry presented here arises from regions that are distinct from these two networks (Supplemental Figure 2).
This work, and the work from our lab preceding it, identified interleaved frontal regions with alternating visual or auditory sensory-bias during attention. As noted previously, the dominant hypothesis of frontal stimulus processing is that anterior frontal cortex is largely insensitive to stimulus modality (e.g. Duncan, 2010; Duncan & Owen, 2000). Tamber-Rosenau et al. (2013) reported evidence for modality sensitivity in posterior LFC using a multivariate analysis approach, however their results did not reveal sensory-biases at the level of individual ROIs. In contrast to many past studies, our previous work used individual subject analyses to reveal the fine-grained pattern of modality bias in LFC (Michalka et al., 2015). These techniques provide the sensitivity to localize small, highly specialized regions that are spatially variable and obscured by group averaging or larger smoothing kernels. The probabilistic ROIs used here were derived from individual subject analyses, making it more likely to detect these relatively small clusters than group average fMRI or rsFC results. These observations suggest that the high degree of inter-subject variability of frontal rsFC (Mueller et al., 2013) may be why previous human neuroimaging studies employing group averaging either failed to localize these regions or reported a bias for a single modality. It is notable that the present results identified these frontal lobe regions from resting-state data alone. In contrast, the identification of fine-grained functional networks with task fMRI often requires training prior to scanning, multiple lengthy and expensive MRI acquisitions and difficult task requirements, such as maintaining fixation for extended periods of time or implementing complex rules. The present results offer an important alternative method for identifying brain regions in circumstances where it is difficult or impossible to acquire task fMRI data, such as in patient populations or in settings where scan time is severely limited, such as the hospital setting.
Two other recent studies also provide evidence for sensory-biased networks within LFC. One study used a multisensory Stroop task to identify two visually biased ROIs and one bilateral auditory biased ROI (Mayer et al., 2017) engaged by this cognitive control task. In contrast to our own individual subject results, the reliable localization of these ROIs required at least 30 subjects, perhaps due to the use of group analyses in an average space. The Stroop task did not identify the ROIs we refer to as sPCS, tgPCS or cIFS, although the region identified as iFEF appears to partially overlap with our iPCS. It is worth noting that the posterior visual and auditory seeds in the Mayer et al. (2017) study differ substantially from the IPS/TOS and STG/S seeds used in our analyses, and this may account for the discrepancies relative to our studies. Topographic differences related to using primary sensory or secondary association cortex as seeds for calculating connectivity with LFC remain to be fully investigated. The second study used structural connectivity and rsFC analyses to propose a dorsal-to-ventral gradient of visual-to-auditory bias in frontal cortex (Braga et al., 2017). This study also used seeds that differ substantially from those used here and are more similar to that of Mayer et al. (2017). Notably, their frontal results largely omit the more caudal regions detailed here and our results do not appear to identify the most anterior auditory regions of Mayer et al. (2017); leaving open the possibility that these results coexist. It remains to be investigated whether the differences between studies regarding the findings of sensory-biased influences in lateral frontal cortical organization are due to the use of group averaging, volumetric smoothing, task differences or selection of primary vs. secondary sensory ROIs in rsFC analyses.
Results from our final frontal lobe analysis, the correlation difference analysis contrasting functional connectivity to posterior visual attention and auditory attention seeds, revealed an additional five bilateral lateral frontal lobe regions that exhibit selective functional connectivity to the posterior auditory attention or posterior visual attention networks. The original four sensory-biased frontal lobe regions in each hemisphere were found to each have an adjacent region (‘buddy area’) that exhibited a similar pattern of functional connectivity with sensory-biased posterior attention regions. In the ExtNetVIS, caudal superior frontal sulcus (cSFS) lies anterior to sPCS and iPCSv lies in the ventral segment of the inferior precentral sulcus beneath the iPCS (or iPCSd) ROI defined from the VASA9 dataset. In the ExtNetAUD, caudal middle frontal gyrus (cMFG) lies anterior to tgPCS and the frontal operculum (FO) lies anterior and ventral to cIFS. The fifth region, rMFG/midIFS, exhibits a somewhat weaker connectivity bias (toward the visual attention network) than observed in the four ‘buddy areas.’ This could reflect a reduced influence of sensory-biased attention and/or greater individual anatomical variability in the location of this region. It is important to note that these five bilateral regions were identified here via resting-state functional connectivity only. Our findings suggest that the influence of sensory modality on functional organization may extend across much of LFC. Alternatively, these regions could reflect the influence of other cognitive biases that happen to co-localize with the posterior seed regions (IPS/TOS and STG/S), which were defined by preference for sensory attention modality. Therefore, it will be critical to further examine these regions using task-based fMRI.
Comparison of the location of these new regions to prior studies that did not examine sensory-bias can indicate some of the functional expectations for these regions. Several visual attention and visual working memory fMRI studies reveal activation patterns that appear to approximately correspond to all three LFC regions of the ExtNetVIS (e.g. Hagler and Sereno 2006; Srimal and Curtis 2008; Szczepanski et al., 2010; Brissenden et al., 2016); notably, activation patterns are often larger than the VASA9 sPCS and iPCS ROIs. In the auditory-biased network (ExtNetAUD) we identified a bilateral region that extends into caudal middle frontal gyrus (cMFG) and a second bilateral region in the frontal operculum (FO) that extends from cIFS. These regions overlap with cortex recruited during a story comprehension task (Barch et al., 2013; Glasser et al., 2016) included in the HCP dataset, therefore suggesting a progression from auditory attention in the caudal regions to language processing in these more rostral regions. We note that our findings are more strongly bilateral than typical reports of language associated regions.
A recent study employed HCP data to produce a novel parcellation of all of the cerebral cortex (Glasser et al., 2016). This study combined resting-state, task, and structural data in a highly sophisticated computational framework and may have a profound impact on our understanding of the functional organization of the human cerebral cortex. One LFC region highlighted in this analysis, named ‘area 55b,’ lies near our previously identified tgPCS and was shown to differ from adjacent dorsal and ventral regions on the basis of language task activation, estimated myelination, and patterns of resting-state functional connectivity. Given the clear relevance of this study to our findings, we have examined the relationship between our sensory-biased LFC regions and regions from the HCP’s Multi-Modal Parcellation (MMP). We found good alignment between our original four bilateral LFC regions and specific parcels of the MMP (Figure 6). The degree of correspondence (Jaccard Index) between our probabilistic ROIs and any overlapping parcel of the MMP is quantified in Supplemental Table 1. There is partial alignment between tgPCS and area 55b; the dorsal and ventral boundaries tightly align, but the center of tgPCS lies posterior to the center of area 55b. Area 55b also encompasses much of the anterior region that we identify here as caudal MFG (cMFG). Given the use of a language task in creation of the MMP, we conjecture that this anterior region emphasizes language function (at least in the left hemisphere), while the more posterior portion, our original bilateral tgPCS, emphasizes auditory function independent of language function. That is, we interpret our results as providing initial evidence for functional sub-regions within the larger ‘area 55b’ parcel quantified in Glasser et al. (2016). Alternately, there could be a rostral-to-caudal gradient of functionality within ‘area 55b’ (see Glasser et al., 2016, Supplement 3, Supplemental Figure 18). These hypotheses should be investigated through appropriate task and connectivity studies. It is important to note that our use of a probabilistic ROI enforces a hard boundary within the MMP area termed ‘55b’ (Figure 6) and future work will need to determine whether there are indeed functionally-specific subregions or a more gradual gradient of function along the anterior-to-posterior axis exists within ‘55b’ (see Glasser et al., 2016, Supplement 3, Figure 18). Further investigation of how sensory-biased attention networks overlap with cortical myelination patterns (Glasser et al. 2011, 2014) and structural connectivity profiles, modalities that are both available in the HCP dataset, could also prove illuminating.
Several organizing principles have been suggested for frontal cortex, however no dominant theory has yet emerged. It is possible that the visual-biased network may merge into what is referred to as the ‘multiple-demand’ network (Fedorenko et al., 2013; Fedorenko 2014), although sPCS and iPCS exhibit a strong bias for the attended sensory modality and thus fail to meet the strong definition of domain-general cortex. Another prominent view of lateral frontal cortical organization is that there is a rostral-caudal gradient of hierarchical processing (Koechlin et al., 2003; Badre 2008; Badre and D’Esposito 2009). Although our findings do not directly address hierarchical organization, the finding of the secondary regions within these sensory-biased networks suggests three related hypotheses. Hierarchical organization might proceed in parallel in the two sensory-biased attention networks, presumably merging in more rostral structures that are insensitive to sensory modality. Another possibility is that the hierarchical organization previously reported might be restricted to only one of these networks; the visual-biased network appears to be the more likely candidate. Alternately, hierarchical organization may be independent of these sensory-biased networks, reflecting a complex multiplexed organization of LFC. The degree to which these organizing principles coexist, and overlap with sensory-biased regions of LFC remains to be investigated.
Our prior work (Michalka et al., 2015) suggests yet another organization framework for LFC: spatial vs. temporal processing. The ‘domain recruitment hypothesis’ (Michalka et al., 2015), an extension of the modality appropriateness hypothesis (Welch and Warren 1980), suggests that visual-biased cortical regions excel at spatial processing and auditory-biased cortical regions excel at temporal processing. Moreover, these regions may be recruited based upon task demands, rather solely by specific modalities. The Michalka et al. (2015) study reported key evidence in support of the domain recruitment hypothesis: a purely auditory task with high spatial demands recruited visually-biased sPCS and iPCS (relative to a matched auditory temporal task) and a purely visual task with high temporal demands recruited auditory-biased tgPCS and cIFS (relative to a matched visual spatial task). These findings indicated that both sensory modality (visual/auditory) and information domain (spatial/temporal) influence functional organization for sPCS, iPCS, tgPCS, and cIFS. The relative influence of sensory modality and information domain on the organization of more anterior frontal regions is a question that awaits further investigation.
5. CONCLUSIONS
The series of functional connectivity studies presented here confirm and extend our previous report of regions within lateral frontal cortex that are selectively recruited during modality-biased attention and belong to differentiable cortical networks supporting attention to visual or auditory stimuli. We established the interleaved pattern of four bilateral sensory-biased attention regions using only probabilistic ROIs and functional connectivity. Furthermore, we provide evidence for additional frontal cortex regions that are selectively connected to parietal visual-biased or temporal auditor-biased attention regions. The existence of additional modality-biased cortex in more anterior regions of frontal cortex suggests that sensory attention modality may provide a fundamental framework for structuring frontal cortical information processing. Future studies should investigate these areas more fully with task fMRI studies. It will be important to compare and contrast frontal cortical sensory-biased regions for difference in task recruitment and connectivity profiles.
Supplementary Material
Acknowledgments
Funding
This work was supported by the National Institutes of Health (NIH R01EY022229 to DCS and NIH T90-DA032484 to SMT), CELEST, a National Science Foundation Science of Learning Center (NSF SMA-0835976), and by the Rafik B. Hariri Institute for Computing and Computational Science & Engineering at Boston University.
We would like to thank Barbara Shinn-Cunningham and Frank Guenther for useful comments on cortical auditory and language networks. HCP469 data were provided [in part] by the Human Connectome Project, WU-Minn Consortium (Principal Investigators: David Van Essen and Kamil Ugurbil; 1U54MH091657) funded by the 16 NIH Institutes and Centers that support the NIH Blueprint for Neuroscience Research; and by the McDonnell Center for Systems Neuroscience at Washington University.
Footnotes
Publisher's Disclaimer: This is a PDF file of an unedited manuscript that has been accepted for publication. As a service to our customers we are providing this early version of the manuscript. The manuscript will undergo copyediting, typesetting, and review of the resulting proof before it is published in its final citable form. Please note that during the production process errors may be discovered which could affect the content, and all legal disclaimers that apply to the journal pertain.
All authors take full responsibility for the data, the analyses and interpretation, and the conduct of the research. The corresponding author has full access to all the data and has the right to publish any and all data, separate and apart from the attitudes of the sponsor. The funding source had no role in the study design or in the collection, analysis and interpretation of data.
The Methods section includes a statement that IRB approval as been obtained for the use of human subjects for this study. Written informed consent was obtained for all experimental subjects.
Competing Interests
The authors have no financial or non-financial competing interests in these research findings.
References
- Badre D. Cognitive control, hierarchy, and the rostro-caudal organization of the frontal lobes. Trends Cogn Sci. 2008;12:193–200. doi: 10.1016/j.tics.2008.02.004. [DOI] [PubMed] [Google Scholar]
- Badre D, D’Esposito M. Is the rostro-caudal axis of the frontal lobe hierarchical? Nat Rev Neurosci. 2009;10:659–669. doi: 10.1038/nrn2667. [DOI] [PMC free article] [PubMed] [Google Scholar]
- Barbas H, Mesalum M. Organization of afferent input to subdivisions of area 8 in the rhesus monkey. J Comp Neuro. 1981;200:407–431. doi: 10.1002/cne.902000309. [DOI] [PubMed] [Google Scholar]
- Barch DM, Burgess GC, Harms MP, Petersen SE, Schlaggar BL, Corbetta M, Glasser MF, Curtiss S, Dixit S, Feldt C, Nolan D, Bryant E, Hartley T, Footer O, Bjork JM, Poldrack R, Smith S, Johansen-Berg H, Snyder AZ, Van Essen DC, Consortium WU-MH. Function in the human connectome: task-fMRI and individual differences in behavior. Neuroimage. 2013;80:169–189. doi: 10.1016/j.neuroimage.2013.05.033. [DOI] [PMC free article] [PubMed] [Google Scholar]
- Behzadi Y, Restom K, Liau J, Liu TT. A component based noise orrection method (CompCor) for BOLD and perfusion based fMRI. Neuroimage. 2007;37:90–101. doi: 10.1016/j.neuroimage.2007.04.042. [DOI] [PMC free article] [PubMed] [Google Scholar]
- Biswal B, Yetkin FZ, Haughton VM, Hyde JS. Functional connectivity in the motor cortex of resting human brain using echo-planar MRI. Magn Reson Med. 1995;34:537–541. doi: 10.1002/mrm.1910340409. [DOI] [PubMed] [Google Scholar]
- Braga RM, Hellyer PJ, Wise RJ, Leech R. Auditory and visual connectivity gradients in frontoparietal cortex. Hum Brain Mapp. 2017;38:255–270. doi: 10.1002/hbm.23358. [DOI] [PMC free article] [PubMed] [Google Scholar]
- Braga RM, Wilson LR, Sharp DJ, Wise RJ, Leech R. Separable networks for top-down attention to auditory non-spatial and visuospatial modalities. Neuroimage. 2013;74:77–86. doi: 10.1016/j.neuroimage.2013.02.023. [DOI] [PMC free article] [PubMed] [Google Scholar]
- Brissenden JA, Levin EJ, Osher DE, Halko MA, Somers DC. Functional Evidence for a Cerebellar Node of the Dorsal Attention Network. J Neurosci. 2016;36:6083–6096. doi: 10.1523/JNEUROSCI.0344-16.2016. [DOI] [PMC free article] [PubMed] [Google Scholar]
- Burgess G, Kandala S, Nolan D, Laumann T, Power J, Adeyemo B, Harms M, Peterson S, Barch D. Evaluation of Denoising Strategies to Address Motion-Correlated Artifact in Resting State fMRI Data from the Human Connectome Project. Brain Connectivity. 2016 doi: 10.1089/brain.2016.0435. [DOI] [PMC free article] [PubMed] [Google Scholar]
- Crottaz-Herbette S, Anagnoson RT, Menon V. Modality effects in verbal working memory: differential prefrontal and parietal responses to auditory and visual stimuli. Neuroimage. 2004;21:340–351. doi: 10.1016/j.neuroimage.2003.09.019. [DOI] [PubMed] [Google Scholar]
- DeYeo EA, Carman GJ, Bandettini P, Glickman S, Wieser J, Cox R, Miller R, Neitz J. Mapping striate and extrastriate visual areas in human cerebral cortex. Proc Natl Acad Sci U S A. 1996;93:2382–2386. doi: 10.1073/pnas.93.6.2382. [DOI] [PMC free article] [PubMed] [Google Scholar]
- Duncan J. The multiple-demand (MD) system of the primate brain: Mental programs for intelligent behaviour. Trends in Cognitive Sciences. 2010;14(4):172–9. doi: 10.1016/j.tics.2010.01.004. [DOI] [PubMed] [Google Scholar]
- Duncan J, Owen AM. Common regions of the human frontal lobe recruited by diverse cognitive demands. Trends in Neurosciences. 2000;23(10):475–483. doi: 10.1016/s0166-2236(00)01633-7. [DOI] [PubMed] [Google Scholar]
- Fedorenko E. The role of domain-general cognitive control in language comprehension. Front Psychol. 2014;5:335. doi: 10.3389/fpsyg.2014.00335. [DOI] [PMC free article] [PubMed] [Google Scholar]
- Fedorenko E, Duncan J, Kanwisher N. Broad domain generality in focal regions of frontal and parietal cortex. Proc Natl Acad Sci U S A. 2013;110:16616–16621. doi: 10.1073/pnas.1315235110. [DOI] [PMC free article] [PubMed] [Google Scholar]
- Finn ES, Shen X, Scheinost D, Rosenberg MD, Huang J, Chun MM, Papademetris X, Constable RT. Functional connectome fingerprinting: identifying individuals using patterns of brain connectivity. Nat Neurosci. 2015;18:1664–1671. doi: 10.1038/nn.4135. [DOI] [PMC free article] [PubMed] [Google Scholar]
- Fischl B, Sereno MI, Tootell RB, Dale AM. High-resolution intersubject averaging and a coordinate system for the cortical surface. Hum Brain Mapp. 1999;8:272–284. doi: 10.1002/(SICI)1097-0193(1999)8:4<272::AID-HBM10>3.0.CO;2-4. [DOI] [PMC free article] [PubMed] [Google Scholar]
- Glasser MF, Coalson TS, Robinson EC, Hacker CD, Harwell J, Yacoub E, et al. A multi-modal parcellation of human cerebral cortex. Nature. 2016;536(7615):171–178. doi: 10.1038/nature18933. [DOI] [PMC free article] [PubMed] [Google Scholar]
- Glasser MF, Sotiropoulos SN, Wilson JA, Coalson TS, Fischl B, Andersson JL, et al. The minimal preprocessing pipelines for the Human Connectome Project. NeuroImage. 2013;80:105–124. doi: 10.1016/j.neuroimage.2013.04.127. [DOI] [PMC free article] [PubMed] [Google Scholar]
- Griffanti G, Salimi-Korshidi, Beckmann CF, Auerbach EJ, Bouaud G, Sexton CE, Zsoldos E, Ebmeier K, Filippini N, Mackay CE, Moeller S, Xu JG, Yacoub E, Baselli G, Ugurbil K, Miller KL, Smith SM. ICA-based artefact removal and accelerated fMRI acquisition for improved resting state network imaging. Neuroimage. 2014;95:232–47. doi: 10.1016/j.neuroimage.2014.03.034. [DOI] [PMC free article] [PubMed] [Google Scholar]
- Hagler DJ, Jr, Sereno MI. Spatial maps in frontal and prefrontal cortex. Neuroimage. 2006;29:567–577. doi: 10.1016/j.neuroimage.2005.08.058. [DOI] [PubMed] [Google Scholar]
- Hansen KA, Kay KN, Gallant JL. Topographic Organization in and near Human Visual Area V4. Journal of Neuroscience. 2007;27(44):11896–11911. doi: 10.1523/JNEUROSCI.2991-07.2007. [DOI] [PMC free article] [PubMed] [Google Scholar]
- Heinzle J, Kahnt T, Haynes JD. Topographically specific functional connectivity between visual field maps in the human brain. Neuroimage. 2011;56(3):1426–36. doi: 10.1016/j.neuroimage.2011.02.077. [DOI] [PubMed] [Google Scholar]
- Ivanoff J, Branning P, Marois R. Mapping the pathways of information processing from sensation to action in for distinct sensorimotor tasks. Hum Brain Mapp. 2009;30:4167–4189. doi: 10.1002/hbm.20837. [DOI] [PMC free article] [PubMed] [Google Scholar]
- Jantzen K, Steinberg F, Kelso J. Functional MRI reveals the existence of modality and coordination-dependent timing networks. Neuroimage. 2005;25:1031–1042. doi: 10.1016/j.neuroimage.2004.12.029. [DOI] [PubMed] [Google Scholar]
- Johnson JA, Zatorre RJ. Neural substrates for dividing and focusing attention between simultaneous auditory and visual events. Neuroimage. 2006;31:1673–1681. doi: 10.1016/j.neuroimage.2006.02.026. [DOI] [PubMed] [Google Scholar]
- Karabanov A, Blom O, Forsman L, Ullén F. The dorsal auditory pathway is involved in performance of both visual and auditory rhythms. Neuroimage. 2009;44:480–488. doi: 10.1016/j.neuroimage.2008.08.047. [DOI] [PubMed] [Google Scholar]
- Koechlin E, Ody C, Kouneiher F. The architecture of cognitive control in the human prefrontal cortex. Science. 2003;302:1181–1185. doi: 10.1126/science.1088545. [DOI] [PubMed] [Google Scholar]
- Mayer AR, Ryman SG, Hanlon FM, Dodd AB, Ling JM. Look Hear! The Prefrontal Cortex is Stratified by Modality of Sensory Input During Multisensory Cognitive Control. Cereb Cortex. 2017;27(5):2832–2840. doi: 10.1093/cercor/bhw131. [DOI] [PMC free article] [PubMed] [Google Scholar]
- Michalka SW, Kong L, Rosen ML, Shinn-Cunningham BG, Somers DC. Short-Term Memory for Space and Time Flexibly Recruit Complementary Sensory-Biased Frontal Lobe Attention Networks. Neuron. 2015;87:882–892. doi: 10.1016/j.neuron.2015.07.028. [DOI] [PMC free article] [PubMed] [Google Scholar]
- Mueller S, Wang D, Fox MD, Yeo BT, Sepulcre J, Sabuncu MR, Shafee R, Lu J, Liu H. Individual variability in functional connectivity architecture of the human brain. Neuron. 2013;77:586–595. doi: 10.1016/j.neuron.2012.12.028. [DOI] [PMC free article] [PubMed] [Google Scholar]
- Lewis JW, Beauchamp MS, DeYoe EA. A comparison of visual and auditory attention motion processing in human cerebral cortex. Cereb Cortex. 2000;10:873–888. doi: 10.1093/cercor/10.9.873. [DOI] [PubMed] [Google Scholar]
- Petrides M, Pandya D. Dorsolateral prefrontal cortex: comparative cytoarchitectonic analysis in the human and macaque brain and corticocortical connection patterns. Eur J Neurosci. 1999;11:1011–1036. doi: 10.1046/j.1460-9568.1999.00518.x. [DOI] [PubMed] [Google Scholar]
- Poldrack RA, Baker CI, Durnez J, Gorgolewski KJ, Matthews PM, Manufo MR, Nichols TE, Poline J-B, Vul E, Yarkoni T. Scanning the horizon: towards transparent and reproducible neuroimaging research. Nat Rev Neurosci. 2017;18:115–126. doi: 10.1038/nrn.2016.167. [DOI] [PMC free article] [PubMed] [Google Scholar]
- Power JD, Mitra A, Laumann TO, Snyder AZ, Schlaggar BL, Petersen SE. Methods to detect, characterize, and remove motion artifact in resting state fMRI. Neuroimage. 2014;84:320–341. doi: 10.1016/j.neuroimage.2013.08.048. [DOI] [PMC free article] [PubMed] [Google Scholar]
- Rämä P, Courtney S. Functional topography of working memory for face and voice identity. Neuroimage. 2005;24:224–234. doi: 10.1016/j.neuroimage.2004.08.024. [DOI] [PubMed] [Google Scholar]
- Romanski L. Integration of faces and vocalizations in ventral prefrontal cortex: Implications for the evolution of audiovisual speech. Proc Natl Acad Sci U S A. 2012;109:10717–10724. doi: 10.1073/pnas.1204335109. [DOI] [PMC free article] [PubMed] [Google Scholar]
- Romanski L. Representation and integration of auditory and visual stimuli in the primate ventral lateral prefrontal cortex. Cereb Cortex. 2007;17:i61–i69. doi: 10.1093/cercor/bhm099. [DOI] [PMC free article] [PubMed] [Google Scholar]
- Romanski L, Goldman-Rakic P. An auditory domain in primate prefrontal cortex. Nat Neurosci. 2002;5:15–16. doi: 10.1038/nn781. [DOI] [PMC free article] [PubMed] [Google Scholar]
- Salimi-Khorshidi G, Douaud G, Beckmann CF, Glasser MF, Griffanti L, Smith SM. Automatic denoising of functional MRI data: Combining independent component analysis and hierarchical fusion of classifiers. Neuroimage. 2014;90:449–68. doi: 10.1016/j.neuroimage.2013.11.046. [DOI] [PMC free article] [PubMed] [Google Scholar]
- Salmi J, Rinne T, Degerman A, Salonen O, Alho K. Orienting and maintenance of spatial attention in audition and vision: multimodal and modality-specific brain activations. Brain Struct Funct. 2007;212:181–194. doi: 10.1007/s00429-007-0152-2. [DOI] [PubMed] [Google Scholar]
- Seghier ML, Lazeyras F, Pegna AJ, Annoni JM, Khateb A. Group analysis and the subject factor in functional magnetic resonance imaging: analysis of fifty right-handed healthy subjects in a semantic language task. Hum Brain Mapp. 2008;29:461–477. doi: 10.1002/hbm.20410. [DOI] [PMC free article] [PubMed] [Google Scholar]
- Smith SM, Beckmann CF, Andersson J, Auerbach EJ, Bijsterbosch J, Douaud G, Duff E, Feinberg DA, Griffanti L, Harms MP, Kelly M, Laumann T, Miller KL, Moeller S, Petersen S, Power J, Salimi-Khorshidi G, Snyder AZ, Vu AT, Woolrich MW, Xu J, Yacoub E, Ugurbil K, Van Essen DC, Glasser MF, Consortium WU-MH. Resting-state fMRI in the Human Connectome Project. Neuroimage. 2013;80:144–168. doi: 10.1016/j.neuroimage.2013.05.039. [DOI] [PMC free article] [PubMed] [Google Scholar]
- Sotiropoulos SN, Jbabdi S, Xu J, Andersson JL, Moeller S, Auerbach EJ, Glasser MF, Hernandez M, Sapiro G, Jenkinson M, Feinberg DA, Yacoub E, Lenglet C, Van Essen DC, Ugurbil K, Behrens TE, Consortium WU-MH. Advances in diffusion MRI acquisition and processing in the Human Connectome Project. Neuroimage. 2013;80:125–143. doi: 10.1016/j.neuroimage.2013.05.057. [DOI] [PMC free article] [PubMed] [Google Scholar]
- Srimal R, Curtis CE. Persistent neural activity during the maintenance of spatial position in working memory. Neuroimage. 2008;39(1):455–468. doi: 10.1016/j.neuroimage.2007.08.040. [DOI] [PMC free article] [PubMed] [Google Scholar]
- Swisher JD, Halko MA, Merabet LB, McMains SA, Somers DC. Visual topography of human intraparietal sulcus. The Journal of Neuroscience : the Official Journal of the Society for Neuroscience. 2007;27(20):5326–5337. doi: 10.1523/JNEUROSCI.0991-07.2007. http://doi.org/10.1523/JNEUROSCI.0991-07.2007. [DOI] [PMC free article] [PubMed] [Google Scholar]
- Szczepanski SM, Konen CS, Kastner S. Mechanisms of spatial attention control in frontal and parietal cortex. J Neurosci. 2010;30:148–160. doi: 10.1523/JNEUROSCI.3862-09.2010. [DOI] [PMC free article] [PubMed] [Google Scholar]
- Tamber-Rosenau BJ, Dux PE, Tombu MN, Asplund CL, Marois R. Amodal processing in human prefrontal cortex. J Neurosci. 2013;33:11573–11587. doi: 10.1523/JNEUROSCI.4601-12.2013. [DOI] [PMC free article] [PubMed] [Google Scholar]
- Tark K-JJ, Curtis CE. Persistent neural activity in the human frontal cortex when maintaining space that is off the map. Nat Neurosci. 2009;12:1463–1468. doi: 10.1038/nn.2406. [DOI] [PMC free article] [PubMed] [Google Scholar]
- Thirion B, Pinel P, Meriaux S, Roche A, Dehaene S, Poline JB. Analysis of a large fMRI cohort: Statistical and methodological issues for group analyses. Neuroimage. 2007;35:105–120. doi: 10.1016/j.neuroimage.2006.11.054. [DOI] [PubMed] [Google Scholar]
- Tombu M, Asplund C, Dux P, Godwin D, Martin J, Marois R. A unified attentional bottleneck in the human brain. Proc Natl Acad Sci USA. 2011;108:13426–13431. doi: 10.1073/pnas.1103583108. [DOI] [PMC free article] [PubMed] [Google Scholar]
- Tootell RB, Mendola JD, Hadjikhani NK, Ledden PJ, Liu AK, Reppas JB, et al. Functional analysis of V3A and related areas in human visual cortex. J Neurosci. 1997;17:7060–7078. doi: 10.1523/JNEUROSCI.17-18-07060.1997. [DOI] [PMC free article] [PubMed] [Google Scholar]
- Van Essen DC, Smith SM, Barch DM, Behrens TE, Yacoub E, Ugurbil K, Consortium WU-MH. The WU-Minn Human Connectome Project: an overview. Neuroimage. 2013;80:62–79. doi: 10.1016/j.neuroimage.2013.05.041. [DOI] [PMC free article] [PubMed] [Google Scholar]
- Wang D, Buckner RL, Fox MD, Holt DJ, Holmes AJ, Stoecklein S, Langs G, Pan R, Qian T, Li K, Baker JT, Stufflebeam SM, Wang K, Wang X, Hong B, Liu H. Parcellating cortical functional networks in individuals. Nat. Neurosci. 2015;18:1853–1860. doi: 10.1038/nn.4164. [DOI] [PMC free article] [PubMed] [Google Scholar]
- Welch RB, Warren DH. Immediate Perceptual Response to Intersensory Discrepency. Psychol Bull. 1980:88. [PubMed] [Google Scholar]
- Winkler AM, Ridgway GR, Webster MA, Smith SM, Nichols TE. Permutation inference for the general linear model. NeuroImage. 2014;92:381–397. doi: 10.1016/j.neuroimage.2014.01.060. [DOI] [PMC free article] [PubMed] [Google Scholar]
- Winkler AM, Webster MA, Vidaurre D, Nichols TE, Smith SM. Multi-level block permutation. Neuroimage. 2015;123:253–68. doi: 10.1016/j.neuroimage.2015.05.092. [DOI] [PMC free article] [PubMed] [Google Scholar]
- Yeo BTT, Krienen FM, Sepulcre J, Sabuncu MR, Lashkari D, Hollinshead M, et al. The organization of the human cerebral cortex estimated by intrinsic functional connectivity. Journal of Neurophysiology. 2011;106(3):1125–1165. doi: 10.1152/jn.00338.2011. [DOI] [PMC free article] [PubMed] [Google Scholar]
- Yeterian EH, Pandya DN, Tomaiuolo F, Petrides M. The cortical connectivity of the prefrontal cortex in the monkey brain. Cortex. 2012;48:58–81. doi: 10.1016/j.cortex.2011.03.004. [DOI] [PMC free article] [PubMed] [Google Scholar]
Associated Data
This section collects any data citations, data availability statements, or supplementary materials included in this article.