

Abstract
Magnetic resonance imaging (MRI) is a highly valuable non-invasive imaging tool owing to its exquisite soft tissue contrast, high spatial resolution, lack of ionizing radiation, and wide clinical applicability. Contrast agents (CAs) can be used to further enhance the sensitivity of MRI to obtain information-rich images. Recently, extensive research efforts have been focused on the design and synthesis of high-performance inorganic nanoparticle-based CAs to improve the quality and specificity of MRI. Herein, the basic rules, including the choice of metal ions, effect of electron motion on water relaxation, and involved mechanisms, of CAs for MRI have been elucidated in detail. In particular, various design principles, including size control, surface modification (e.g. organic ligand, silica shell, and inorganic nanolayers), and shape regulation, to impact relaxation of water molecules have been discussed in detail. Comprehensive understanding of how these factors work can guide the engineering of future inorganic nanoparticles with high relaxivity. Finally, we have summarized the currently available strategies and their mechanism for obtaining high-performance CAs and discussed the challenges and future developments of nanoparticulate CAs for clinical translation in MRI.
1. Introduction
Diagnostic imaging techniques to detect lesion information (e.g., type, location, and stage) are currently playing diverse roles in the combat against serious diseases such as cancer.1-3 Among all existing imaging techniques, magnetic resonance imaging (MRI) is a popular choice because of its exquisite soft tissue contrast, high spatial resolution, lack of ionizing radiation, unlimited signal penetration depth, and wide clinical applicability.4 Contrast agents (CAs) can be used to further improve the sensitivity and detection capability of MRI. The use of CAs in MRI has greatly expanded the possible conditions that may be explored, offering physicians unprecedented noninvasive visualization of many ailments.5,6 Most clinically available CAs are chemical agents, traditionally gadolinium (Gd3+) chelates. Generally, these Gd3+ chelates have very short circulation lifetimes in the body, work in a nonspecific manner, and have certain limitations as molecular CAs for long-time tracking. Another disadvantage of clinically used Gd3+ chelates is their relatively low proton relaxation efficiency, which means that high doses are necessary for imaging (e.g., mM concentrations of Gd3+ chelates at target areas).7 However, high-dose injection of Gd3+ chelates may be harmful to the body as it has been reported that the released free Gd3+ ions may cause severe nephrogenic system fibrosis syndrome in vivo.8 Therefore, the imaging performances of clinically available CAs to date have been far from optimal.
Nanoparticles naturally lend themselves to be used as CAs in MRI, where magnetically responsive atoms are essential.9 T1 or spin–lattice contrast may be enhanced through the use of paramagnetic centers such as gadolinium10,11 or manganese ions,12,13 whereas iron oxide-based nanosystems are often used for T2-weighted14-16 or spin–spin imaging. Unlike other molecular imaging agents, these nanoparticles are not directly imaged in the resulting MRI image; in fact, the metal ions perturb the magnetic properties of protons around them, which are the actual target of a traditional MRI scan.6 Among various types of nanoscale imaging agents, inorganic nanoparticle (NP)-based CAs (hereafter, “NPs” refers to inorganic nanoparticles) have received great attention and have been regarded as promising imaging probes. This is due to their unique electronic, magnetic and optical properties at the nanoscale, facile intracellular uptake and accumulation, and excellent in vivo stability.17 The high surface areas of these NPs also greatly enhance their chemical reactivity, allowing for easy surface modification with biological and bioactive materials. These characteristics have caused NPs to emerge as promising candidates for next-generation imaging CAs.18
The contrast behavior of NPs strongly depends on their perturbation of magnetic properties of nearby protons, which can be tuned through a series of factors (e.g., size, surface, and shape) and various innovative approaches or strategies. Great efforts have been made for the rational design and manufacture of NPs with high relaxivity to elevate imaging sensitivity of CAs and even impart MRI with molecular imaging capabilities for better monitoring of biological processes (e.g., tumor microenvironment, cell tracking, and cellular interactions). This has resulted in the wide expansion of this research area, leading to the formation of sub-branches such as ultra-high field MRI,19-21 multi-modal imaging,22-24 and incorporation of theranostic techniques into MRI.25
Both the rational design and engineering of nanoparticulate CAs play important roles in this field, whichmay, inthemeantime, broaden biomedical applications of MRI. However, the complexity of this process is much greater than initially expected, calling for broad expertise in a multidisciplinary manner through chemistry, physics, biology, and engineering. The goal of this review is not to comprehensively summarize nanoparticulate CAs for MRI that have been reported so far,26 as there are many reviews available that list the major types of NPs as CAs (Gd3+-based T1 CAs,11,27 magnetic T2 CAs,14,15,28-30 and dual- T1/T2 CAs9,31) or summarize a special application of CAs (e.g., bioresponsive CAs,32-34 and multimodal CAs24). Instead, this review intends to comprehensively discuss the main rules and mechanisms of nanoparticulate CAs, key factors influencing the relaxation of CAs, and innovative strategies to engineer CAs with high relaxivity. As the Chinese aphorism goes, “It is better to teach a man to fish than to give him a fish,” we hope that this timely and comprehensive review can familiarize readers with the general principles of designing high-performance CAs, stimulate extensive further studies, and attract extensive attention from researchers worldwide.
2. Basic rules for MRI contrast agents
Since the mechanisms of MRI have been thoroughly described elsewhere,11,29 herein, we will focus on the basic rules of CAs for MRI, an in-depth understanding of which is extremely important for formulating design principles of CAs. The contrast enhancement of MRI originates from the interaction between CAs and surrounding water protons, which shorten the longitudinal (T1) or transverse (T2) relaxation time of nearby water molecules. Usually, T1 CAs are applied to increase signal intensity, resulting in a positive contrast enhancement (brighter image) in T1-weighted MRI, whereas T2 CAs can decrease signal intensity, providing a negative contrast enhancement (darker image) in T2-weighted MRI. Relaxivity (ri, i = 1, 2) is therefore used to evaluate the efficacy of CAs, which is defined as the slope of a plot of relaxation rate (1/Ti, i = 1, 2) versus concentration of CAs:
| (1) |
where Ti0 is the relaxation time without CAs and C is the concentration of CAs (mM). The values of r1, r2, and r2/r1 are typically used to evaluate MRI efficiency of nanoparticulate CAs. The transition metal ions (Mn2+, Fe2+/Fe3+, Co2+, and Cu2+) and lanthanide metal ions (Eu3+, Gd3+, Ho3+, and Dy3+) are the major candidate relaxation centers that can be utilized to construct NPs with proper chemical compositions for enhanced contrast in MRI. The choice of a metal ion requires consideration of its electron motion, nanostructure-dependent effects, and involved relaxation mechanism to obtain high-relaxivity CAs.
2.1 Choice of ions
The selection of appropriate ions to construct nanoparticulate agents should obey certain rules. Inherently, one metal ion includes both the electron orbital motion and electron spin motion. The fast electron orbital motion is significantly higher than the speed of water proton relaxation, while the electron spin motion is slower and can be closely in tune with the slow water proton relaxation. Only the electron spinmagneticmoment of ions can efficiently influence the longitudinal water proton relaxation (r1). Therefore, r1 will be higher if the total electron angular momentum (J) contains a larger contribution from electron spin angular momentum (S) of adjacent ions. On the other hand, it will be small if J consists only of electron orbital angular momentum (L).35 Table 1 summarizes the outer orbital, quantum parameters (S, L, and J) and effectivemagnetic moment (μeff) of candidate metal ions for MRI, from which we can determine suitable ions for chemical composition of CAs. For example, since Gd3+ has seven unpaired electrons and its J (J = 7/2) value is completely derived from S (S = 7/2, L = 0), inorganic Gd3+-based NPs (e.g., Gd2O3, NaGdF4, GdF3) have been widely explored as T1 CAs.36-49 Notably, Mn2+ plays a highly important role in biological processes as a cofactor of enzymes and through neurotransmitter release control; moreover, Mn2+ has five unpaired electrons (J = 5/2, S = 5/2, L = 0), showing prominent contrast effects that have been shown to enable visualization of brain anatomic structure and its neuronal activity.50 Therefore, Mn2+-based NPs constitute a new imaging category and are promising candidates as T1 CAs.51-69
Table 1.
Outer orbital and quantum parameters of metal ions
| Ion | Orbital | S | L | J | (μeff μB) |
|---|---|---|---|---|---|
| Mn2+ | 3d5 | 5/2 | 0 | 5/2 | 5.92 |
| Mn4+ | 3d3 | 3/2 | 3 | 9/2 | 3.87 |
| Fe2+ | 3d6 | 2 | 2 | 4 | 4.90 |
| Fe3+ | 3d5 | 5/2 | 0 | 5/2 | 5.92 |
| Co2+ | 3d7 | 3/2 | 3 | 9/2 | 3.87 |
| Co3+ | 3d6 | 2 | 2 | 4 | 4.90 |
| Cu2+ | 3d9 | 1/2 | 2 | 5/2 | 1.73 |
| Eu2+ | 4f7 | 7/2 | 0 | 7/2 | 7.94 |
| Eu3+ | 4f6 | 3 | 3 | 0 | — |
| Gd3+ | 4f7 | 7/2 | 0 | 7/2 | 7.94 |
| Dy3+ | 4f9 | 5/2 | 5 | 15/2 | 10.65 |
| Ho3+ | 4f10 | 2 | 6 | 8 | 10.61 |
The r2 of a CA is largely proportional to the square of μeff of the ion, as T2 CAs show reduced signal dependence on induced magnetic moment of these CAs.70 Among all lanthanide ions, Dy3+ (together with Ho3+) has the highest effective magnetic moment (μeff = 10.6 μB) and much attention has been paid to synthesizing Dy3+- or Ho3+-based NPs as T2 CAs,70-72 especially for ultra-high field imaging.19-21,73 Studies of d-glucuronic acid-coated ultra-small Ln2O3 NPs (Ln = Eu, Gd, Dy, Ho, or Er) show that Gd2O3 NPs exhibit the highest r1 value, whereas Dy2O3 NPs possess the highest r2 value among all studied NPs.74 Unlike the lanthanides, iron is one of the most abundant metal elements in living organisms and deeply involved in various biological processes including cellular respiration by redox enzymes and oxygen transport by hemoglobin.75 Magnetic iron oxide NPs (e.g., Fe3O4, γ-Fe2O3, Fe@Fe3O4, MnFe2O4, etc.) are therefore very popular T2 CAs that can produce negative imaging contrast.29,30,76-84 The magnetization of paramagnetic NPs, such as Gd-based NPs and Mn-based NPs, directly depends on the total number of metal ions, and no magnetization is present in the absence of an external magnetic field. However, magnetic iron oxide NPs exhibit strong intrinsic magnetization, which may cause microscopic field inhomogeneity and accelerate the dephasing of protons for MRI contrast enhancement when an external magnetic field is applied.
In addition to relaxation impact from ion species, the ion valency also affects relaxation interaction between ions and water protons. Variable valencies (e.g., Mn4+/Mn2+ ions,54 Co3+/Co2+ ions,85 Eu3+/Eu2+ ions86) can endow these ions with tunable MRI performance under certain reducing or oxidative microenvironments, thus creating responsive MRI CAs for molecular imaging.32 Mn4+-based NPs are widely used as pH or redoxresponsive MRI CAs because Mn4+ (J = 9/2, S = 3/2, L = 3) with negligible relaxation interactions can be easily reduced to Mn2+ (J = 5/2, S = 5/2, L = 0), which shows high MRI contrast capability according to the rules mentioned above. Overall, understanding the basic principles of NPs such as ion species, ion valency, and magnetic properties will facilitate the engineering of nanoparticulate CAs with excellent MRI performance for various applications.
2.2 Mechanisms of contrast enhancement
The relaxation enhancement of water protons near a paramagnetic center generally follows the inner sphere, secondary sphere, and outer sphere mechanism (Fig. 1).87 The water molecules directly coordinated to the paramagnetic center are responsible for inner sphere relaxation contribution, while bulk water molecules in the nearby environment affect outer sphere relaxation. In some cases, water molecules that are hydrogen bonded to chelators are regarded as the secondary sphere. The contrast enhancement of individual CAs closely depends on their chemical composition, structure, and surfacemodification.
Fig. 1.

Inner sphere, secondary sphere, and outer sphere can influence relaxation rates of MRI CAs.
For T1 CAs, on the basis of the classical Solomon–Bloembergen–Morgan (SBM) theory,35,87,88 common strategies for enhancing relaxivity mainly include increasing the number of bound water molecules (q), enhancing rotational correlation time (τR), and optimizing water residence time (τM). Higher τR values imply slower molecular tumbling and lead to increased proton relaxivity. τM is the inverse of water exchange rate in the inner sphere (kex = 1/τM), which is favorable for proton relaxivity in the case of fast water exchange (high kex). The relationship between τR and τM can be described by the following equation:89
| (2) |
where τc is the correlation time parameter and Tie (i = 1, 2) is the electronic relaxation time. Since it is challenging to predict and experimentally alter Tie, approaches to obtain highly efficient CAs commonly focus on the regulation of τR and τM.37 By immobilizing Gd3+ on the surface or lattice of NPs, prolonging τR will result in significantly enhanced r1, which is a commonly used strategy because these nanoparticulate CAs can couple the tumbling rate of Gd3+ chelates to that of much larger species (e.g., titanium, gold, and silica NPs).90-98 Another widely used approach to enhance r1 is the optimization of τM,99,100 which is readily accessible because nanoparticulate CAs inherently have relatively slow tumbling rates.
Different from T1 CAs that influence the relaxation of water proton through direct energy exchange between water and paramagnetic ions,101 magnetized NPs can induce increased T2 relaxivity, which reduces phase coherence of water molecules in an inhomogeneous magnetic field generated by magnetized NPs.102-104 Based on the quantum mechanical outer sphere theory, T2 relaxivity is given by eqn (3)105
| (3) |
where r and Ms are the effective radius of magnetic NPs and saturation magnetization, respectively, γ is the proton gyromagnetic ratio, V* is the volume fraction, D is the diffusivity of water molecules, and L is the thickness of an impermeable surface shell on the magnetic core. It should be noted that Ms value of a magnetic NP can be tuned by its high surface area, where the interior spins of magnetic NPs are usually aligned, while the spins of surface atoms are magnetically disordered. This is known as the spin canting effect, which is non-negligible because NPs have a large surface-to-volume ratio.29 According to eqn (3), T2 relaxivity of magnetic NPs is highly dependent on effective radius of the magnetic core, Ms, and thickness of an impermeable surface.
3. Factors influencing relaxivity of MRI contrast agents
Recently, great advances in nanotechnology have stimulated the quick development of nanoparticulate CAs, which have two main traits of interest: the dominant quantum confinement effect and the large surface area. Size-dependent magnetic, electronic, and optical properties originating from dominant quantum confinement effects can be utilized in the rational design of high-performance MRI CAs at the nanoscale. Moreover, the large surface area of NPs offers increased chemical reactivity for surface modification with additional functional species, enabling enhanced magnetic relaxivity and higher-quality MRI with reasonable detection limits. Typically, three techniques are applied for obtaining high-relaxivity CAs at the nanoscale: size control, surface modification, and shape regulation (Fig. 2).
Fig. 2.

Factors influencing relaxation of MRI CAs: size, surface, and shape effects at the nanoscale.
3.1 Size effects
Inorganic NPs present a unique size-dependent effect on physical properties including surface plasmon resonance of metal nanoparticles,106,107 fluorescence emission of semiconductor NPs,108 and superparamagnetism or heating of magnetic NPs.109,110 By controlling nucleation and growth, the size of NPs can be well controlled. The dependence of cellular uptake, biodistribution, and clearance rate on NP size has been widely investigated by many groups.111-115 To date, several types of CAs have been developed for various applications in MRI, which can be classified according to their chemical composition (Gd-, Mn-, Fe-, Dy- or Ho-based CAs; Table 2). A deep understanding of the involved mechanisms between size effect and proton relaxation will undoubtedly benefit the rational design of T1 or T2 CAs for high-performance MRI. For T1 CAs, smaller-sized NPs usually generate greater contrast enhancement because their surface-to-volume ratio is the dominant contributing factor, which increases as the size of NPs is decreases. However, τR will become much lower for large NPs and plays a dominant role in affecting relaxivity, causing larger NPs to possess higher r1 values. For T2 CAs, larger-sized magnetic NPs usually have higher magnetization than smaller-sized NPs, and therefore, r2 values increase as size increases. However, this trend breaks down when sizes of magnetic NPs become too large.
Table 2.
Representative inorganic nanoparticle size effect on relaxivity
| NPs | Shape | Approximate size (nm) | Surface coating | Relaxivity (mM−1 s−1) | Field (T) | Ref. |
|---|---|---|---|---|---|---|
| NaGdF4 | Sphere | 2.5/4.0/6.5/8.0 | PVP | r1 = 7.2/4.5/3.3/3.0 | 1.5 | 49 |
| NaGdF4 | Sphere | 5/15/20 | PEG | r1 = 6.2/5.7/8.78 | 3.0 | 41 |
| NaGdF4 | Sphere | 2.1/3.2/8.6 | PAA | r1 = 47.3/27.5/15.3 | 0.5 | 36 |
| NaGdF4 | Sphere | 3/4/5 | PEG | r1 = 58.8/39.4/28.6 | 1.4 | 39 |
| Gd3O2 | Sphere | 2.2/3.8/4.6 | SiPEG | r1 = 8.8/8.8/4.4 | 7.0 | 45 |
| Gd3O2 | Sphere | 4.4/5.4/10.1 | Albumin | r1 = 18.49/16.22/12.26 | 1.5 | 129 |
| MnO | Irregular | 7/15/20/25 | PEG | r1 = 0.37/0.18/0.13/0.12 | 3.0 | 69 |
| Mn2O3 | Sphere | 3/5/11/13 | PEG | r1 = 2.38/1.39/0.99/0.41 | 1.5 | 132 |
| Mn2O3 | Tetrahedron | 6/8/20 | PEG | r1 = 1.08/0.63/0.25 | 1.5 | 132 |
| Fe2O3 | Sphere | 2.2/3/12 | PEG | r1 = 4.78/4.77/2.37 | 1.5 | 135 |
| MnFe2O4 | Sphere | 2/3/3.9 | PEG | r1 = 8.43/8.23/6.98 | 3.0 | 136 |
| Fe3O4 | Sphere | 4/6/9/12 | DMSA | r2 = 78/106/130/218 | 1.5 | 79 |
| Fe3O4 | Octapod | 20/30 | HDA-G2 | r2 = 679/209 | 7.0 | 137 |
| Fe3O4 | Sphere | 8/23/37/65 | PVP | r2 = 173/204/240/249 | 7.0 | 138 |
| Fe3O4 | Rod | 30a/40/50/60/70 | PEI | r2 = 312/381/427/545/608 | 3.0 | 80 |
| MnFe2O4 | Sphere | 6/9/12 | DMSA | r2 = 208/265/358 | 1.5 | 84 |
| NaDyF4 | Sphere | 5.4/9.8/20.3 | PEG | r2 = 32/51/101 | 9.4 | 19 |
| NaDyF4 | Rod | 19a/20/25/35 | PEG | r2 = 75/65.2/91.4/204.4 | 9.4 | 20 |
| NaHoF4 | Sphere | 10.6/14.1/16.4 | PEG | r2 = 31.9/51.5/70.4 | 9.4 | 20 |
| NaHoF4 | Sphere | 3.2/7.4/13.2 | PEG | r2 = 83.4/45.4/131.7 | 7.0 | 21 |
Length of nanorods.
3.1.1 Gd-based contrast agents
The recently developed Gd3+-based NPs such as Gd2O3-,43-45,116 NaGdF4-,36,38-41 GdF3-,46,117,118 and Gd3+-doped NPs (e.g., quantum dots,119-123 upconversion NPs,124-126 and carbon dots127,128) have been regarded as promising T1 CAs because of their controllable size and morphology. By optimizing the reaction parameters during both nucleation and growth, Johnson et al. synthesized size-tunable ultra-small NaGdF4 NPs with uniform sizes of around 2.5 nm, 4 nm, 6.5 nm, and 8 nm (Fig. 3a) and found that the r1 value increased dramatically with decreasing size from 3.0 mM−1 s−1 for 8.0 nm NPs to 7.2 mM−1 s−1 for the smallest 2.5 nm ones (Fig. 3b).49 Correlations of NPs’ sizes and their r1 values showed that contributions from the surface-tovolume ratio increased with decreasing NP size, becoming the dominant contributing factor. Several other research groups also reported similar size effects of NaGdF4 NPs on relaxivity.36,39 However, τR became much lower for larger NaGdF4 NPs (>15 nm) and played a dominant role in affecting r1 value, as demonstrated by Gao and co-workers, who found r1 values of 5.7 mM−1 s−1 for 15 nm NaGdF4 NPs, which increased to 8.78 mM−1 s−1 for 20 nm ones (Fig. 3c).41 Inspired by this, we recently synthesized ultra-small sized and renal-clearable NaGdF4 nanodots (~2 nm) with high r1 values of 8.93mM−1 s−1.40 These nanodots exhibited excellent magnetic resonance angiography (MRA) performance, as the vascular signal was much stronger than that achieved using clinical MRI CAs (Fig. 3d). With the new CAs, even capillary vessels and atherosclerotic plaques could be clearly delineated (Fig. 3e).
Fig. 3.

(a) TEM images of oleate-stabilized NaGdF4 NPs of varied particle sizes (scale bar is the same for all images). (b) Plots of 1/T1 versus Gd3+ concentration for varied NaGdF4 NPs in water (1.5 T). Reproduced with permission from ref. 49. Copyright 2011, American Chemical Society. (c) R1 relaxivity of aqueous solutions containing NaGdF4 NPs of different sizes or Gd–DTPA with different concentrations of Gd3+. Reproduced with permission from ref. 41. Copyright 2013, American Chemical Society. (d) Magnetic resonance angiography of rabbits within 3 min after injection of ultra-small NaGdF4 nanodots or Magnevist. AA: abdominal aorta; IVC: inferior vena cava. (e) Transverse cross-sectional images of rabbit atherosclerotic plaques before and after injection of ultra-small NaGdF4 nanodots or Magnevist at the same dosage (13 mg Gd per kg). Reproduced with permission from ref. 40. Copyright 2014, Wiley-VCH.
The same trends were also observed for ultra-small Gd2O3 NPs,45,129 such that r1 values increased from 4.4 mM−1 s−1 (4.6 nm Gd2O3) to 8.8 mM−1 s−1 (2.2 nm Gd2O3).45 Based on the fitting of Gaussian, Lorentzian, and log-normal functions, Lee et al. concluded that the optimal range of diameters for high-relaxivity Gd2O3 NPs should be 1–2.5 nm with a theoretical maximum r1 value of 10.1–10.6 mM−1 s−1.48 In that study, they reported a large r1 value of 9.9 mM−1 s−1 of ultra-small Gd2O3 NPs coated with d-glucuronic acid. Consistent with ultra-small NaGdF4 NPs, such a large r1 value of ultra-small Gd2O3 NPs was attributed to the large surface-to-volume ratio, as well as the cooperative induction of surface Gd3+ ions for longitudinal relaxation. It is generally accepted that the r1 value should be as large as possible, and for high-performance T1 MRI CAs, the r2/r1 ratio should be close to unity, while a greater value of r2/r1 will generally result in higher contrast enhancement efficiency for T2 MRI CAs.9 The r2/r1 ratio of ultra-small Gd2O3 NPs was estimated to be 1.06 (r1 = 9.9 mM−1 s−1, r2 = 10.5 mM−1 s−1), which seemed to satisfy this condition.
Biologically, these ultra-small sized agents can escape from recognition and can be capture by the liver and then be rapidly cleared through the kidneys, in which the basal lamina has pores of approximately 10 nm to filter metabolites (e.g., ultrasmall sized NPs) from the bloodstream.38,48,130 Such rapid renal clearance diminishes in vivo toxicity of NPs owing to the suppressed tissue accumulation and certainly facilitates their future clinical translation and application. In addition, ultrasmall Gd3+-based NPs can be integrated with additional components such as multifunctional nanoplatforms for non-targeted blood pool imaging,40 targeted molecular imaging,41 pH/H2O2- responsive MRI,131 and brain tumor diagnosis and image-guided therapy.130
3.1.2 Mn-based contrast agents
As another major class of T1 CAs, Mn-based NPs (e.g., MnO NPs, Mn3O4 NPs, and MnO2 nanosheets) have gained extensive interest as GSH- or pHresponsive MRI CAs due to their readily changeable valency and easy release of manganese under acidic conditions.54,55,63,133 The size-dependent magnetic properties of MnO and Mn3O4 NPs with monodispersed sizes in the range of 6–22 nm were initially reported by Seo et al.134 Subsequently, the size-dependent T1 relaxation properties of MnO NPs were investigated by Hyeon and co-workers,69 demonstrating higher T1 signal enhancement for smaller MnO NPs than larger ones (Fig. 4a and b). The interaction between proton spins and surface Mn2+ ions on NPs is regarded as the main dipolar interaction responsible for their relaxation properties. Clear T1-weighted MR images of the brain, liver, kidney, and spinal cord with a fine anatomical structure were obtained after administration of MnO NPs. Since MnO NPs spontaneously get oxidized to Mn3O4 NPs in air,68 An et al. reported measurements of T1 and T2 relaxation of spherical and tetrahedral Mn3O4 NPs with varied uniform sizes.132 In agreement with the previous results, the r1 value increased as the size of Mn3O4 NPs decreased for both spherical (Fig. 4c) and tetrahedral NPs (Fig. 4d), and 3 nm-sized spherical NPs exhibited the highest r1 value of 2.38 mM−1 s−1, again indicating that higher surface-to-volume ratios lead to higher relaxivity of ultrasmall NPs.
Fig. 4.

(a) TEM images of MnO NPs of varied sizes (7, 15, 20, and 25 nm) in water. (b) T1-weighted MR image of MnO NPs in a 3.0 T clinical MRI system. Reproduced with permission from ref. 69. Copyright 2007, Wiley-VCH. Size-dependent T1-weighted MR images and relaxivities of water-dispersible spherical (c) and tetrahedral (d) Mn3O4 NPs at varied Mn2+ concentrations. (e) The r1 and r2 values and r2/r1 ratios of Mn3O4 MPs from c and d. Reproduced with permission from ref. 132. Copyright 2012, Wiley-VCH.
To further increase surface-to-volume ratio, Mn-based NPs were etched into hollow structures by selectively removing the core MnO phase from the Mn3O4 shell phase, thus exposing more active Mn2+ ions to water protons.68 As a result, the hollow nanostructure with a larger water-accessible surface area possessed a much higher r1 value of 1.42 mM−1 s−1 compared to the solid ones (r1 = 0.21 mM−1 s−1) at 3.0 T. Such hollow structures could be used as a drug delivery system with marked MRI contrast enhancement for the monitoring of drug release.139,140
3.1.3 Fe-based contrast agents
Iron oxide NPs are generally regarded to be safer than Gd- or Mn-based CAs because iron is essential in the human body, mostly stored as ferritin in the blood. Fe3+ has 5 unpaired electrons (J = 5/2, S = 5/2, L = 0), the same as Mn2+, making Fe3+ a promising candidate for T1 CAs.136,141-143 Small-sized iron oxide NPs show enhanced T1 contrast effects due to the existence of a large number of Fe3+ ions on the surface, suppressing T2 relaxation by their small magnetic moment. The magnetic properties and r1 values of various small-sized iron oxide NPs from 1.5 to 12 nm have been investigated (Fig. 5a).135 By canting the most surface spins (around 93.6%), 2.2 nm-sized iron oxide NPs with low magnetic moments exhibited a relatively high r1 value of 4.78 mM−1 s−1, while the r1 values of 12 nm NPs (nearly 38.6% of spins were canted, Fig. 5b) decreased to 2.37 mM−1 s−1 (Fig. 5c). This phenomenon was further verified in cellular studies, in which significant T1 signal enhancement for 3 nm-sized NPs and attenuated T1 signal for cells incubated with 12 nm-sized iron oxide NPs were found (Fig. 5d). Another study from Zhang et al. also indicated similar size-dependences of r1 values based on ultra-small MnFe2O4 NPs.136 Recently, exceedingly small iron oxide NPs with a hydrodynamic size of 4.7 nm, consisting of approximately 3 nm inorganic cores and about 1 nm organic hydrophilic shell, were reported to have high T1 relaxivity (r1 = 5.2 mM−1 s−1 at 1.5 T).142 Excreted mostly within the first 2.5 h through the urine, the exceedingly small iron oxide NPs have been successfully applied for high-performance magnetic resonance angiography (MRA) imaging (Fig. 5e and f). Strong positive contrast from both the heart and blood vessels has been found, which decreased over time, while the signal from the bladder increased, indicating renal clearance.
Fig. 5.

(a) Field-dependent magnetization curves at 300 K for iron oxide NPs of varied sizes. (b) Description of spin canting effect (canting layer = 0.9 nm) in iron oxide NPs of varied sizes. Red and black colors represent magnetic cores and magnetically disordered shells. (c) Plots of 1/T1 over concentration of iron oxide NPs of 3 nm and 12 nm diameter. (d) T1-weighted MR images of MCF-7 cell pellets after 24 h incubation with iron oxide NPs of 3 nm and 12 nm in diameters. Reproduced with permission from ref. 135. Copyright 2011, American Chemical Society. (e) T1-weighted magnetic resonance angiography (MRA) of a mouse injected with ultra-small iron oxide NPs at 7 T. (f) Five different perspectives of MRA images, which were extracted from a 3D scan, at 4 minutes post-injection. Reproduced with permission from ref. 142. Copyright 2017, National Academy of Sciences.
Importantly, iron oxide NPs are also widely used as T2 CAs, where the magnetic moment of these NPs decreases rapidly as the size decreases due to reduced magnetic anisotropy and spin disordering on the surface of NPs.30,144 The size-dependence of T2 contrast has been extensively investigated both theoretically and experimentally. Theoretically, two different regimes are predicted. The first is called the “motional averaging regime” (MAR) that describes T2 relaxation for relatively small iron oxide NPs,104 where water diffusion near NPs occurs on a much faster timescale than the resonance frequency shift, resulting in increased r2 values with increasing NP size. However, this theory breaks down for larger NPs because the induced surrounding perturbing field around larger NPs is much stronger, and proton diffusion becomes a nondominant factor for signal decay. Therefore, the relaxation rate is independent of diffusion and does not significantly increase with further increase in size of NPs. This process is termed the “static dephasing regime” (SDR), first introduced by Yablonskiy and Haacke.145 Importantly, this tendency has been validated on NPs of varied sizes synthesized by many different groups.
Generally, small iron oxide NPs synthesized by various research groups are in the MAR, where larger NPs possess higher magnetization and therefore larger r2 values. For example, such size effects on T2 contrast have been reported by Cheon and co-workers,79 using small and size-controlled Fe3O4 NPs (Fig. 6a), where the variation of NPs size from 4 to 6, 9, and 12 nm resulted in r2 values of 78, 106, 130, and 218 mM−1 s−1, respectively (Fig. 6b–d). Similar size effect on relaxation rates has also been reported by many other research groups.80,83,105,146-149 Importantly, this size effect is a universal phenomenon, which is not limited to spherical NPs. For example, octapod iron oxide NPs with average edge lengths of 30 nm exhibited a large r2 value of 679.25 mM−1 s−1, almost three times higher than that of the NPs of 20 nm in edge lengths.137 However, according to the SDR theory, the r2 value reaches a plateau as the size continues to increase. It has been reported by Chen and co-workers that the size effect became less significant for single iron oxide NPs of 50 nm (Fig. 6e).138 They found that r2 values increased rapidly from 173.37 to 203.86 and 239.98 mM−1 s−1 at 7 T, when the particle size increased from 8 to 23 and 37 nm, respectively (Fig. 6f), but r2 value was only slightly higher at 248.89 mM−1 s−1 for 65 nm-sized iron oxide NPs (Fig. 6g). This SDR theory has also been experimentally verified in cells loaded with iron oxide NPs,150 as well as in an induced clustering process.151
Fig. 6.

(a) TEM images of iron oxide NPs of 4, 6, 9, and 12 nm. (b) Upper panel: Size-dependent T2-weighted MR images of iron oxide NPs in aqueous solution at 1.5 T; lower panel: size-dependent changes from red to blue in color-coded MR images based on T2 values. (c) The magnetization of iron oxide NPs measured by a SQUID magnetometer. (d) Size-dependent r2 values of iron oxide NPs. Reproduced with permission from ref. 79. Copyright 2005, American Chemical Society. (e) Size-dependent T2-weighted MR images of PVP-coated iron oxide NPs in aqueous solution with various concentrations at 7 T. (f) Plots of 1/T2 against Fe concentration of PVP-coated iron oxide NPs. (g) Size-dependent r2 values of iron oxide NPs. Reproduced with permission from ref. 138. Copyright 2010, American Chemical Society.
3.1.4 Dy- or Ho-based contrast agents
Ultra-high field MRI, the future of next-generation MRI scanners, brings not only new opportunities for biomedical research, but also great challenges in developing exogenous CAs, since most currently used CAs are only suitable at relatively lowmagnetic field strengths (e.g., 1.5 T or 3.0 T) but are inefficient at higher magnetic field strengths (e.g., 7.0 T). Dysprosium (Dy3+) and holmium (Ho3+) are promising candidates for imaging in an ultra-high magnetic field due to their relatively short electronic relaxation time (~10−13 s) and large magnetic moment (~10.6 μB).71 The size-dependent properties of NaDyF4 NPs under ultra-high magnetic fields were first reported by van Veggle and co-workers,19 demonstrating that T2 contrast was enhanced with increasing NP size and magnetic field strength (Fig. 7b and c), while r1 value remained almost unchanged (Fig. 7a).
Fig. 7.

(a) r1 and (b) r2 values of NaDyF4 NPs (three different sizes) at 3 and 9.4 T. (c) (i) TEM images of 5.4, 9.8, and 20.3 nm NaDyF4 NPs, (ii) phantom MR images of NPs at 1.0 mM Dy3+ concentration at 9.4 T. Reproduced with permission from ref. 19. Copyright 2012, American Chemical Society. (d) Schematic of the effect of size and a coating layer on the relaxation of NaDyF4 and NaHoF4 NPs. Reproduced with permission from ref. 20. Copyright 2016, American Chemical Society. (e) T2-weighted MR images of NaHoF4 NPs of varied sizes in aqueous solutions at 7.0 T. (f) r2 values obtained for varied sized NaHoF4 NPs at 1.5 T, 3.0 T, and 7.0 T. (g) Simulated curves of B2φ from Curie contribution versus diffusion correlation time (τD), which is related to NP size. Reproduced with permission from ref. 21. Copyright 2016, Elsevier Ltd.
In a follow-up study, van Veggle and co-workers investigated in detail the involved relaxation mechanisms of NaDyF4 and NaHoF4 NPs in the range of 9–40 nm based on the outer sphere theory (Fig. 7d).20 The larger particle had a larger volume fraction, and a three-fold increase in core size resulted in r2 values that were 30 times larger. Further theoretical simulation results showed that Curie contribution became predominant under an increasing magnetic field. Recently, we have reported the size effect of NaHoF4 NPs on magnetic relaxation (Fig. 7e).21 Both experimental and theoretical findings revealed that Curie contribution to contrast enhancement was the principal mechanism when particle size was smaller than 7 nm (Fig. 7f and g), as the φ(τD) value from Curie relaxation remarkably decreased with increasing diffusion correlation time (τD) from 1 ns (3 nm NaHoF4) to 5 ns (7 nm NaHoF4). The φ(τD) value then slightly decreased as τD became larger, explaining the opposite change of r2 values that was observed when NP size was less than 7.4 nm. As the size of NPs increased to 13 nm and 29 nm, the contribution of dipolar mechanism could not be neglected, and all relevant mechanisms mentioned above contributed to MRI contrast enhancement.
3.2 Surface effects
Apart from the size effect on MRI relaxation, surface properties of NPs also play an important role in MRI contrast enhancement based on interaction between NPs and water molecules, which happens primarily on the surface of NPs. Individual contributions from the inner sphere, secondary sphere, and outer sphere depends on the CA’s structure and composition, which can be regulated by surface modifications of tuned composition and thicknesses. Most NPs developed for in vivo MRI applications could be stabilized and functionalized with coating materials such as organic surface ligands, dense or mesoporous silica shells, or an inorganic nanolayer (e.g., FexOy or NaGdF4 layers). These modifications, here termed surface effects, can in turn impact the relaxation of water protons in various configurations, such as hydration, hydrogen binding, and diffusion. For T1 CAs, surface effects can enhance proximity of water to center paramagnetic ions by tuning the distance of water protons to the NP surface, generating greater contrast than small-molecule CAs alone. Such a process depends on the species, chain length, density, and functional group of organic ligands, as well as the thickness of silica shells or inorganic nanolayers. For T2 CAs, proper surface modification of magnetic NPs will impact intrinsic surface spin disordering, increase inhomogeneity in the local magnetic field, or induce much stronger magnetization, leading to improvement in T2 contrast effects.
3.2.1 Organic surface ligands
Organic surface ligands are critical for the synthesis of NPs, not only for controllable growth during synthesis but also for ensuring their biocompatibility for in vivo application. An early study by Lee et al. suggested that different types of organic surface moieties greatly impacted T1 contrast enhancement.60 Organic ligands including mercaptosuccinic acid (MSA), poly(maleic anhydride-alt-1-octadecene) (PMAO), PMAO–PEG, and Pluronic PF127 were capped on MnO NPs. The MnO@MSA exhibited the largest r1 values of 2.55 mM−1 s−1 at pH 7.4 and 6.94mM−1 s−1 at pH 5.0 among all the coatings, indicating that r1 relaxivity of the NPs depended on the surface ligands.
Furthermore, the addition of polyethylene glycol (PEG) to the surface (i.e., PEGylation) of NPs has been widely applied to improve biocompatibility of NPs, prolong in vivo circulation, and reduce the capture by the reticuloendothelial system (RES).152-155 Recently, Johnson et al. reported a compact micellization strategy that could achieve ultra-high r1 values (around 80 mM−1 s−1 at 1.4 T), about 25 times higher than that of clinically used Gd3+ chelates, by regulating the surface ligands (Fig. 8a–c).39 The compactly packed PEGylated lipids would bring the water protons closer to the surface of NaGdF4 NPs and thus lead to enhanced relaxivity. They also found that the relaxivity was independent of outer PEG chain length (Fig. 8d and e), whereas increasing the inner core NaGdF4 size resulted in lowered relaxivity values (Fig. 8f and g). Two important criteria to achieve ultra-high relaxivity with Gd3+-based NPs were proposed: (i) extremely small core NPs (<5 nm) and (ii) surface coating strategies that can render compact and individually stabilized NPs in water.
Fig. 8.

(a) A TEM image of ultra-small oleate-stabilized NaGdF4 NPs of 3 nm diameter. (b) A representative negative-stained TEM image of DSPE– PEG-coated NP micelles. Inset: Schematic of a NaGdF4 NP confined within a DSPE–PEG micelle. (c) r1 values of a clinical MRI contrast agent (Dotarem) and the compact NP micelles at low (1.41 T) and high (7 T) fields. (d) Schematic and (e) r1 values of NaGdF4 NPs (3 nm) confined within DSPE–PEG micelles with varied PEG chain length. (f) Schematic and (g) r1 values of NaGdF4 NPs confined within DSPE–PEG micelles with variable core NP size (3–5 nm). Reproduced with permission from ref. 39. Copyright 2016, American Chemical Society. (h) r1 and r2 values of NaGdF4 NPs coated with different ligands measured at 0.5 T. (i) Schematic of the strong hydrogen-bonding capacity of PAA to water molecules to improve r1. Reproduced with permission from ref. 36. Copyright 2017, American Chemical Society.
After surface PEGylation of ultra-small NaGdF4 nanodots, our group further conjugated DTPA on the surface of NPs to capture potentially released Gd3+ ions, effectively preventing their liberation.40 The Gd3+ ions captured by DTPA could directly interact with water protons to further enhance relaxivity. Recently, Yan and co-workers presented another simple strategy to improve r1 values by taking advantage of surface ligands’ strong interaction with water protons.36 NaGdF4 NPs coated with poly(acrylic acid) (PAA) exhibited largely enhanced r1 values compared to those coated by polyethylenimine (PEI) or PEG (Fig. 8h), which resulted from the strong hydrogen-bonding capacity of PAA to water molecules according to their theoretical calculation (Fig. 8i).
By rationally designing the functional group of surface ligands, the transverse r2 value can also be regulated for iron oxide NPs. Zeng et al. reported the surface modification of PEG2000 ligands with three different functional groups: diphosphate (DP-PEG), hydroxamate (HX-PEG), and catechol (CC-PEG) on 3.6 nm and 10.9 nm Fe3O4 NPs (Fig. 9a).149 The r2 values increased with increasing sizes for all three ligand-modified Fe3O4 NPs, and the HX- or CC-PEG modified NPs showed much higher r2 values than the unconjugated functional group of DP-PEG for both sized Fe3O4 NPs (Fig. 9b), while the r1 value only changed slightly with different anchored groups and NP sizes (Fig. 9c). The π–π conjugation and p–π conjugation from the CC and HX groups were believed to create increased inhomogeneity in the local magnetic field around the underlying Fe3O4 NPs when compared to the unconjugated DP group (which has no π–π or p–π conjugation), which effectively accelerated transverse relaxation of the water protons nearby.
Fig. 9.

(a) Left panel: Chemical structures of PEGs used for exchanging the hydrophobic ligands of 3.6 nm(S: small) and 10.9 nm(L: large) iron oxide NPs; right panel: TEM images of resulting PEGylated NPs (scale bars: 50 nm); insets: photographs of aqueous solutions of PEGylated NPs at an equal Fe concentration of 20 mM. Comparison of (b) r2 and (c) r1 values of different kinds of PEGylated NPs. Reproduced with permission from ref. 149. Copyright 2014, Wiley-VCH. (d) Left panel: Schematic of three transfer approaches: ligand exchange of oleic acid with a water-soluble polymer (top), coating of individual NPs with the amphiphilic polymer (middle), and embedding into lipid micelles (bottom). Reproduced with permission from ref. 147. Copyright 2007, American Chemical Society. (e) Schematic of a nanoparticle with 4.8 nm iron oxide core and DSPE-PEG1000 coating. (f) T2 relaxivity of iron oxide NPs at a constant iron concentration. (g) T2 relaxivity of NPs on a per-particle basis. Iron oxide NPs with two core sizes, 5 and 14 nm, and five PEG sizes, 550, 750, 1000, 2000, and 5000 Da, were evaluated. Reproduced with permission from ref. 105. Copyright 2010, American Chemical Society.
Besides the surface groups, the ligand species and the methods of modification also affect T2 contrast enhancement. The species effects of surface ligands on magnetic properties were verified by Duan et al. by coating ultra-small Fe3O4 NPs with different levels of hydrophilic ligands including hyperbranched PEI, PEG grafted PEI (PEG-g-PEI), and poly(maleic acid)-octadecene (PMO).148 The hydrophilicity of surface ligands was found to greatly impact the intrinsic surface spin disordering of NPs for water proton relaxation, where the most hydrophilic PEI coated Fe3O4 NPs showed the highest r2 value, nearly three times higher than that of the least hydrophilic PMO-coated NPs. Among different methods for surface modification of MnFe2O4 NPs such as ligand exchange, encapsulation with polymer shells, and embedding them into micelles (Fig. 9d), embedding NPs into lipid micelles was found to be the most efficient method for greatly enhancing r2 relaxation.147 The larger-sized core inside lipid micelles and the contribution from dephasing of proton spins of the lipid molecules due to high viscosity of these molecules were considered to be responsible for this phenomenon.
The accessibility of water molecules to the magnetic core of NPs depends on the thickness of surface ligands, which can influence T2 relaxation of NPs. Tromsdorf et al. found that increasing PEG chain length from PEG350 to PEG550 on the surface of Fe3O4 NPs led to decreased r2 and almost unchanged r1 values due to aggregation of NPs.141 However, slight changes were found for both r1 and r2 values when PEG chain length was increased from 550 to 2000. Another report by Tong et al. indicated that Fe3O4 NPs had a critical PEG ligand size, at which the r2 value changed dramatically.105 The coating thickness could be well controlled by varying the size of DSPE–PEG from 500 Da to 5000 Da (Fig. 9e). Interestingly, the r2 value of 14 nm Fe3O4 NPs increased by 2.5-fold when PEG molecular weight decreased from5000 to 1000 Da (Fig. 9f). It was suggested that 14 nm iron oxide NPs and PEG1000 surface modification was the optimal combination of core size and coating thickness according to T2 relaxivity on a per-particle basis (Fig. 9g). However, r2 values did not increase further when PEG size decreased to 750 and 550 Da. Such effects of PEG chain length on T2 relaxivity can be partly attributed to changes in the shell/core ratio, i.e., L/r in eqn (3), under the assumption that the coating was water impermeable.
3.2.2 Surface silica coatings
The growth of a dense or mesoporous silica shell on the surface of MRI CAs has been a commonly used strategy since silica exhibits excellent biocompatibility, and the active surface or pore volume of the shells can be used for conjugating or loading biological molecules, functional particles, and therapeutic agents.156-158 Our group extensively investigated the effect of both dense (dSiO2) and mesoporous (mSiO2) silica shells and their thickness on the MRI relaxation of Gd3+-based upconversion nanoparticles (UCNPs) (Fig. 10a).159 The thicknesses of dSiO2 and mSiO2 shell could be well controlled and uniformly coated on each particle (Fig. 10b and c). It was found that both r1 and r2 values were independent of thickness of mSiO2 shell, the thickness of which could be readily controlled from 11.1 nm to 23.4 nm. The dominant outer sphere mechanism determined by the translational diffusion of water molecules was thought to be responsible for this phenomenon, and the diffusion of water molecules in the mesoporous channels was not affected by the increased thickness of the mSiO2 shell (Fig. 10d). However, the diffusion of water molecules in the dSiO2 shell, in which large pore channels did not exist, became much more restricted by thicker dSiO2 shells, leading to longer translational diffusion time and thus larger r1 and r2 values. Therefore, the r1 value of UCNPs@dSiO2 increased from4.03mM−1 s−1 to 9.7mM−1 s−1 as the thickness of dSiO2 shell increased from 2.6 nm to 16.9 nm, while r2 values almost doubled (from 57.58 mM−1 s−1 to 102.08 mM−1 s−1, Fig. 10e).
Fig. 10.
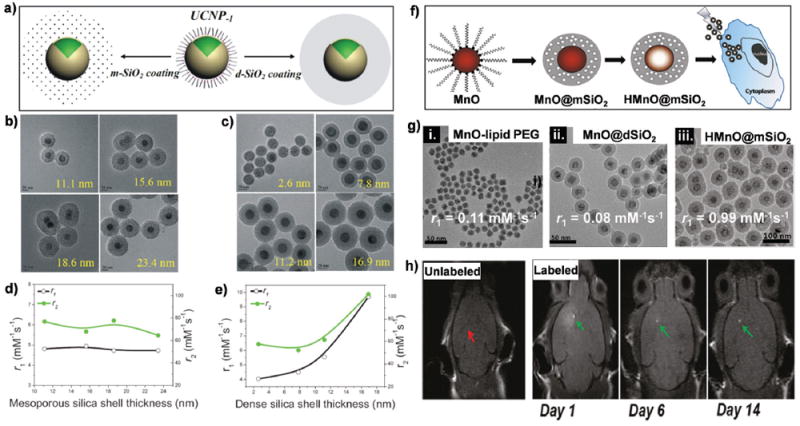
(a) Schematic illustration of coating UCNPs with dSiO2 and mSiO2 shells. (b) TEM images of (b) UCNP@mSiO2 and (c) UCNP@dSiO2 with varied shell thicknesses. Scale bar: 20 nm. (d) The plot of r1 and r2 versus mSiO2 shell thickness. (e) The plot of r1 and r2 versus dSiO2 shell thickness. Reproduced with permission from ref. 159. Copyright 2014, Wiley-VCH. (f) Schematic of the synthesis of HMnO@mSiO2 NPs and labeling of mesenchymal stem cells. HMnO denotes hollow structure manganese oxide NPs. (g) TEM images and r1 value of MnO–lipid PEG, MnO@dSiO2, HMnO@mSiO2 NPs. (h) No MRI contrast enhancement (red arrow) was detected in mice transplanted with unlabeled mesenchymal stem cells into the brain, whereas hyperintense signals (green arrows) were detected in mice transplanted with HMnO@mSiO2-labeled mesenchymal stem cells, which were still visible 14 days after injection in the brain. The scheme and figures (with minor modifications) are licensed under the ACS AuthorChoice license. Reproduced with permission from ref. 62. Copyright 2011, American Chemical Society.
In another study, both mSiO2 and dSiO2 shells were used to coat the surface of MnO NPs.160 With these modifications, the r1 value decreased substantially from 0.17 mM−1 s−1 for MnO NPs to 0.07 mM−1 s−1 for MnO@dSiO2. For MnO@mSiO2 nanostructures, the r1 value was similar to MnO NPs (0.16 mM−1 s−1), which was attributed to the existence of worm-like nanochannels in these NPs, where increased water exchange rates could be achieved. Similar results were also reported by Kim et al., who found that mSiO2-coated MnO NPs showed a much higher r1 value of 0.65 mM−1 s−1 than those of dSiO2-coated NPs (r1 = 0.08mM−1 s−1) and PEGlyated MnO NPs (r1 = 0.11mM−1 s−1). The r1 value could be further increased to 0.99 mM−1 s−1 after acid etching of MnO NPs to generate a hollow nanostructure (i.e., HMnO@mSiO2) (Fig. 10f and g).62 Such a hollow structure allowed more interior Mn2+ ions to interact with water molecules on the inner surface, resulting in a significantly higher r1 value than that of MnO NPs encapsulated with PEG phospholipids. 69 Therefore, intracranial transplantation of HMnO@ mSiO2-labeled mesenchymal stem cells could be monitored by serial MRI over 14 days (Fig. 10h). Among a number of surface modifications strategies of NPs with organic ligands and silica, Lee et al. found that silica-coated MnO exhibited the highest stability at neutral pH and the slowest dissolution rate when dispersed in acetate buffer solutions and showed continuous contrast enhancement in the rat brain.60
3.2.3 Inorganic surface nanolayers
Coating an inorganic nanolayer (e.g., Fe2 O3, Fe3 O4, NaGdF4, and so forth) on the surface of NPs to induce stronger magnetization and ensure adequate exposure to water molecules nearby is an attractive strategy to obtain high-relaxivity T2 or T1 CAs. MR relaxation enhancement effects of γ-Fe2O3 nanolayers were first reported by Xu and co-workers based on core/shell, yolk/shell, or hollow structures (Fig. 11a–d).77 Field-dependent magnetization measurements showed that all these NPs were superparamagnetic (Fig. 11e), and the saturated magnetization (Ms) of the γ-Fe2O3 hollow nanostructure was the highest among these nanostructures (about 50.8 emu g−1). Additionally, both the growth of a 5 nmFexOy layer and self-assembly of ultra-small Fe3O4 on the surface of UCNPs generated much higher r2 values than conventional iron oxide NPs.161,162 Cheong et al. synthesized iron/iron oxide core/shell (Fe@Fe3O4) NPs by oxidizing the surface of iron nanocrystals in the air.163 These core/shell Fe@Fe3O4 NPs had a r2 value of 324 mM−1 s−1, more than twice that of Fe3O4 NPs (145 mM−1 s−1, Fig. 11h and i). Such an increase in r2 value was attributed to the presence of a single-crystal iron core, which can induce much stronger magnetization than Fe3O4 NPs.
Fig. 11.
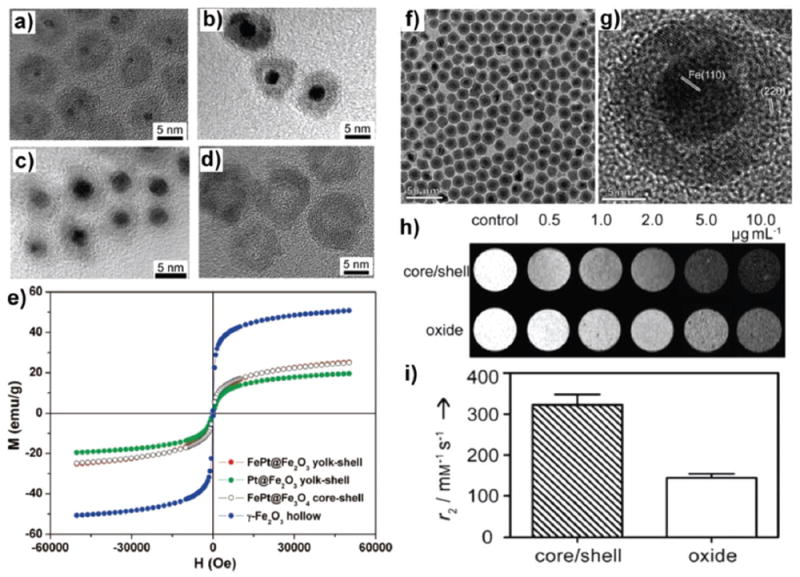
HRTEM images of (a) FePt@Fe2O3 yolk–shell NPs, (b) Pt@Fe2O3 yolk–shell NPs, (c) FePt@Fe3O4 core–shell NPs obtained by the seed-growth method, and (d) γ-Fe2O3 hollow NPs. (e) Room-temperature field-dependent magnetization measurements of different NPs. Reproduced with permission from ref. 77. Copyright 2008, American Chemical Society. (f) TEM image of 16 nm iron/iron oxide core/shell NPs. (g) HRTEM image showing a core of single-crystal a-Fe and a shell consisting of multiple domains of iron oxide. (h) T2-weighted MR images at 9.4 T of iron/iron oxide core/shell NPs and iron oxide NPs. (i) r2 values of the core/shell and oxide NPs determined from the same samples as in (h). Reproduced with permission from ref. 163. Copyright 2011, Wiley-VCH.
The coating of a NaGdF4 layer is an intriguing approach not only to suppress surface quenching of UCNPs for enhanced luminescence emission but also to endow NPs with MRI capabilities, creating a dual-modality imaging system.125,165,166 Results from different groups have suggested that the presence of Gd3+ ions on the surface of NPs might play a major role in accelerating relaxation, whereas the contribution from inner Gd3+ ions could be neglected; however, no direct evidence has been found to support this hypothesis.46,48,49 To investigate this issue, our group designed Gd3+-doped core NPs with multilayer coating of NaYF4 and/or NaGdF4.164 The r1 value was calculated to be 1.24 mM−1 s−1 for the core NPs, which decreased to nearly zero (r1 = 0.037 mM−1 s−1) after coating a ~4 nmNaYF4 layer on the core NPs, and recovered to 1.18 mM−1 s−1 after further coating with a NaGdF4 layer, clearly indicating the different effects between the bulk and surface Gd3+ ions in shortening T1 relaxation time.
To further validate the hypothesis that Gd3+ ions in the inner crystal lattice contributed little to longitudinal relaxivity, Gd3+-free core NPs were coated with a NaGdF4 layer of varied thicknesses (Fig. 12). With an increase in NaGdF4 layer thickness from approximately 0.2 nm to 3.7 nm, r1 values decreased gradually from 6.18 mM−1 s−1 to 2.18 mM−1 s−1, confirming that the main contribution to shortening T1 values was by surfacebound Gd3+ ions on the NPs. Subsequently, these NaGdF4 coated UCNPs were applied as dual-targeted nanoprobes by conjugating angiopep-2 peptide to cross the blood–brain barrier and target brain tumors for MRI-aided preoperative diagnosis and intraoperative identification of brain tumors by upconversion luminescence in an animal model.166
Fig. 12.

TEM images and schematic of Gd-free core (a, f and k) and core@NaGdF4 with varied NaGdF4 shell thicknesses of 0.2 nm (b, g, and l), 0.7 nm (c, h and m), 2.0 nm (d, i, and n), and 3.7 nm (e, j, and o). Yellow dots in l, m, n, and o represent Gd3+ ions. The r1 values of silica-coated water-soluble core@NaGdF4 NPs of various sizes are shown in the middle of the schematic illustrations. Reproduced with permission from ref. 164. Copyright 2011, Wiley-VCH.
3.3 Shape effects
The shape effects of NPs can be as important as the size and surface effects in determining the properties of nanomaterials. The unusual shapes of these NPs could potentially dictate their interactions with single cells or whole organisms.167 Shape-dependent relaxivity of NP-based MRI CAs has been revealed by many different groups, where shape anisotropy of magnetic NPs or shape confinement of Gd3+-based CAs can improve the relaxation of nearby water molecules. Employing the highly controllable shape of spherical or cubic magnetic CoFe2O4 NPs, Song et al. found that shape was an important factor in determining coercivity of magnetic NPs due to the varying effects of surface anisotropy.82 Very strong localized magnetic field inhomogeneity was produced by shape anisotropy, and the generated magnetic field strength was found to be dependent on the shape of magnetic NPs due to demagnetization effect.168 Shape-dependent enhancement of r2 values was also observed with superparamagnetic NPs.80,81,137 For example, faceted irregular cobalt ferrite nanostructures showed increased r2 values when compared to spherical NPs of similar volume.81 Zhao et al. synthesized branched octapod-shaped iron oxide NPs (edge length of 30 nm, Fig. 13a) with an ultra-high r2 relaxivity of ~679.3 mM−1 s−1,137 which was a much more effective T2 CA for small tumor detection than conventional spherical iron oxide NPs (Fig. 13d and e) because of their unique morphology and larger effective boundary radius (Fig. 13c). The significant enhancement was attributed to an increase in the effective radius of the magnetic core, a parameter that is impacted by shape anisotropy and directly affects r2 values (Fig. 13b).80,137
Fig. 13.
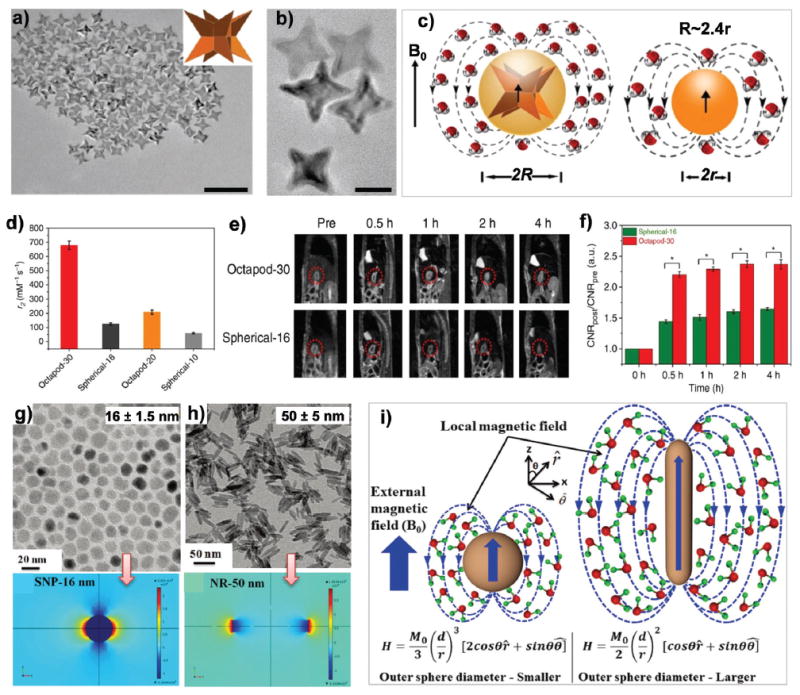
Shape effects on T2 contrast. (a) TEM image (scale bar, 100 nm) and (b) higher magnification TEM image (scale bar, 20 nm) of octapod-30 NPs of uniform four-armed iron oxide NPs. (c) A cartoon showing octapod and spherical iron oxide NPs. With the same geometric core volumes, the octapod NPs have much larger effective volumes (radius, R) than the spherical NPs (radius, r). (d) Comparison of r2 values of different iron oxide NPs. (e) In vivo sagittal MR images and (f) quantification of signal-to-background ratio (*P = 0.01) of orthotopic liver tumor models at 0, 0.5, 1, 2 and 4 h after intravenous injection of octapod-30 and spherical-16 iron oxide NPs. Reproduced with permission from ref. 137. Copyright 2013, Nature Publishing Group. (g and h) Top: TEM images of 16 nm iron oxide NPs (g) and 50 nm NRs (h). Bottom: Local magnetic field generated by the NRs and spherical Fe3O4 NPs of equivalent material volumes under an applied magnetic field of 3 T. (i) Schematic of the quantum mechanical outer sphere model of Fe3O4 NPs and NRs of the same material volume. Reproduced with permission from ref. 80. Copyright 2015, Royal Society of Chemistry.
Recently, Mohapatra et al. suggested that although spherical iron oxide NPs exhibited higher magnetization than iron oxide nanorods (NRs) of the same volume,80 high relaxivity (r2 = 608mM−1 s−1) was obtained for 50 nm NRs (Fig. 13g and h), while the relaxivity of the same volume of spherical NPs (the volume of a 50 nm NR was equivalent to that of a 16 nm NP) was only 297 mM−1 s−1. This phenomenon was believed to be a result of the larger surface area of the anisotropic morphology for NRs. Using the software Comsol Multiphysics, the induced local field inhomogeneity surrounding the 50 nmNRs was calculated to be significantly stronger than that induced by 16 nmNPs (Fig. 13g and h). The higher outer sphere diameter of rod-shaped NPs resulted in a stronger local magnetic inhomogeneity with a larger number of water protons experiencing rapid dephasing, which gave a higher r2 value. On the other hand, spherical NPs exhibited a smaller volume of magnetic field variation. Therefore, water protons diffused slowly and thus dephased slowly, resulting in a much lower r2 value than NRs of equivalent volume (Fig. 13i).80
Importantly, the shape effects of NPs on r2 values cannot be translated to r1 values because mechanisms for enhancements in r2 and r1 are different. An early study from Hyeon and co-workers demonstrated the significant effects of shape on r1 values using spherical and tetrahedral Mn3O4 NPs.132 Recently, Rotz et al. described the surface conjugation of DNA–Gd onto gold nanostars and nanospheres95 and found that DNA–Gd@stars exhibited remarkable r1 values up to 98 mM−1 s−1, much higher than those of DNA–Gd@spheres, where r1 values were 25 times larger than FDA-approved Gd chelates at 25 °C (Fig. 14a and b). Nuclear magnetic relaxation dispersion (NMRD) analysis indicated that secondary-sphere relaxivity contributed significantly to the production of such an exceptionally high r1 value of DNA–Gd@stars, while secondary-sphere enhancements were not observed for DNA–Gd@spheres (Fig. 14c). The shape of gold nanostars with hydrophilic microenvironment played a meaningful role in the sequestration of water molecules around the Gd3+ complexes, which facilitated longer access to secondarysphere water molecules and thereby generated greater contrast enhancement. Further studies from the same group reported that r1 depended on the number of branches on the nanostars, as r1 increased with increasing average number of branches (Fig. 14d).94 Researches from many other groups have also demonstrated that the shape of NPs can greatly impact their cellular uptake, biodistribution, clearance, and biocompatibility in vivo.169-173 Thus, an in-depth understanding of the effects of shape on relaxation can enable the rational design of high-relaxivity CAs with outstanding performance for in vivo applications.
Fig. 14.

Effects of NP shape on T1 relaxivity. (a) Schematic showing r1 values of different kinds of MRI CAs including Gd3+ chelates, DNA–Gd@spheres, and DNA–Gd@stars. (b) NMRD profiles for water solutions of DNA–Gd@stars and DNA–Gd@spheres. (c) Simulated deconvolution of DNA–Gd@stars NMRD profiles into their inner, secondary, and outer sphere contributions. Reproduced with permission from ref. 95. Copyright 2015, American Chemical Society. (d) Schematic showing the dependence of relaxation on branch numbers of DNA–Gd@stars. Reproduced with permission from ref.94. Copyright 2016, American Chemical Society.
4. Strategies to achieve high relaxivity for MRI contrast enhancement
Size control, surface modifications (e.g., organic surface ligands, silica shells, and inorganic nanolayers), and shape regulation at the nanoscale have been widely applied to regulate the behavior of CAs, resulting in largely accelerated relaxation for efficient T1 or T2 MRI contrast enhancement. A deep understanding of the involved nucleation, growth, and surface chemistry of NPs enables intelligent engineering of the key factors that affect relaxation, either independently or in combination. The development of such high-relaxivity CAs is crucial for molecular MRI applications such as early-stage disease detection,174-176 gene expression monitoring,177,178 drug release,140,179-181 and cell tracking.182-185 In addition to the traditionally investigated factors influencing the performance of CAs at the nanoscale, several novel strategies have been exploited to obtain high-relaxivity CAs, such as confining CAs in mesopores, doping with metal ions, self-assembly or disassembly, and so forth (Fig. 15).
Fig. 15.
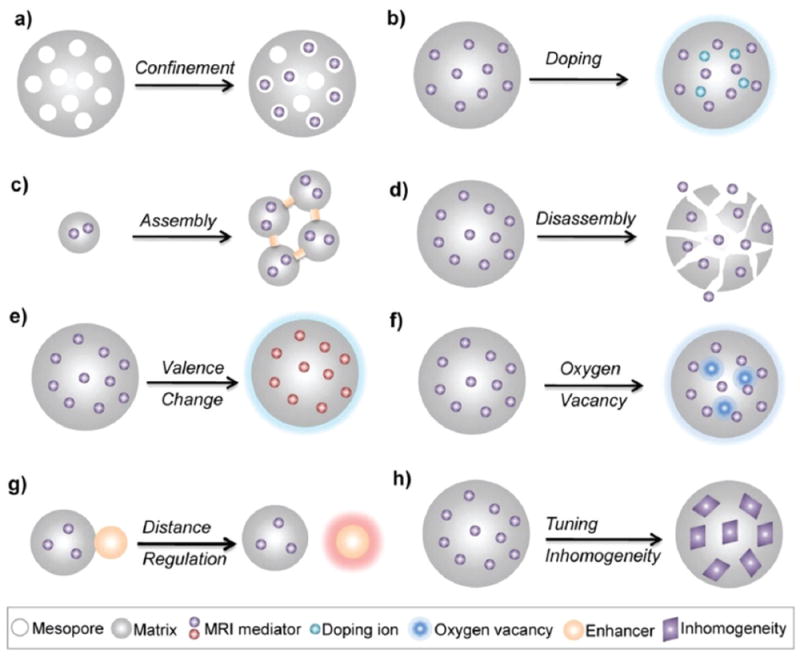
Schematic of engineering strategies to obtain high-relaxivity CAs for efficient MRI contrast enhancement.
4.1 Confinement in mesopores
The accessibility of water molecules to the paramagnetic center is highly important for the design of high-relaxivity CAs. Mesoporous silica nanoparticles (MSNs) provide an ideal platform for ready access of water molecules to the center due to their tunable pore structures and high surface areas. Dispersing CAs such as Gd3+ chelates,90-92 MnO NPs,61,64,139 and iron oxide NPs143 into the mesopores of MSNs can efficiently prolong τR and thus greatly increase relaxivity. For example, Lin et al. loaded Gd–Si–DTPA complexes into the hexagon-ordered nanochannels (~2.4 nm diameter) of MSNs, obtaining extremely high r1 values of 10.2 mM−1 s−1 at 9.4 T and 28.8 mM−1 s−1 at 3.0 T.91 The geometrical confinements of Gd3+ chelates, gadofullerenes, and gadonanotubes within the porous structure of silicon microparticles (SiMPs) (Fig. 16a) were all reported by Ananta et al.,186 demonstrating that such a strategy can successfully influence the paramagnetic behavior of Gd3+ ions, resulting in increased r1 values. By prolonging τR and reducing the mobility of outer sphere water molecules, r1 values about 4–50 times larger than their original values without SiMPs were obtained (Fig. 16b).
Fig. 16.

(a) Schematics showing (i) Magnevist (MAG), (ii) gadofullerenes (GF), and (iii) gadonanotubes (GNT) and cartoons showing Magnevist, GFs and GNTs entrapped within the porous structure of SiMPs. (b) r1 values of six MRI CA nanostructures in comparison with corresponding Gd-based CAs at 1.41 T and 37 °C. Reproduced with permission from ref. 186. Copyright 2010, Nature Publishing Group. (c) Schematic of Gd2O3 confined in MSNs. Reproduced with permission from ref. 187. Copyright 2016, Royal Society of Chemistry. (d) TEM image of hybrid mesoporous composite nanocapsules (HMCNs). Inset: STEM image with scale bar = 100 nm. (e) Relaxivity of an aqueous suspension of HMCNs after 4 h of soaking in buffer solutions at pH 5.0 and 7.4 at 37 °C. Reproduced with permission from ref. 61. Copyright 2012, Elsevier Ltd.
Recently, the use of such geometrical confinement for enhanced relaxivity was further confirmed by Gao and co-workers.187 Ultrasmall Gd2O3 NPs with numerous coordinating water molecules were dispersed into worm-like mesoporous channels of MSNs, which, by increasing the tumbling time and creating a geometrically confined space, remarkably increased r1 value from 14.93 mM−1 s−1 to 45.08 mM−1 s−1 at 0.5 T. (Fig. 16c). Thus, confinement of CAs in a porous structure offers a new and widely applicable strategy for strong T1 contrast enhancement, where mesopores also hold the potential for drug loading and delivery for therapeutic applications.
As described above, loading small MnO or iron oxide NPs within the mesopores of MSNs was demonstrated to be more beneficial for relaxation enhancement than traditional silicacoated structures because such coating layers shielded the surface paramagnetic centers from interaction with the water molecules.139,143 To further enhance the r1 value of MnO NPs to exceed that of clinical Gd3+ chelates (e.g. Magnevist, r1 = ~3.4 mM−1 s−1), we loaded small MnO NPs into hollow mesoporous silica nanoparticles (HMSNs) via an in situ redox reaction to further facilitate the interaction between manganese paramagnetic centers and water protons (Fig. 16d).61 Using this strategy, we were able to obtain a maximum r1 value of 8.81 mM−1 s−1, which is more than twice that of commercial Gd3+ chelates (Fig. 16e). In addition, the well-defined mesoporosity of HMSNs can enable efficient encapsulation of photosensitizers (i.e., protoporphyrin) for therapeutic purposes, as well as further confinement of paramagnetic Mn ions based on metalloporphyrin chelating chemistry.188 This mesoporous structure endowed these intriguing sensitizers with remarkably enhanced MRI performance (r1 = 9.43 mM−1 s−1).
By a facile but efficient physical-vapor-infiltration method, ultra-small iron oxide NPs have also been confined to the mesoporous networks of MSNs.143 In particular, the highly dispersed iron species in the mesoporous channels can be used as anchoring sites for anti-cancer drugs, such that gradual exposure of these iron paramagnetic centers along with controllable drug release from the mesopores enables monitoring of drug release in vivo through synchronously intensified MRI contrast. In another recent report, Zhang et al. incorporated both GdPO4 and g-Fe2O3 NPs in ordered mesoporous carbon composites, which exhibited satisfactory r1 and r2 values of 2.7 and 183.7 mM−1 s−1, respectively.189
4.2 Metal alloying and metal ion doping
The MRI performance of magnetic NPs is strongly dependent on their magnetic characteristics. Metal alloy-based NPs such as FeCo and FePt NPs are another class of CAs,77,146,190-194 which possess magnetic spins that align in parallel to the external magnetic field, resulting in typically higher magnetic moments than traditional ferromagnetic NPs. For example, the magnetic moment of FeCo alloys is approximately 2.4 μB per magnetic atom, while that of Fe3O4 NPs is approximately 1.3 μB.146 These FeCo alloys have a comparably high Ms of 215 emu per gram of metal when coated with a graphite shell, leading to an exceptionally high r2 value of 644 mM−1 s−1, much larger than that of conventional Fe3O4 NPs (usually about 100 mM−1 s−1). High X-ray absorption of Pt (6.95 cm2 g−1 at 50 keV) makes FePt alloy NPs promising candidates for MRI/CT dual-modality CAs.194 By conjugating FePt NPs with an antibody targeting Her2/neu, in vivo dual-modality imaging was achieved in cancer lesions in an animal model. Recently, it was reported that FePt NPs could also be used as an infrared-active nanoplatform for four imaging modalities (optical/photoacoustic/CT/MRI), which may allow for multiscale imaging from the cellular level to wholebody imaging.192
According to eqn (3), the r2 value of magnetic NPs is proportional to their Ms. Thus, metal ion doping has been verified to be an effective method to engineer the magnetism of iron oxide NPs and obtain extremely high r2 values, as investigated in detail by Cheon and co-workers.84 They synthesized various types of MFe2O4 NPs in which Fe2+ ions can be readily replaced by other transition-metal dopants M2+ where M = Mn, Ni, or Co. The magnetic moments per unit of MnFe2O4, CoFe2O4, and NiFe2O4 were estimated to be 5 μB, 3 μB, and 2 μB, respectively, leading to gradually decreasing Ms values from 110 emu per gram of metal for MnFe2O4 NPs to 85 emu per gram of metal for NiFe2O4 NPs (Fig. 17a). As a result, MnFe2O4 NPs exhibited the highest r2 value of 358 mM−1 s−1, two-fold higher than that of conventional iron oxide NPs. Such an enhancement is significant for clinical applications as the dosages of nanoparticulate CAs can potentially be decreased. By further co-doping Zn2+ and Mn2+ ions in (ZnxMn1−x)Fe2O4 NPs, the same group obtained NPs that exhibited an extremely high magnetization value (175 emu g−1) and provided the largest r2 value (860 mM−1 s−1) among the CAs reported to date (Fig. 17c).83 In this study, it was also found that the magnetism was dependent on amount of metal ion doping and x = 0.4 doping of Zn2+ demonstrated the best contrast (Fig. 17b).
Fig. 17.

(a) TEM images, mass magnetization values, magnetic spin structures, magnetic moments, T2-weighted images and colormaps of MnFe2O4, FeFe2O4, CoFe2O4, and NiFe2O4 NPs. Reproduced with permission from ref. 84. Copyright 2007, Nature Publishing Group. (b) Plots of r2 versus Zn2+ doping level in (ZnxM1−x)Fe2O4 (M = Mn2+, Fe2+) NPs at 4.5 T. (c) Comparison of r2 values of NPs, showing that Zn2+ doped NPs have significantly enhanced MRI contrast when compared to conventional iron oxide NPs. Reproduced with permission from ref. 83. Copyright 2009, Wiley-VCH.
4.3 Self-assembly and disassembly
“Activatable” or “smart” nanoprobes with tunableMRI relaxivity through self-assembly or disassembly in the presence of certain pathophysiological parameters can serve as high-relaxivity CAs, resulting in enhanced detection sensitivity of MRI for specific molecular or biological events. For example, such a self-assembly strategy allows for small NPs to circulate in the blood pool over a prolonged time duration, which can then be triggered in the tumor to self-assemble into a large structure for enhanced MRI. The trigger may include many physiological characteristics, such as molecular interactions,195 enzymes,196 receptors,197 and redox status.198 On the other hand, the disassembly strategy utilizes the different tumor microenvironments to release CAs preconfined in NPs, also achieving amplified MRI contrast. Both strategies are highly versatile and useful as they could be potentially used to monitor in vivo biological processes of the tumor microenvironment and improve the accuracy of cancer diagnosis or monitoring the therapeutic efficacy.
4.3.1 Self-assembly
Liang and co-workers reported the controlled self-assembly of Gd3+-based NPs through the condensation reaction between 1,2-aminothiol and 2-cyanobenzothiazole. 199 The probe was activated through disulfide reduction by tris(2-carboxyethyl)phosphine or glutathione (GSH) in cells and generated intermediate 1,2-aminothiol groups to react with the cyano groups on 2-cyanobenzothiazole, which results in selfassembly of large Gd3+ NPs with enhanced relaxivity. Presumably due to an increased rotational correlation time, a more than 2-fold increase in r1 value was observed for the larger assembly when compared to its small molecule form of Gd3+ chelates. Through further optimization of self-assembly strategy by intermolecular macrocyclization chemistry, the same group obtained biothiol-specific Gd3+-based CAs with amplified relaxivity after self-assembly, which were capable of detecting GSH concentrations with high sensitivity using MRI.200 In addition to redoxactivatable self-assembly, Ye et al. reported novel caspase-3/7 activated Gd-based CAs, which could self-assemble into Gd3+ NPs upon reduction and activation by caspase-3/7, an important early biomarker for apoptosis.201 Higher r1 relaxivity and longer retention time in apoptotic tumors were found with such self-assembling CAs, suggesting the potential for MRI of in vivo enzyme activity.
Self-assembly of small magnetic NPs into nanoclusters to increase effective magnetic size is also a widely used strategy for enhancing their magnetic properties and thus obtaining a higher r2 value. Using charge compensation and electrostatic adsorption between oppositely charged moieties, Berret et al. assembled 6.3 nm iron oxide NPs into larger nanoclusters, resulting in remarkably increased r2 values from 39 mM−1 s−1 for single NPs to 71 mM−1 s−1 for 70 nm nanoclusters and 162 mM−1 s−1 for 170 nm nanoclusters.202 The detection sensitivity of MRI using these NPs was thus substantially improved. A similar effect was also reported by Ai et al. in their first proofof- concept study regarding clustering of monodispersed iron oxide NPs inside the core of polymeric micelles.203 When compared to single core nanoparticles, multi-core nanoclusters with an average core size of 50 nm (self-assembled from 13 nm iron oxide NPs) provided much higher Ms values and subsequently exhibited higher performance in MRI contrast enhancement.204
Although larger sized iron oxide NPs present enhanced magnetic properties for MRI contrast enhancement, an ideal scenario is the self-assembly of small iron oxide NPs into larger nanostructures at the target sites (e.g., tumor) for substantially amplified relaxation, since smaller NPs (below renal clearance threshold of approximately 10 nm) exhibit longer blood circulation half-life and hence are cleared more slowly from the blood pool than their larger counterparts. Mao and co-workers reported that ultrafine iron oxide NPs (~3.5 nm) with high T1 relaxivity exhibited prolonged in vivo circulation life time and could be self-assembled or clustered into larger ones in the tumor, thereby switching from bright T1 contrast to dark T2 contrast in MRI.205 In another report, two complementary iron oxide NPs that were linked to a peptide substrate for enzymatic cleavage and a functional group (azide or alkyne) for click reaction196 were able to self-assemble into a larger nanocluster network in the presence of matrix metalloproteinase enzymes, leading to approximately 160% enhancement of T2 signal intensity.
Recently, Liang and co-workers reported a caspase-3/7- instructed biorthogonal cyclization to self-assemble Fe3O4@1 NPs in apoptotic cells and tumors for greatly enhanced T2 MRI (Fig. 18a).197 Caspase-3/7-mediated self-assembly of Fe3O4@1 NPs (r2 = 185 mM−1 s−1) induced an approximately 65% increase of r2 value when compared to the control group (r2 = 112 mM−1 s−1) (Fig. 18b). More importantly, in vivo MRI revealed that Fe3O4@1 NPs provided specific T2 enhanced contrast in apoptotic tumors, whereas the control Fe3O4@1-Scr NPs showed no contrast enhancement (Fig. 18c). In another recent study, Gao and co-workers synthesized Fe3O4 NPs modified with a responsive peptide sequence,198 which enabled GSH-triggered self-assembly of Fe3O4 NPs within the tumor microenvironment and the formation of aggregates through inter-particle cross-linking reactions (Fig. 18d and e). Both in vitro and in vivo experiments demonstrated that such self-assembly strategies substantially enhanced MRI performance (Fig. 18f).
Fig. 18.
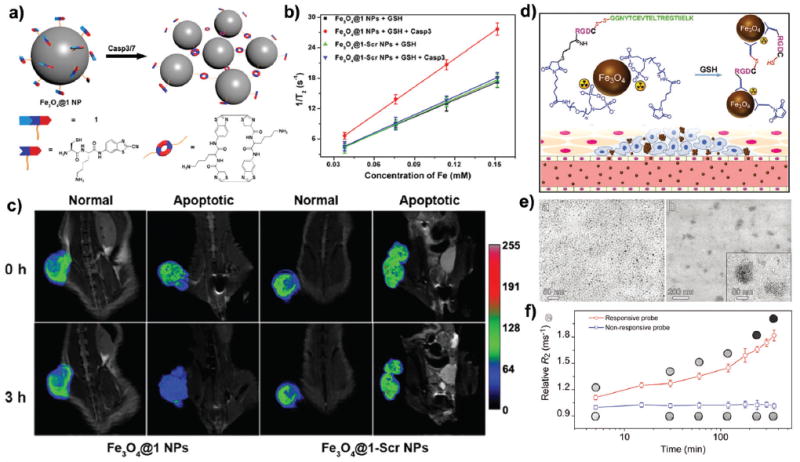
(a) Schematic of intracellular caspase-3/7-triggered aggregation of Fe3O4@1 NPs. (b) Plots of 1/T2 versus metal concentration in the presence or absence of caspase-3/7. (c) In vivo T2-weighted coronal images of Fe3O4@1 NPs or Fe3O4@1-Scr NPs in saline or DOX-treated (i.e., apoptotic) mice in 0 h (top) or 3 h (bottom) post injection. To make tumor apoptotic, about 8 mg kg−1 of doxorubicin (DOX) was injected intravenously, once every 4 days three times. Reproduced with permission from ref. 197. Copyright 2016, American Chemical Society. (d) Schematic of 99mTc-labeled Fe3O4 NPs and their responsiveness to GSH-triggering within the tumor microenvironment to form aggregates through inter-particle crosslinking reactions. (e) TEM images of the nonresponsive probe (left panel) and responsive probe (right panel) after being treated with GSH. (f) Temporal evolution of transverse relaxation rate R2 for both the responsive probe and nonresponsive control recorded on a 3.0 T MRI scanner during incubation with GSH (inset: T2-weighted images of probe solutions acquired at different incubation time points). Reproduced with permission from ref. 198. Copyright 2017, Wiley-VCH.
4.3.2 Disassembly
In general, disassembly strategies switch the relaxivity of CAs from “off” to “on” after responding to pathophysiological parameters such as low pH value and high GSH concentration within the tumor, thereby maximizing the signal from region-of-interest and minimizing the signal from background tissues to improve specificity and sensitivity of CAs. For example, Viger et al. encapsulated a large number of ultra-small Gd2O3 NPs in biodegradable polymer capsules, which showed extremely weak MRI contrast due to effective silencing of both inner and outer sphere relaxation.131 The r1 of the ultra-small Gd2O3 NPs could be recovered after disassembling the large capsules under acidic conditions and/or in the presence of H2O2, which are both characteristic of many diseases such as cancer (Fig. 19a). In this study, encapsulation of ultra-small Gd2O3 NPs within pH-responsive polymer particles resulted in deactivation of their contrast enhancement at pH 7.4. However, burst degradation was observed within 1 min at pH 6.5 (approximately the extracellular pH of diseased tissue), leading to an instantaneous 4.2-fold increase of r1 value, which remained constant thereafter (Fig. 19b). This concept was also verified using a peroxide-degradable polymer for encapsulation of ultra-small Gd2O3 NPs, indicating a general strategy of disassembly (Fig. 19c).131 A redox-modulated disassembly of Gd3+-based nanosystem was developed by Martinelli et al.206 The disassembly was achieved via the cleavage of S–S bridges in response to reducing environments, leading to the release of Gd3+ complexes and a subsequent significant change in relaxivity.
Fig. 19.

(a) Schematic of how a degradable polymermatrix is able to control the interaction of water molecules with Gd2O3 NPs (purple spheres). (b) Magnetic relaxivity of Gd2O3 NPs encapsulated in pH-responsive materials demonstrates a jump from neutral pH to mild acidity. (c) Increasing concentrations of H2O2 results in corresponding increases in the T1 relaxation rates of Gd2O3 NPs encapsulated in an H2O2-responsive polymer. Reproduced with permission from ref. 131. Copyright 2013, American Chemical Society.
Similar to the above-mentioned strategies used for Gd-based NPs, the release of Mn2+ from the disassembled matrix at lowpH sites was also employed to obtain high-relaxivity CAs for pH-responsive MRI.61,63 For example, Kim et al. reported core–shell Fe3O4@Mn3O4 NPs, where Mn2+ ions released from the Mn3O4 shell under reducing conditions allowed Fe3O4 NPs to interact with water protons, thereby enhancing contrast of both T1 and T2-weighted MRI.207 By confining Mn2+ within pH-sensitive calcium phosphate NPs (PEGMnCaP NPs, Fig. 20a), Mi et al. found a remarkable increase of r1 from 4.73 mM−1 s−1 to 19.96 mM−1 s−1 after exposure to acidic environments simulating intratumoral pH, wherein the pH-sensitive CaP was disassembled (Fig. 20b).52 The enhanced MRI signal by the dissembled CaP matrix and released Mn2+ was attributed to the increase in relaxivity after binding of Mn2+ with the protein. Such Mn2+-triggered signal amplification could be further used for the precise imaging of tumors. After intravenous injection of PEGMnCaP NPs, enhanced MRI signal in tumor areas could be clearly visualized within 6 h after injection. Such a release of Mn2+ from the nanocomposites allowed these NPs to sensitively detect millimeter-sized metastatic tumors in the liver of mice, which were otherwise invisible (Fig. 20c). The signal of the gallbladder gradually increased due to hepatic clearance of PEGMnCaP. As hypoxic regions in tumors usually exhibit a lower local pH than surrounding tissues, the contrast in hypoxic regions was 20–30% higher than that in normally oxygenated regions within the tumors after intravenous injection of PEGMnCaP NPs (Fig. 20d and e).
Fig. 20.

(a) Schematic of the hybrid structure of PEGMnCaP. PEGMnCaP consists of a CaP-based core and a PEG shell. The Mn2+ ions are trapped in the CaP core. (b) r1 value of PEGMnCaP in physiological environments at different pH levels, with and without proteins (for example, HSA). (c) MR images of liver metastasis using 1 T MRI scanner after i.v. injection of PEGMnCaP NPs. Scale bar, 1 cm. (d) MR images of a hypoxic region within a C26 tumor at 1 T, 4 h after the i.v. injection of PEGMnCaP NPs. (e) Staining of tumor tissues with pimonidazole confirmed that the hypoxic regions (brown) are at the same location as the tumor regions with higher MRI contrast enhancement. Scale bar, 1 mm. Reproduced with permission from ref. 52. Copyright 2016, Nature Publishing Group. (f) Schematic of the disassembly of PEG/Mn–HMSNs through “manganese extraction” and release of Mn2+ component intracellularly. TEM images showing structural evolution of Mn–HMSNs after biodegradation at a GSH concentration of (g) 5.0 and (h) 10 mM at pH 5.0 for 48 h. (i) Plot of 1/T1 versus Mn concentration for PEG/Mn–HMSN solution at varied GSH concentrations and (j) at varied pH. Reproduced with permission from ref. 208. Copyright 2016, American Chemical Society.
By doping Mn2+ ions into HMSN (Mn–HMSNs), we have recently reported a strategy called “manganese extraction” to promote the disassembly of Mn–HMSNs and enhance MRI contrast (Fig. 20f).208 Such a Mn2+ doping approach enabled accelerated disassembly of Mn–HMSNs in either mildly acidic or reducing microenvironments by breaking the Mn–O bond and subsequently triggering “manganese extraction,” which further accelerated breakage of Si–O–Si bonds in the framework and biodegradation of HMSNs (Fig. 20g and h). Such a fast disassembly of Mn–HMSNs enhanced the interaction probability of Mn paramagnetic centers with water molecules, allowing pH- and GSH-responsive MRI to be realized (Fig. 20i and j). The disassembly of Mn–HMSNs also accelerated the release of anticancer drugs to obtain tumor-sensitive theranostic functions.
4.4 Other strategies
Valency change
In principle, any physical or chemicalmethod to change the interaction between CAs and water molecules such as the number of bound water molecules (q), rotational correlation time (τR), and water residence time (τM) of T1 CAs or to enhancemagnetic properties of T2 CAs will undoubtedly result in enhanced MRI relaxivity of CAs. One major strategy for MRI contrast enhancement focuses on valency changes of ions, which has been widely applied through using redox-activated chemical exchange saturation transfer (CEST) agents that can be detected by MRI.85,86,209 As previously discussed, the valency of ions affects electron spin that in turn influences relaxation of water protons. Owing to its pH- and redox-responsive properties, MnO2 can be reduced to Mn2+ by GSH or H2O2/H+.51,53,210 For example, Chu et al. reported that MnO2 nanosheets could serve as highly effective generators to trigger self-assembly of photosensitizers (sinoporphyrin sodium, DVDMS) after reduction by GSH and H2O2 (Fig. 21a).211 Such processes could be monitored by in vitro and in vivo MRI (Fig. 21b and c), which was validated by TEM imaging of ex vivo tumor tissues (Fig. 21d).
Fig. 21.
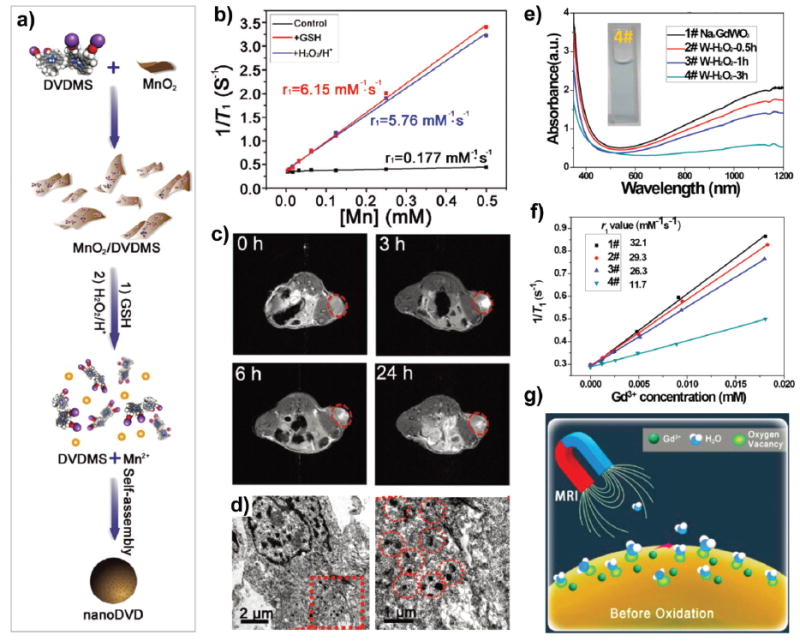
(a) Schematic illustration showing the fabrication process of MnO2/DVDMS and the reaction in GSH solution or with H2O2 (pH 5.5). (b) Plot of 1/T1 versus Mn concentration for MnO2/DVDMS (black line), MnO2/DVDMS + GSH (red line), and MnO2/DVDMS + H2O2/H+ (blue line) solutions. (c) T1-weighted MR images before and after injection of MnO2/DVDMS. (d) TEM images of MCF-7 tumor sections at 24 h after injection of MnO2/DVDMS. Reproduced with permission from ref. 211. Copyright 2017, Wiley-VCH. (e) UV-vis-NIR absorption spectra and (f) plot of 1/T1 versus Gd3+ concentration of PEG–NaxGdWO3 nanorods after oxidization with H2O2 for varied time periods: 1#: 0 h; 2#: 0.5 h; 3#: 1 h; 4#: 3 h. (g) Schematic of the affinity of oxygen vacancies for oxygen atoms and its impact on the interaction between water molecules and Gd3+ ions. Reproduced with permission from ref. 37. Copyright 2017, American Chemical Society.
Research from our group also suggested that MnO2 nanosheets could generate oxygen to overcome the hypoxic environment of tumors by reacting with H2O2 53 and the released Mn2+ could be used for pH-responsive MRI.55 Zhao et al. designed a redox-responsive MnO2 nanosheet, in which manganese atoms were coordinated in an octahedral geometry to six oxygen atoms that prevented direct contact with the aqueous environment, therefore making no contributions to the alteration of relaxation of water protons.54 Intracellular GSH could then reduce endocytosed MnO2 nanosheets, generating numerous Mn2+ ions for MRI with greatly enhanced r1 and r2 values.
Oxygen vacancy
To date, the strategy of increasing the number of bound water molecules has not been employed in inorganic Gd3+-based NPs. Recently, we introduced oxygen vacancy into Gd3+-based NPs by designing a novel Gd3+-doped tungsten bronze (termed as PEG-NaxGdWO3 nanorods).37 For the first time, controllable oxygen vacancies in inorganic nanosized CAs were generated for accelerated proton relaxation, favorably resulting in a substantially enhanced r1 value due to the oxygen vacancies’ natural affinity to oxygen atoms in water molecules.212 Such a strategy was validated with oxygen-deficient PEG-NaxGdWO3 nanorods, which exhibited extraordinarily high r1 values up to 80 mM−1 s−1 at 0.7 T and 32.1 mM−1 s−1 on a clinical 3.0 T scanner (Fig. 21e and f), offering excellent blood pool imaging and tumor diagnosis capabilities at a low CA dosage. NMRD profiles indicated that r1 value was apparently increased by changes in the distribution of the number of bound water molecules (q) either through secondary- or outer-sphere effects (Fig. 21g).
Distance regulation
Recently, Choi et al. have introduced a distance-dependent magnetic resonance tuning systembased on the interaction between a superparamagnetic ‘quencher’ and a paramagnetic ‘enhancer’, where T1 signal was tuned “on” or “off” depending on separation distance between the enhancer and quencher.213 As the enhancer moved far away from the quencher (d1 > dc, where dc is the critical separation distance), the electron spin fluctuation of the enhancer accelerated water proton relaxation, resulting in a stronger T1 signal (“on” state); however, when the enhancer and quencher were in close proximity to one another (d2 < dc), the resulting spin fluctuation became too slow to induce effective water proton relaxation, resulting in a low T1 signal “off” state (Fig. 22a). The feasibility of this strategy was demonstrated through the control of thickness of SiO2 shell, thereby separating the enhancer and quencher from 18 to 2 nm (Fig. 22b). The dc was set to 7 nm, where the T1 relaxivity quenching efficiency was 50% (Fig. 22c). Measurements from X-band electron paramagnetic resonance and NMRD profiles revealed distance-dependent values of correlation time (τc) and T1e (for details, please see eqn (2)), indicating that the enhancer electron spin fluctuation became slower as separation distance decreased. Furthermore, such a distance-dependent tuning effect of MRI signal was verified using three representative models of molecular interactions (i.e., cleavage, binding, and folding/unfolding) via modular combinations of enhancers and quenchers though interactive linkers (Fig. 22d).
Fig. 22.

(a) Schematic representation of distance-dependent magnetic resonance tuning. (b) Schematic of a nanoscale ruler that shows a variable T1 MRI signal, dependent on the separation distance between the paramagnetic enhancer (Gd-DOTA) and superparamagnetic quencher (i.e., 12 nm Zn0.4Fe2.6O4 particle). Lower panel: T1-weighted MR image and color map image of a solution containing the enhancer and quencher with varied separation distances. (c) A plot of r1 values versus separation distance. (d) Schematic of modular combinations for the preparation of distance-dependent magnetic resonance sensors, operated using three different modes of interactions (cleavage, binding, and conformational changes) and subsequent T1 MRI signal outputs. Reproduced with permission from ref. 213. Copyright 2017, Nature Publishing Group.
Tuning inhomogeneity
A novel strategy to greatly enhance r2 relaxivity by tuning magnetic field inhomogeneity of iron oxide nanoclusters has been recently reported by Chen and co-workers.214 Using both experimental validations and theoretical simulations, the group found that the clustering of iron oxide NPs could enhance local field inhomogeneity due to reduced field symmetry. Clusters of mixed 5 nm plus 15 nm iron oxide NPs exhibited a much higher r2 value of 533.4mM−1 s−1, when compared to clusters containing 5 nm NPs only (r2 = 231.6 mM−1 s−1) or 15 nm NPs only (r2 = 358.3 mM−1 s−1) (Fig. 23a), indicating the important roles of particle distribution and fraction in generating local field inhomogeneity. By artificially involving iron oxide NPs with heterogeneous geometries (e.g., iron oxide cubes and plates to assemble clusters) (Fig. 23b and c), the levels of field inhomogeneity were further elevated when compared to iron oxide sphere clusters. The iron oxide cube clusters showed the highest r2 value (589.3 mM−1 s−1) due to the presence of spinpolarized cubes in nanoclusters (Fig. 23d). Landau–Lifshitz–Gilbert simulations confirmed their hypothesis (Fig. 23e and f), suggesting that regulating magnetic field inhomogeneity is a powerful way to establish correlations between magnetization and T2 relaxivity of iron oxide NPs.
Fig. 23.

(a) Columns showing r2 values of iron oxide (IO) clusters, as well as the single IO-5 and IO-15 NPs. C1: clusters of 5 nm NPs only; C2: clusters of 15 nm NPs only; C3: clusters of mixed 5 nm NPs and 15 nm NPs. (b and c) TEM and high-resolution TEM images, as well as cartoons of clusters C6 (IO cubes) and C7 (IO nanoplates), respectively. (d) Columns showing r2 values of IO clusters C6 and C7, as well as the single IO cubes and plates. (e and f) Simulation models and calculated stray fields for clusters C6 and C7, respectively. Color bars represent log10(Hd), where Hd is the calculated stray field. Reproduced with permission from ref. 214. Copyright 2017, Nature Publishing Group.
5. Summary and outlook
The design and fabrication of high-relaxivity and ultra-sensitive CAs for MRI provides not only a great challenge to overcome, but also provides great opportunities to make significant contributions in the biomedical field. The imaging performances of commercially available MRI CAs have been far from optimal, which necessitates the development of novel nanosized CAs with large enough contrast effects for highly sensitive detection of lesions. Undoubtedly, controllable synthesis and facile engineering of inorganic nanoparticulate CAs and their excellent in vivo behavior as imaging agents will greatly deepen our understanding and subsequent effective diagnosis and treatment of diseases.
This review article provides a comprehensive summary of methods that have been investigated to construct highperformance CAs, including size control of Gd-, Mn-, Fe-, Dyand Ho-based NPs, surface modification with different ligands, coating of silica shells (dense or mesoporous shells) or inorganic nanolayers on NPs, and regulation of shape of NPs for accelerated relaxation of water protons. Some widely applied strategies to achieve high relaxivity forMRI contrast enhancement such as confinement of CAs in mesopores, doping with metal ions, and self-assembly or disassembly have been discussed. In addition, other recently developed novel strategies including valency change, oxygen vacancy, and distance-dependent tuning have been briefly described. While there is no simple answer to the question of “how do these factors impact relaxivity of NPs,” several principles that can guide the engineering of future NPs as high-performance MRI CAs are as follows:
Size effect of NPs will determine whether surface-tovolume ratio or τR is the dominant contributing factor for generating T1 contrast with any given NP. Meanwhile, size-dependent magnetization of magnetic NPs can be utilized in the design of T2 CAs with high r2 values.
Surface modification of NPs is indispensable not only for controlling NP growth but also for increasing compatibility and functionalization of NPs. The surface of NPs can be further adjusted to enhance or reduce MRI signal after size, which depends on coating species, hydrophilicity, density, and thickness of organic ligands, silica shells, and inorganic layers.
Shape confinement of Gd3+-based CAs has recently been utilized to impact relaxation of water protons by engineering Gd3+ chelates into dense and hydrophilic microenvironments that are closely related to the shape of NPs. In the meantime, the magnetic field inhomogeneity enhanced by shape anisotropy of magnetic NPs can be artificially regulated to enhance T2 relaxivity by reducing symmetry of the induced field.
Biodistribution, pharmacokinetics, and metabolism of NPs are also mediated by factors such as particle size, surface, and shape. The successful engineering of NPs as high-performance imaging agents must consider their behavior in vivo. Ultrasmall sized NPs with higher relaxivity are promising imaging agents because they can be excreted by the kidneys on a short time scale.
Strategies to achieve high relaxivity for MRI contrast enhancement are mainly focused on tuning the interaction between NPs and nearby water protons, either enhancing or reducing the contrast of MRI. By further exploiting tumor microenvironment characteristics such as acidic pH, unevenness of blood flow, and hypoxia, engineering of NPs for stimuliresponsive MRI can be realized for the precise imaging of tumors and detection of their pathological conditions with MRI.
Despite the recent significant progress and promising results in preclinical animal models, the investigation, evaluation, and optimization of NP-based MRI CAs for clinical use are still in their infancy. To facilitate and enable the successful translation of these CAs from laboratories to clinics, we outline several considerations for future research on the interdisciplinary cooperation among engineers, material scientists, biologists, clinicians, and others toward future (molecular) MRI (Fig. 24).
Although some factors/strategies have been explored by regulating the key parameters that influence the perturbation of protons by the dipolar field of NPs, we believe that more novel factors/strategies for the design of high-relaxivity CAs are on the horizon. In addition, because the biodistribution, excretion, and pharmacokinetics of NPs are dependent on their size, shape, and surface status, rigorous and extensive attention should be paid to deep understanding the co-relations among nanoparticle characteristics (e.g., size, shape, and surface status), in vivo metabolism, and MRI contrast enhancement efficiency. Through a basic understanding of how these factors work together, future clinical applications may be realized. Synergistic integration of these factors may offer promising approaches in fabricating low-toxicity and high-performance CAs that are amenable to clinical translation which will eventually benefit patients.18
Efficient systemic delivery of CAs to the targeted tissues is of utmost importance for accurate and sensitive detection by MRI, which can include passive accumulation of elaborately synthesized NPs to maximize enhanced permeability and retention (EPR) effect, as well as active targeting of NPs via various ligands such as antibodies, antibody fragments, peptides, small molecules, and proteins. The impacts of nanoparticle size, surface modification, and shape on proton relaxation have been well studied, while their relationship with the EPR effect remains to be further elucidated. Generally, ultra-small sized renal clearable NPs exhibit poor EPR effect.215 Future studies should focus on the specific interaction between MRI contrast performance of CAs and EPR effect to develop a clinically relevant and useful strategy for obtaining high-relaxivity NPs with an optimal balance between renal clearance and strong EPR effects over a suitable time scale (e.g., less than a few hours).216
The hypoxic microenvironment in various tumors has received tremendous attention from researchers because it is closely related to the tumor’s aggressiveness and resistance to therapy,217,218 and a number of NPs have been used to effectively eradicate hypoxic tumors in preclinical animal models.219-222 Although in this review article we have discussed various strategies based on NPs for efficient MRI, there has been no literature report on hypoxia-responsive NPs as MRI CAs except on several chemical complexes for hypoxia-related MRI such as T1 or T2 CAs,223 19F-based probes,224 and CEST probes.86 We believe that research on this subject is likely already in progress, and the NPs that respond to hypoxia via, for example, valency change, size/morphology variation, assembly, and disassembly for enhanced MRI, will likely play multiple roles in accurate and noninvasive delineation of hypoxic areas, more precise and effective treatment, and real-time and noninvasive monitoring of therapeutic efficacy.
The next generation of MRI CAs will be developed not only based on design principles of NPs described in this review article, but also on the concurrent development of advanced nanotechnology, novel MRI sequences and scanners, and new biological applications. The synthesis of these NPs needs further optimization, and NPs that are synthesized in an easy, low-cost, and large-scale way is prerequisite to future clinical translation, a challenge which may be overcome by seeking more facile, reproducible, and economic one-pot syntheses without harmful reagents. With an in-depth understanding of the involved processes, we firmly believe that good biocompatibility and biodegradability, high relaxivity, and novelMRI contrast mechanisms can all be achieved with the future generation of novel inorganic NPs to usher in the new era of 21st century precision medicine (Table 3).
Fig. 24.
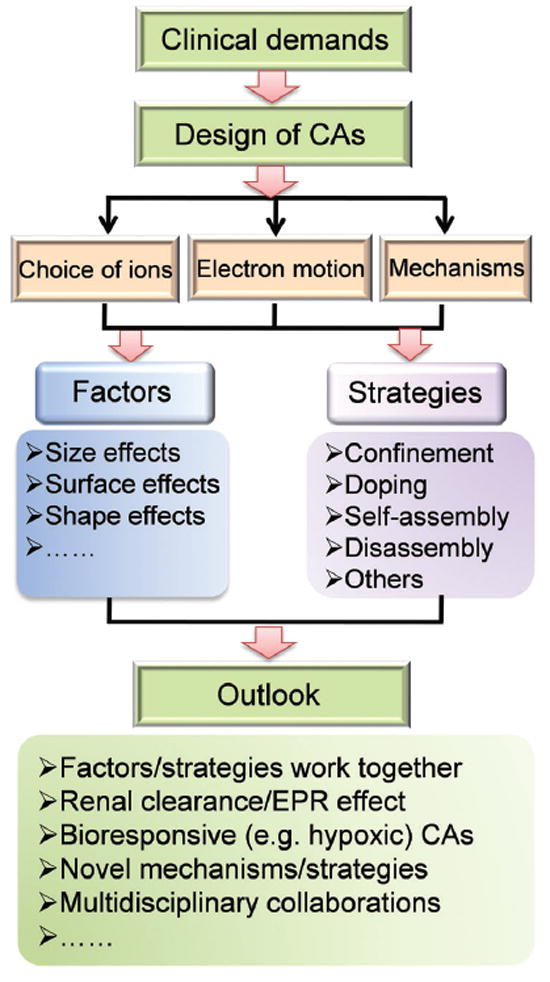
Summary and outlooks of designing inorganic NPs for MRI.
Table 3.
Full names and their corresponding abbreviations
| Full name | Abbreviation | Full name | Abbreviation |
|---|---|---|---|
| 5-Aminolevulinic acid | 5-ALA | Mesoporous silica nanoparticles | MSNs |
| Catechol | CC | Mercaptosuccinic acid | MSA |
| Chemical exchange saturation transfer | CEST | Motional averaging regime | MAR |
| Computed X-ray tomography | CT | Nanoparticles | NPs |
| Dense silica | dSiO2 | Nanorods | NRs |
| Diethylenetriaminepentaacetic acid | DTPA | Nuclear magnetic relaxation dispersion | NMRD |
| Diffusion correlation time | τD | Number of bound water molecules | q |
| Diphosphate | DP | Poly(acrylic acid) | PAA |
| Contrast agents | CAs | Photoacoustic | PA |
| Distearyl phosphatidylethanolamine | DSPE | Polyethylene glycol | PEG |
| 2,3-Dimercaptosuccinic acid | DMSA | Polyethylenimine | PEI |
| Effective magnetic moment | μeff | Polyvinylpyrrolidone | PVP |
| Electron spin angular momentum | S | Poly(maleic anhydride-alt-1-octadecene) | PMAO |
| Electron orbital angular momentum | L | Poly(maleic acid)-octadecene | PMO |
| Enhanced permeation and retention | EPR | Reticuloendothelial system | RES |
| Glutathione | GSH | Silicon microparticles | SiMPs |
| 1-Hexadecylamine | HDA | Rotational correlation time | τR |
| High-resolution | TEM | HRTEM Saturation magnetization | Ms |
| Hollow mesoporous silica nanoparticles | HMSNs | Sinoporphyrin sodium | DVDMS |
| Hydroxamate | HX | Solomon–Bloembergen–Morgan | SBM |
| Lanthanide | Ln | Static dephasing regime | SDR |
| Magnetic resonance angiography | MRA | Transmission electron microscopy | TEM |
| Magnetic resonance imaging | MRI | Total electron angular momentum | J |
| Magnevist | Gd–DTPA | Upconversion nanoparticles | UCNPs |
| Mesoporous silica | mSiO2 | Water residence time | τM |
Acknowledgments
This work has been financially supported by the China National Funds for Distinguished Young Scientists (Grant No. 51725202), the National Natural Science Foundation of China (Grant No. 51372260) and the Shanghai Excellent Academic Leaders Program (Grant No. 16XD1404000). This work was also supported, in part, by the University of Wisconsin – Madison, the National Institutes of Health (NIBIB/NCI 1R01CA169365, 1R01EB021336, T32GM008505, and P30CA014520), and the American Cancer Society (125246-RSG-13-099-01-CCE).
Biographies

Dalong Ni
Dalong Ni received his PhD degree in 2016 from the Shanghai Institute of Ceramics, Chinese Academy of Sciences (SICCAS), under the supervision of Prof. Wenbo Bu. He then joined the Department of Radiology at the University of Wisconsin-Madison as a postdoctoral fellow under the supervision of Prof. Weibo Cai. His research interests focus on design, synthesis, and biomedical applications of multifunctional nanoplatforms for imaging and therapy applications, such as MRI and MRI-guided cancer therapy.

Wenbo Bu
Wenbo Bu received his PhD degree from Nanjing Tech University (China) in 2002. He has been a full-time professor in SICCAS since 2008. In 2016, he moved from SICCAS to East China Normal University. His research mainly focuses on design and synthesis of multifunctional rareearth- based nanomaterials for cancer imaging and therapeutic applications.

Emily B. Ehlerding
Emily B. Ehlerding received her MS degree in Medical Physics from the University of Wisconsin- Madison in 2016 and her BS in Chemistry and Physics from Manchester University in 2014. She is currently a PhD candidate in Medical Physics at UW-Madison, working with antibody-based platforms for multimodality imaging of immunotherapy-related targets.

Weibo Cai
Weibo Cai received his PhD degree in Chemistry from University of California, San Diego, in 2004 and is now an associate professor at the University of Wisconsin- Madison (http://mi.wisc.edu). He has published more than 230 peerreviewed articles (H-index 4 60) and has received many awards such as the Society of Nuclear Medicine and Molecular Imaging (SNMMI) Young Professionals Committee Best Basic Science Award (2007), the European Association of Nuclear Medicine Springer Prize (2011 & 2013), American Cancer Society Research Scholar (2013–2017), and UW-Madison Vilas Distinguished Achievement Professor Award (2017). His trainees have received more than 80 awards to date, such as the 2012 Berson-Yalow Award from SNMMI.

Jianlin Shi
Jianlin Shi received his PhD degree from SICCAS. He has been a full-time professor at SICCAS since 1994. His research interests include the synthesis of mesoporous silica nanoparticles and mesoporous silica-based nanocomposites for biomedical applications. He has published over 400 scientific papers, which have been cited more than 22 000 times by other scientists, and has an H-index of 79.
Footnotes
Conflicts of interest
There are no conflicts to declare.
References
- 1.Cao Y, Depinho RA, Ernst M, Vousden K. Nat Rev Cancer. 2011;11:749. doi: 10.1038/nrc3138. [DOI] [PubMed] [Google Scholar]
- 2.Rudin M, Weissleder R. Nat Rev Drug Discovery. 2003;2:123. doi: 10.1038/nrd1007. [DOI] [PubMed] [Google Scholar]
- 3.Smith BR, Gambhir SS. Chem Rev. 2017;117:901. doi: 10.1021/acs.chemrev.6b00073. [DOI] [PubMed] [Google Scholar]
- 4.Angelovski G. Angew Chem Int Ed. 2016;55:7038. doi: 10.1002/anie.201510956. [DOI] [PubMed] [Google Scholar]
- 5.Lohrke J, Frenzel T, Endrikat J, Alves FC, Grist TM, Law M, Lee JM, Leiner T, Li K-C, Nikolaou K. Adv Ther. 2016;33:1. doi: 10.1007/s12325-015-0275-4. [DOI] [PMC free article] [PubMed] [Google Scholar]
- 6.Burtea C, Laurent S, Vander Elst L, Muller RN. Molecular imaging I. Springer; 2008. p. 135. [Google Scholar]
- 7.Raymond KN, Pierre VC. Bioconjugate Chem. 2005;16:3. doi: 10.1021/bc049817y. [DOI] [PubMed] [Google Scholar]
- 8.Penfield JG, Reilly RF. Nat Clin Pract Nephrol. 2007;3:654. doi: 10.1038/ncpneph0660. [DOI] [PubMed] [Google Scholar]
- 9.Estelrich J, Sanchez-Martin MJ, Busquets MA. Int J Nanomed. 2015;10:1727. doi: 10.2147/IJN.S76501. [DOI] [PMC free article] [PubMed] [Google Scholar]
- 10.Zhou Z, Lu ZR. Wiley Interdiscip Rev : Nanomed Nanobiotechnol. 2013;5:1. doi: 10.1002/wnan.1198. [DOI] [PMC free article] [PubMed] [Google Scholar]
- 11.Cao Y, Xu LJ, Kuang Y, Xiong DS, Pei RJ. J Mater Chem B. 2017;5:3431. doi: 10.1039/c7tb00382j. [DOI] [PubMed] [Google Scholar]
- 12.Pan D, Caruthers SD, Senpan A, Schmieder AH, Wickline SA, Lanza GM. Wiley Interdiscip Rev : Nanomed Nanobiotechnol. 2011;3:162. doi: 10.1002/wnan.116. [DOI] [PMC free article] [PubMed] [Google Scholar]
- 13.Pan D, Schmieder AH, Wickline SA, Lanza GM. Tetrahedron. 2011;67:8431. doi: 10.1016/j.tet.2011.07.076. [DOI] [PMC free article] [PubMed] [Google Scholar]
- 14.Shen Z, Wu A, Chen X. Mol Pharmaceutics. 2017;14:1352. doi: 10.1021/acs.molpharmaceut.6b00839. [DOI] [PubMed] [Google Scholar]
- 15.Reddy LH, Arias JL, Nicolas J, Couvreur P. Chem Rev. 2012;112:5818. doi: 10.1021/cr300068p. [DOI] [PubMed] [Google Scholar]
- 16.Lee H, Shin TH, Cheon J, Weissleder R. Chem Rev. 2015;115:10690. doi: 10.1021/cr500698d. [DOI] [PMC free article] [PubMed] [Google Scholar]
- 17.Feliu N, Docter D, Heine M, del Pino P, Ashraf S, Kolosnjaj-Tabi J, Macchiarini P, Nielsen P, Alloyeau D, Gazeau F, Stauber RH, Parak WJ. Chem Soc Rev. 2016;45:2440. doi: 10.1039/c5cs00699f. [DOI] [PubMed] [Google Scholar]
- 18.Park S-m, Aalipour A, Vermesh O, Yu JH, Gambhir SS. Nat Rev Mater. 2017;2:17014. doi: 10.1038/natrevmats.2017.14. [DOI] [PMC free article] [PubMed] [Google Scholar]
- 19.Das GK, Johnson NJJ, Cramen J, Blasiak B, Latta P, Tomanek B, van Veggel FCJM. J Phys Chem Lett. 2012;3:524. doi: 10.1021/jz201664h. [DOI] [PubMed] [Google Scholar]
- 20.Zhang X, Blasiak B, Marenco AJ, Trudel S, Tomanek B, van Veggel FCJM. Chem Mater. 2016;28:3060. [Google Scholar]
- 21.Ni D, Zhang J, Bu W, Zhang C, Yao Z, Xing H, Wang J, Duan F, Liu Y, Fan W, Feng X, Shi J. Biomaterials. 2016;76:218. doi: 10.1016/j.biomaterials.2015.10.063. [DOI] [PubMed] [Google Scholar]
- 22.Prodi L, Rampazzo E, Rastrelli F, Speghini A, Zaccheroni N. Chem Soc Rev. 2015;44:4922. doi: 10.1039/c4cs00394b. [DOI] [PubMed] [Google Scholar]
- 23.Lee DE, Koo H, Sun IC, Ryu JH, Kim K, Kwon IC. Chem Soc Rev. 2012;41:2656. doi: 10.1039/c2cs15261d. [DOI] [PubMed] [Google Scholar]
- 24.Shin TH, Choi Y, Kim S, Cheon J. Chem Soc Rev. 2015;44:4501. doi: 10.1039/c4cs00345d. [DOI] [PubMed] [Google Scholar]
- 25.Chen H, Zhang W, Zhu G, Xie J, Chen X. Nat Rev Mater. 2017;2:17024. doi: 10.1038/natrevmats.2017.24. [DOI] [PMC free article] [PubMed] [Google Scholar]
- 26.Na HB, Song IC, Hyeon T. Adv Mater. 2009;21:2133. [Google Scholar]
- 27.Lee SH, Kim BH, Na HB, Hyeon T. Wiley Interdiscip Rev : Nanomed Nanobiotechnol. 2014;6:196. doi: 10.1002/wnan.1243. [DOI] [PubMed] [Google Scholar]
- 28.Huang J, Zhong X, Wang L, Yang L, Mao H. Theranostics. 2012;2:86. doi: 10.7150/thno.4006. [DOI] [PMC free article] [PubMed] [Google Scholar]
- 29.Lee N, Hyeon T. Chem Soc Rev. 2012;41:2575. doi: 10.1039/c1cs15248c. [DOI] [PubMed] [Google Scholar]
- 30.Jun YW, Lee JH, Cheon J. Angew Chem Int Ed. 2008;47:5122. doi: 10.1002/anie.200701674. [DOI] [PubMed] [Google Scholar]
- 31.Zhou Z, Bai R, Munasinghe J, Shen Z, Nie L, Chen X. ACS Nano. 2017;11:5227. doi: 10.1021/acsnano.7b03075. [DOI] [PMC free article] [PubMed] [Google Scholar]
- 32.Hingorani DV, Bernstein AS, Pagel MD. Contrast Media Mol Imaging. 2015;10:245. doi: 10.1002/cmmi.1629. [DOI] [PMC free article] [PubMed] [Google Scholar]
- 33.van Duijnhoven SM, Robillard MS, Langereis S, Grull H. Contrast Media Mol Imaging. 2015;10:282. doi: 10.1002/cmmi.1636. [DOI] [PubMed] [Google Scholar]
- 34.Angelovski G. Acc Chem Res. 2017;50:2215. doi: 10.1021/acs.accounts.7b00203. [DOI] [PubMed] [Google Scholar]
- 35.Caravan P, Ellison JJ, McMurry TJ, Lauffer RB. Chem Rev. 1999;99:2293. doi: 10.1021/cr980440x. [DOI] [PubMed] [Google Scholar]
- 36.Zheng XY, Zhao K, Tang J, Wang XY, Li LD, Chen NX, Wang YJ, Shi S, Zhang X, Malaisamy S, Sun LD, Wang X, Chen C, Yan CH. ACS Nano. 2017;11:3642. doi: 10.1021/acsnano.6b07959. [DOI] [PubMed] [Google Scholar]
- 37.Ni D, Zhang J, Wang J, Hu P, Jin Y, Tang Z, Yao Z, Bu W, Shi J. ACS Nano. 2017;11:4256. doi: 10.1021/acsnano.7b01297. [DOI] [PubMed] [Google Scholar]
- 38.Ni D, Shen Z, Zhang J, Zhang C, Wu R, Liu J, Yi M, Wang J, Yao Z, Bu W, Shi J. ACS Nano. 2016;10:3783. doi: 10.1021/acsnano.6b00462. [DOI] [PubMed] [Google Scholar]
- 39.Johnson NJ, He S, VA Huu Nguyen, Almutairi A. ACS Nano. 2016;10:8299. doi: 10.1021/acsnano.6b02559. [DOI] [PubMed] [Google Scholar]
- 40.Xing H, Zhang S, Bu W, Zheng X, Wang L, Xiao Q, Ni D, Zhang J, Zhou L, Peng W, Zhao K, Hua Y, Shi J. Adv Mater. 2014;26:3867. doi: 10.1002/adma.201305222. [DOI] [PubMed] [Google Scholar]
- 41.Hou Y, Qiao R, Fang F, Wang X, Dong C, Liu K, Liu C, Liu Z, Lei H, Wang F, Gao M. ACS Nano. 2013;7:330. doi: 10.1021/nn304837c. [DOI] [PubMed] [Google Scholar]
- 42.Shao Y, Tian X, Hu W, Zhang Y, Liu H, He H, Shen Y, Xie F, Li L. Biomaterials. 2012:6438. doi: 10.1016/j.biomaterials.2012.05.065. [DOI] [PubMed] [Google Scholar]
- 43.Kimura Y, Kamisugi R, Narazaki M, Matsuda T, Tabata Y, Toshimitsu A, Kondo T. Adv Healthcare Mater. 2012;1:657. doi: 10.1002/adhm.201200103. [DOI] [PubMed] [Google Scholar]
- 44.Ahren M, Selegard L, Klasson A, Soderlind F, Abrikossova N, Skoglund C, Bengtsson T, Engstrom M, Kall PO, Uvdal K. Langmuir. 2010;26:5753. doi: 10.1021/la903566y. [DOI] [PubMed] [Google Scholar]
- 45.Bridot J-L, Faure A-C, Laurent S, Rivière C, Billotey C, Hiba B, Janier M, Josserand V, Coll J-L, Vander Elst L, Muller R, Roux S, Perriat P, Tillement O. J Am Chem Soc. 2007;129:5076. doi: 10.1021/ja068356j. [DOI] [PubMed] [Google Scholar]
- 46.Evanics F, Diamente PR, van Veggel FCJM, Stanisz GJ, Prosser RS. Chem Mater. 2006;18:2499. [Google Scholar]
- 47.Toth E, Bolskar RD, Borel A, Gonzalez G, Helm L, Merbach AE, Sitharaman B, Wilson LJ. J Am Chem Soc. 2005;127:799. doi: 10.1021/ja044688h. [DOI] [PubMed] [Google Scholar]
- 48.Park JY, Baek MJ, Choi ES, Woo S, Kim JH, Kim TJ, Jung JC, Chae KS, Chang Y, Lee GH. ACS Nano. 2009;3:3663. doi: 10.1021/nn900761s. [DOI] [PubMed] [Google Scholar]
- 49.Johnson NJJ, Oakden W, Stanisz GJ, Scott Prosser R, van Veggel FCJM. Chem Mater. 2011;23:3714. [Google Scholar]
- 50.Silva AC, Lee JH, Aoki I, Koretsky AP. NMR Biomed. 2004;17:532. doi: 10.1002/nbm.945. [DOI] [PubMed] [Google Scholar]
- 51.Ma Z, Jia X, Bai J, Ruan Y, Wang C, Li J, Zhang M, Jiang X. Adv Funct Mater. 2017;27:1604258. [Google Scholar]
- 52.Mi P, Kokuryo D, Cabral H, Wu H, Terada Y, Saga T, Aoki I, Nishiyama N, Kataoka K. Nat Nanotechnol. 2016;11:724. doi: 10.1038/nnano.2016.72. [DOI] [PubMed] [Google Scholar]
- 53.Fan W, Bu W, Shen B, He Q, Cui Z, Liu Y, Zheng X, Zhao K, Shi J. Adv Mater. 2015;27:4155. doi: 10.1002/adma.201405141. [DOI] [PubMed] [Google Scholar]
- 54.Zhao Z, Fan H, Zhou G, Bai H, Liang H, Wang R, Zhang X, Tan W. J Am Chem Soc. 2014;136:11220. doi: 10.1021/ja5029364. [DOI] [PubMed] [Google Scholar]
- 55.Chen Y, Ye D, Wu M, Chen H, Zhang L, Shi J, Wang L. Adv Mater. 2014;26:7019. doi: 10.1002/adma.201402572. [DOI] [PubMed] [Google Scholar]
- 56.Chen Y, Xu P, Shu Z, Wu M, Wang L, Zhang S, Zheng Y, Chen H, Wang J, Li Y, Shi J. Adv Funct Mater. 2014;24:4386. [Google Scholar]
- 57.Liu ZJ, Song XX, Tang Q. Nanoscale. 2013;5:5073. doi: 10.1039/c3nr00721a. [DOI] [PubMed] [Google Scholar]
- 58.Kim SM, Im GH, Lee DG, Lee JH, Lee WJ, Lee IS. Biomaterials. 2013;34:8941. doi: 10.1016/j.biomaterials.2013.08.009. [DOI] [PubMed] [Google Scholar]
- 59.Létourneau M, Tremblay M, Faucher L, Rojas D, Chevallier P, Gossuin Y, Lagueux J, Fortin M-A. J Phys Chem B. 2012;116:13228. doi: 10.1021/jp3032918. [DOI] [PubMed] [Google Scholar]
- 60.Lee YC, Chen DY, Dodd SJ, Bouraoud N, Koretsky AP, Krishnan KM. Biomaterials. 2012;33:3560. doi: 10.1016/j.biomaterials.2012.01.062. [DOI] [PMC free article] [PubMed] [Google Scholar]
- 61.Chen Y, Yin Q, Ji XF, Zhang SJ, Chen HR, Zheng YY, Sun Y, Qu HY, Wang Z, Li YP, Wang X, Zhang K, Zhang LL, Shi JL. Biomaterials. 2012;33:7126. doi: 10.1016/j.biomaterials.2012.06.059. [DOI] [PubMed] [Google Scholar]
- 62.Kim T, Momin E, Choi J, Yuan K, Zaidi H, Kim J, Park M, Lee N, McMahon MT, Quinones-Hinojosa A, Bulte JW, Hyeon T, Gilad AA. J Am Chem Soc. 2011;133:2955. doi: 10.1021/ja1084095. [DOI] [PMC free article] [PubMed] [Google Scholar]
- 63.Kim T, Cho EJ, Chae Y, Kim M, Oh A, Jin J, Lee ES, Baik H, Haam S, Suh JS, Huh YM, Lee K. Angew Chem Int Ed. 2011;50:10589. doi: 10.1002/anie.201103108. [DOI] [PubMed] [Google Scholar]
- 64.Chen Y, Chen H, Sun Y, Zheng Y, Zeng D, Li F, Zhang S, Wang X, Zhang K, Ma M, He Q, Zhang L, Shi J. Angew Chem Int Ed. 2011;50:12505. doi: 10.1002/anie.201106180. [DOI] [PubMed] [Google Scholar]
- 65.Bennewitz MF, Lobo TL, Nkansah MK, Ulas G, Brudvig GW, Shapiro EM. ACS Nano. 2011;5:3438. doi: 10.1021/nn1019779. [DOI] [PMC free article] [PubMed] [Google Scholar]
- 66.Yang H, Zhuang Y, Hu H, Du X, Zhang C, Shi X, Wu H, Yang S. Adv Funct Mater. 2010;20:1733. [Google Scholar]
- 67.Schladt TD, Shukoor MI, Schneider K, Tahir MN, Natalio F, Ament I, Becker J, Jochum FD, Weber S, Köhler O. Angew Chem Int Ed. 2010;49:3976. doi: 10.1002/anie.200906689. [DOI] [PubMed] [Google Scholar]
- 68.Shin J, Anisur RM, Ko MK, Im GH, Lee JH, Lee IS. Angew Chem Int Ed. 2009;48:321. doi: 10.1002/anie.200802323. [DOI] [PubMed] [Google Scholar]
- 69.Na HB, Lee JH, An K, Park YI, Park M, Lee IS, Nam DH, Kim ST, Kim SH, Kim SW, Lim KH, Kim KS, Kim SO, Hyeon T. Angew Chem Int Ed. 2007;46:5397. doi: 10.1002/anie.200604775. [DOI] [PubMed] [Google Scholar]
- 70.Norek M, Kampert E, Zeitler U, Peters JA. J Am Chem Soc. 2008;130:5335. doi: 10.1021/ja711492y. [DOI] [PubMed] [Google Scholar]
- 71.Norek M, Peters JA. Prog Nucl Magn Reson Spectrosc. 2011;59:64. doi: 10.1016/j.pnmrs.2010.08.002. [DOI] [PubMed] [Google Scholar]
- 72.Kattel K, Park JY, Xu W, Kim HG, Lee EJ, Bony BA, Heo WC, Jin S, Baeck JS, Chang Y, Kim TJ, Bae JE, Chae KS, Lee GH. Biomaterials. 2012;33:3254. doi: 10.1016/j.biomaterials.2012.01.008. [DOI] [PubMed] [Google Scholar]
- 73.Das GK, Zhang Y, D’Silva L, Padmanabhan P, Heng BC, Chye Loo JS, Selvan ST, Bhakoo KK, Yang Tan TT. Chem Mater. 2011;23:2439. [Google Scholar]
- 74.Kattel K, Park JY, Xu W, Kim HG, Lee EJ, Bony BA, Heo WC, Lee JJ, Jin S, Baeck JS, Chang Y, Kim TJ, Bae JE, Chae KS, Lee GH. ACS Appl Mater Interfaces. 2011;3:3325. doi: 10.1021/am200437r. [DOI] [PubMed] [Google Scholar]
- 75.Kolosnjaj-Tabi J, Lartigue L, Javed Y, Luciani N, Pellegrino T, Wilhelm C, Alloyeau D, Gazeau F. Nano Today. 2016;11:280. [Google Scholar]
- 76.Xie J, Chen K, Lee HY, Xu C, Hsu AR, Peng S, Chen X, Sun S. J Am Chem Soc. 2008;130:7542. doi: 10.1021/ja802003h. [DOI] [PMC free article] [PubMed] [Google Scholar]
- 77.Gao J, Liang G, Cheung JS, Pan Y, Kuang Y, Zhao F, Zhang B, Zhang X, Wu EX, Xu B. J Am Chem Soc. 2008;130:11828. doi: 10.1021/ja803920b. [DOI] [PubMed] [Google Scholar]
- 78.Park J, An K, Hwang Y, Park JG, Noh HJ, Kim JY, Park JH, Hwang NM, Hyeon T. Nat Mater. 2004;3:891. doi: 10.1038/nmat1251. [DOI] [PubMed] [Google Scholar]
- 79.Jun Y-W, Huh Y-M, Choi J-S, Lee J-H, Song H-T, Kim S, Yoon S, Kim K-S, Shin J-S, Suh J-S, Cheon J. J Am Chem Soc. 2005;127:5732. doi: 10.1021/ja0422155. [DOI] [PubMed] [Google Scholar]
- 80.Mohapatra J, Mitra A, Tyagi H, Bahadur D, Aslam M. Nanoscale. 2015;7:9174. doi: 10.1039/c5nr00055f. [DOI] [PubMed] [Google Scholar]
- 81.Joshi HM, Lin YP, Aslam M, Prasad PV, Schultz-Sikma EA, Edelman R, Meade T, Dravid VP. J Phys Chem C. 2009;113:17761. doi: 10.1021/jp905776g. [DOI] [PMC free article] [PubMed] [Google Scholar]
- 82.Song Q, Zhang ZJ. J Am Chem Soc. 2004;126:6164. doi: 10.1021/ja049931r. [DOI] [PubMed] [Google Scholar]
- 83.Jang JT, Nah H, Lee JH, Moon SH, Kim MG, Cheon J. Angew Chem Int Ed. 2009;48:1234. doi: 10.1002/anie.200805149. [DOI] [PubMed] [Google Scholar]
- 84.Lee JH, Huh YM, Jun YW, Seo JW, Jang JT, Song HT, Kim S, Cho EJ, Yoon HG, Suh JS, Cheon J. Nat Med. 2007;13:95. doi: 10.1038/nm1467. [DOI] [PubMed] [Google Scholar]
- 85.Tsitovich PB, Spernyak JA, Morrow JR. Angew Chem Int Ed. 2013;52:13997. doi: 10.1002/anie.201306394. [DOI] [PMC free article] [PubMed] [Google Scholar]
- 86.Funk AM, Clavijo Jordan V, Sherry AD, Ratnakar SJ, Kovacs Z. Angew Chem Int Ed. 2016;55:5024. doi: 10.1002/anie.201511649. [DOI] [PMC free article] [PubMed] [Google Scholar]
- 87.Aime S, Fasano M, Terreno E. Chem Soc Rev. 1998;27:19. [Google Scholar]
- 88.Solomon I. Phys Rev. 1955;99:559. [Google Scholar]
- 89.Debroye E, Parac-Vogt TN. Chem Soc Rev. 2014;43:8178. doi: 10.1039/c4cs00201f. [DOI] [PubMed] [Google Scholar]
- 90.Tsai CP, Hung Y, Chou YH, Huang DM, Hsiao JK, Chang C, Chen YC, Mou CY. Small. 2008;4:186. doi: 10.1002/smll.200700457. [DOI] [PubMed] [Google Scholar]
- 91.Taylor KM, Kim JS, Rieter WJ, An H, Lin W. J Am Chem Soc. 2008;130:2154. doi: 10.1021/ja710193c. [DOI] [PubMed] [Google Scholar]
- 92.Hsiao JK, Tsai CP, Chung TH, Hung Y, Yao M, Liu HM, Mou CY, Yang CS, Chen YC, Huang DM. Small. 2008;4:1445. doi: 10.1002/smll.200701316. [DOI] [PubMed] [Google Scholar]
- 93.Endres PJ, Paunesku T, Vogt S, Meade TJ, Woloschak GE. J Am Chem Soc. 2007;129:15760. doi: 10.1021/ja0772389. [DOI] [PubMed] [Google Scholar]
- 94.Culver KSB, Shin YJ, Rotz MW, Meade TJ, Hersam MC, Odom TW. J Phys Chem C. 2016;120:22103. doi: 10.1021/acs.jpcc.6b08362. [DOI] [PMC free article] [PubMed] [Google Scholar]
- 95.Rotz MW, Culver KS, Parigi G, MacRenaris KW, Luchinat C, Odom TW, Meade TJ. ACS Nano. 2015;9:3385. doi: 10.1021/nn5070953. [DOI] [PMC free article] [PubMed] [Google Scholar]
- 96.Bruckman MA, Yu X, Steinmetz NF. Nanotechnology. 2013;24:462001. doi: 10.1088/0957-4484/24/46/462001. [DOI] [PMC free article] [PubMed] [Google Scholar]
- 97.Song Y, Xu X, MacRenaris KW, Zhang XQ, Mirkin CA, Meade TJ. Angew Chem Int Ed. 2009;48:9143. doi: 10.1002/anie.200904666. [DOI] [PMC free article] [PubMed] [Google Scholar]
- 98.Alric C, Taleb J, Le Duc G, Mandon C, Billotey C, Le Meur-Herland A, Brochard T, Vocanson F, Janier M, Perriat P, Roux S, Tillement O. J Am Chem Soc. 2008;130:5908. doi: 10.1021/ja078176p. [DOI] [PubMed] [Google Scholar]
- 99.Helm L, Merbach A. Coord Chem Rev. 1999;187:151. [Google Scholar]
- 100.Aime S, Barge A, Borel A, Botta M, Chemerisov S, Merbach AE, Müller U, Pubanz D. Inorg Chem. 1997;36:5104. doi: 10.1021/ic961364o. [DOI] [PubMed] [Google Scholar]
- 101.Pierre VC, Botta M, Aime S, Raymond KN. Inorg Chem. 2006;45:8355. doi: 10.1021/ic061262q. [DOI] [PMC free article] [PubMed] [Google Scholar]
- 102.Gillis P, Koenig SH. Magn Reson Med. 1987;5:323. doi: 10.1002/mrm.1910050404. [DOI] [PubMed] [Google Scholar]
- 103.Gillis P, Moiny F, Brooks RA. Magn Reson Med. 2002;47:257. doi: 10.1002/mrm.10059. [DOI] [PubMed] [Google Scholar]
- 104.Brooks RA, Moiny F, Gillis P. Magn Reson Med. 2001;45:1014. doi: 10.1002/mrm.1135. [DOI] [PubMed] [Google Scholar]
- 105.Tong S, Hou S, Zheng Z, Zhou J, Bao G. Nano Lett. 2010;10:4607. doi: 10.1021/nl102623x. [DOI] [PMC free article] [PubMed] [Google Scholar]
- 106.Willets KA, Van Duyne RP. Annu Rev Phys Chem. 2007;58:267. doi: 10.1146/annurev.physchem.58.032806.104607. [DOI] [PubMed] [Google Scholar]
- 107.Luther JM, Jain PK, Ewers T, Alivisatos AP. Nat Mater. 2011;10:361. doi: 10.1038/nmat3004. [DOI] [PubMed] [Google Scholar]
- 108.Alivisatos AP. Science. 1996;271:933. [Google Scholar]
- 109.Kodama R. J Magn Magn Mater. 1999;200:359. [Google Scholar]
- 110.Tong S, Quinto CA, Zhang L, Mohindra P, Bao G. ACS Nano. 2017;11:6808. doi: 10.1021/acsnano.7b01762. [DOI] [PubMed] [Google Scholar]
- 111.Lu F, Wu SH, Hung Y, Mou CY. Small. 2009;5:1408. doi: 10.1002/smll.200900005. [DOI] [PubMed] [Google Scholar]
- 112.Sonavane G, Tomoda K, Makino K. Colloids Surf B. 2008;66:274. doi: 10.1016/j.colsurfb.2008.07.004. [DOI] [PubMed] [Google Scholar]
- 113.Briley-Saebo KC, Johansson LO, Hustvedt SO, Haldorsen AG, Bjørnerud A, Fayad ZA, Ahlstrom HK. Invest Radiol. 2006;41:560. doi: 10.1097/01.rli.0000221321.90261.09. [DOI] [PubMed] [Google Scholar]
- 114.Hoshyar N, Gray S, Han H, Bao G. Nanomedicine. 2016;11:673. doi: 10.2217/nnm.16.5. [DOI] [PMC free article] [PubMed] [Google Scholar]
- 115.Talamini L, Violatto MB, Cai Q, Monopoli MP, Kantner K, Krpetic Z, Perez-Potti A, Cookman J, Garry D, Silveira CP, Boselli L, Pelaz B, Serchi T, Cambier S, Gutleb AC, Feliu N, Yan Y, Salmona M, Parak WJ, Dawson KA, Bigini P. ACS Nano. 2017;11:5519. doi: 10.1021/acsnano.7b00497. [DOI] [PubMed] [Google Scholar]
- 116.Huang C-C, Su C-H, Li W-M, Liu T-Y, Chen J-H, Yeh C-S. Adv Funct Mater. 2009;19:249. [Google Scholar]
- 117.Passuello T, Pedroni M, Piccinelli F, Polizzi S, Marzola P, Tambalo S, Conti G, Benati D, Vetrone F, Bettinelli M. Nanoscale. 2012;4:7682. doi: 10.1039/c2nr31796f. [DOI] [PubMed] [Google Scholar]
- 118.Zheng X-Y, Sun L-D, Zheng T, Dong H, Li Y, Wang Y-F, Yan C-H. Sci Bull. 2015;60:1092. [Google Scholar]
- 119.Li I-F, Yeh C-S. J Mater Chem. 2010;20:2079. [Google Scholar]
- 120.Liu Y, Ai K, Yuan Q, Lu L. Biomaterials. 2011;32:1185. doi: 10.1016/j.biomaterials.2010.10.022. [DOI] [PubMed] [Google Scholar]
- 121.Guo W, Yang W, Wang Y, Sun X, Liu Z, Zhang B, Chang J, Chen X. Nano Res. 2014;7:1581. doi: 10.1007/s12274-014-0518-8. [DOI] [PMC free article] [PubMed] [Google Scholar]
- 122.Zhang F, Sun T-T, Zhang Y, Li Q, Chai C, Lu L, Shen W, Yang J, He X-W, Zhang Y-K. J Mater Chem B. 2014;2:7201. doi: 10.1039/c4tb00920g. [DOI] [PubMed] [Google Scholar]
- 123.Mulder WJ, Koole R, Brandwijk RJ, Storm G, Chin PT, Strijkers GJ, de Mello Donega C, Nicolay K, Griffioen AW. Nano Lett. 2006;6:1. doi: 10.1021/nl051935m. [DOI] [PubMed] [Google Scholar]
- 124.Kumar R, Nyk M, Ohulchanskyy TY, Flask CA, Prasad PN. Adv Funct Mater. 2009;19:853. [Google Scholar]
- 125.Park YI, Kim HM, Kim JH, Moon KC, Yoo B, Lee KT, Lee N, Choi Y, Park W, Ling D, Na K, Moon WK, Choi SH, Park HS, Yoon SY, Suh YD, Lee SH, Hyeon T. Adv Mater. 2012;24:5755. doi: 10.1002/adma.201202433. [DOI] [PubMed] [Google Scholar]
- 126.Naccache R, Chevallier P, Lagueux J, Gossuin Y, Laurent S, Vander Elst L, Chilian C, Capobianco JA, Fortin MA. Adv Healthcare Mater. 2013;2:1478. doi: 10.1002/adhm.201370057. [DOI] [PubMed] [Google Scholar]
- 127.Du F, Zhang L, Zhang L, Zhang M, Gong A, Tan Y, Miao J, Gong Y, Sun M, Ju H. Biomaterials. 2017;121:109. doi: 10.1016/j.biomaterials.2016.07.008. [DOI] [PubMed] [Google Scholar]
- 128.Yu C, Xuan T, Chen Y, Zhao Z, Liu X, Lian G, Li H. J Alloys Compd. 2016;688:611. [Google Scholar]
- 129.Zhou L, Yang T, Wang J, Wang Q, Lv X, Ke H, Guo Z, Shen J, Wang Y, Xing C, Chen H. Theranostics. 2017;7:764. doi: 10.7150/thno.15757. [DOI] [PMC free article] [PubMed] [Google Scholar]
- 130.Le Duc G, Miladi I, Alric C, Mowat P, Brauer-Krisch E, Bouchet A, Khalil E, Billotey C, Janier M, Lux F, Epicier T, Perriat P, Roux S, Tillement O. ACS Nano. 2011;5:9566. doi: 10.1021/nn202797h. [DOI] [PubMed] [Google Scholar]
- 131.Viger ML, Sankaranarayanan J, Lux CD, Chan M, Almutairi A. J Am Chem Soc. 2013;135:7847. doi: 10.1021/ja403167p. [DOI] [PMC free article] [PubMed] [Google Scholar]
- 132.An K, Park M, Yu JH, Na HB, Lee N, Park J, Choi SH, Song IC, Moon WK, Hyeon T. Eur J Inorg Chem. 2012:2148. [Google Scholar]
- 133.Li B, Gu Z, Kurniawan N, Chen W, Xu ZP. Adv Mater. 2017 doi: 10.1002/adma.201700373. [DOI] [PubMed] [Google Scholar]
- 134.Seo WS, Jo HH, Lee K, Kim B, Oh SJ, Park JT. Angew Chem Int Ed. 2004;43:1115. doi: 10.1002/anie.200352400. [DOI] [PubMed] [Google Scholar]
- 135.Kim BH, Lee N, Kim H, An K, Park YI, Choi Y, Shin K, Lee Y, Kwon SG, Na HB, Park JG, Ahn TY, Kim YW, Moon WK, Choi SH, Hyeon T. J Am Chem Soc. 2011;133:12624. doi: 10.1021/ja203340u. [DOI] [PubMed] [Google Scholar]
- 136.Zhang H, Li L, Liu XL, Jiao J, Ng CT, Yi JB, Luo YE, Bay BH, Zhao LY, Peng ML, Gu N, Fan HM. ACS Nano. 2017;11:3614. doi: 10.1021/acsnano.6b07684. [DOI] [PubMed] [Google Scholar]
- 137.Zhao Z, Zhou Z, Bao J, Wang Z, Hu J, Chi X, Ni K, Wang R, Chen X, Chen Z, Gao J. Nat Commun. 2013;4:2266. doi: 10.1038/ncomms3266. [DOI] [PubMed] [Google Scholar]
- 138.Huang J, Bu L, Xie J, Chen K, Cheng Z, Li X, Chen X. ACS Nano. 2010;4:7151. doi: 10.1021/nn101643u. [DOI] [PMC free article] [PubMed] [Google Scholar]
- 139.Chen Y, Chen HR, Zhang SJ, Chen F, Sun SK, He QJ, Ma M, Wang X, Wu HX, Zhang LX, Zhang LL, Shi JL. Biomaterials. 2012;33:2388. doi: 10.1016/j.biomaterials.2011.11.086. [DOI] [PubMed] [Google Scholar]
- 140.Liu J, Bu J, Bu W, Zhang S, Pan L, Fan W, Chen F, Zhou L, Peng W, Zhao K, Du J, Shi J. Angew Chem Int Ed. 2014;53:4551. doi: 10.1002/anie.201400900. [DOI] [PubMed] [Google Scholar]
- 141.Tromsdorf UI, Bruns OT, Salmen SC, Beisiegel U, Weller H. Nano Lett. 2009;9:4434. doi: 10.1021/nl902715v. [DOI] [PubMed] [Google Scholar]
- 142.Wei H, Bruns OT, Kaul MG, Hansen EC, Barch M, Wisniowska A, Chen O, Chen Y, Li N, Okada S, Cordero JM, Heine M, Farrar CT, Montana DM, Adam G, Ittrich H, Jasanoff A, Nielsen P, Bawendi MG. Proc Natl Acad Sci U S A. 2017;114:2325. doi: 10.1073/pnas.1620145114. [DOI] [PMC free article] [PubMed] [Google Scholar]
- 143.Wu M, Meng Q, Chen Y, Xu P, Zhang S, Li Y, Zhang L, Wang M, Yao H, Shi J. Adv Funct Mater. 2014;24:4273. [Google Scholar]
- 144.Moon SH, Noh SH, Lee JH, Shin TH, Lim Y, Cheon J. Nano Lett. 2017;17:800. doi: 10.1021/acs.nanolett.6b04016. [DOI] [PubMed] [Google Scholar]
- 145.Yablonskiy DA, Haacke EM. Magn Reson Med. 1994;32:749. doi: 10.1002/mrm.1910320610. [DOI] [PubMed] [Google Scholar]
- 146.Seo WS, Lee JH, Sun X, Suzuki Y, Mann D, Liu Z, Terashima M, Yang PC, McConnell MV, Nishimura DG, Dai H. Nat Mater. 2006;5:971. doi: 10.1038/nmat1775. [DOI] [PubMed] [Google Scholar]
- 147.Tromsdorf UI, Bigall NC, Kaul MG, Bruns OT, Nikolic MS, Mollwitz B, Sperling RA, Reimer R, Hohenberg H, Parak WJ, Förster S, Beisiegel U, Adam G, Weller H. Nano Lett. 2007;7:2422. doi: 10.1021/nl071099b. [DOI] [PubMed] [Google Scholar]
- 148.Duan H, Kuang M, Wang X, Wang YA, Mao H, Nie S. J Phys Chem C. 2008;112:8127. [Google Scholar]
- 149.Zeng J, Jing L, Hou Y, Jiao M, Qiao R, Jia Q, Liu C, Fang F, Lei H, Gao M. Adv Mater. 2014;26:2694. doi: 10.1002/adma.201304744. [DOI] [PubMed] [Google Scholar]
- 150.Bowen CV, Zhang X, Saab G, Gareau PJ, Rutt BK. Magn Reson Med. 2002;48:52. doi: 10.1002/mrm.10192. [DOI] [PubMed] [Google Scholar]
- 151.Roch A, Gossuin Y, Muller RN, Gillis P. J Magn Magn Mater. 2005;293:532. [Google Scholar]
- 152.Suk JS, Xu Q, Kim N, Hanes J, Ensign LM. Adv Drug Delivery Rev. 2016;99:28. doi: 10.1016/j.addr.2015.09.012. [DOI] [PMC free article] [PubMed] [Google Scholar]
- 153.Xu Q, Ensign LM, Boylan NJ, Schon A, Gong X, Yang JC, Lamb NW, Cai S, Yu T, Freire E, Hanes J. ACS Nano. 2015;9:9217. doi: 10.1021/acsnano.5b03876. [DOI] [PMC free article] [PubMed] [Google Scholar]
- 154.Liu J, Yu M, Ning X, Zhou C, Yang S, Zheng J. Angew Chem Int Ed. 2013;52:12572. doi: 10.1002/anie.201304465. [DOI] [PMC free article] [PubMed] [Google Scholar]
- 155.Otsuka H, Nagasaki Y, Kataoka K. Adv Drug Delivery Rev. 2003;55:403. doi: 10.1016/s0169-409x(02)00226-0. [DOI] [PubMed] [Google Scholar]
- 156.Chen Y, Chen H, Shi J. Adv Mater. 2013;25:3144. doi: 10.1002/adma.201205292. [DOI] [PubMed] [Google Scholar]
- 157.Liu JN, Bu WB, Shi JL. Acc Chem Res. 2015;48:1797. doi: 10.1021/acs.accounts.5b00078. [DOI] [PubMed] [Google Scholar]
- 158.Chen WH, Luo GF, Lei Q, Cao FY, Fan JX, Qiu WX, Jia HZ, Hong S, Fang F, Zeng X, Zhuo RX, Zhang XZ. Biomaterials. 2016;76:87. doi: 10.1016/j.biomaterials.2015.10.053. [DOI] [PubMed] [Google Scholar]
- 159.Chen F, Bu W, Zhang S, Liu J, Fan W, Zhou L, Peng W, Shi J. Adv Funct Mater. 2013;23:298. [Google Scholar]
- 160.Peng YK, Lai CW, Liu CL, Chen HC, Hsiao YH, Liu WL, Tang KC, Chi Y, Hsiao JK, Lim KE, Liao HE, Shyue JJ, Chou PT. ACS Nano. 2011;5:4177. doi: 10.1021/nn200928r. [DOI] [PubMed] [Google Scholar]
- 161.Cheng L, Yang K, Li Y, Chen J, Wang C, Shao M, Lee ST, Liu Z. Angew Chem Int Ed. 2011;50:7385. doi: 10.1002/anie.201101447. [DOI] [PubMed] [Google Scholar]
- 162.Xia A, Gao Y, Zhou J, Li C, Yang T, Wu D, Wu L, Li F. Biomaterials. 2011;32:7200. doi: 10.1016/j.biomaterials.2011.05.094. [DOI] [PubMed] [Google Scholar]
- 163.Cheong S, Ferguson P, Feindel KW, Hermans IF, Callaghan PT, Meyer C, Slocombe A, Su CH, Cheng FY, Yeh CS, Ingham B, Toney MF, Tilley RD. Angew Chem Int Ed. 2011;50:4206. doi: 10.1002/anie.201100562. [DOI] [PubMed] [Google Scholar]
- 164.Chen F, Bu W, Zhang S, Liu X, Liu J, Xing H, Xiao Q, Zhou L, Peng W, Wang L, Shi J. Adv Funct Mater. 2011;21:4285. [Google Scholar]
- 165.Wang F, Deng R, Liu X. Nat Protoc. 2014;9:1634. doi: 10.1038/nprot.2014.111. [DOI] [PubMed] [Google Scholar]
- 166.Ni D, Zhang J, Bu W, Xing H, Han F, Xiao Q, Yao Z, Chen F, He Q, Liu J, Zhang S, Fan W, Zhou L, Peng W, Shi J. ACS Nano. 2014;8:1231. doi: 10.1021/nn406197c. [DOI] [PubMed] [Google Scholar]
- 167.Kinnear C, Moore TL, Rodriguez-Lorenzo L, Rothen-Rutishauser B, Petri-Fink A. Chem Rev. 2017;117:11476. doi: 10.1021/acs.chemrev.7b00194. [DOI] [PubMed] [Google Scholar]
- 168.Rikken RS, Nolte RJ, Maan JC, van Hest JC, Wilson DA, Christianen PC. Soft Matter. 2014;10:1295. doi: 10.1039/c3sm52294f. [DOI] [PubMed] [Google Scholar]
- 169.Huang X, Teng X, Chen D, Tang F, He J. Biomaterials. 2010;31:438. doi: 10.1016/j.biomaterials.2009.09.060. [DOI] [PubMed] [Google Scholar]
- 170.Chithrani BD, Ghazani AA, Chan WC. Nano Lett. 2006;6:662. doi: 10.1021/nl052396o. [DOI] [PubMed] [Google Scholar]
- 171.Huang X, Li L, Liu T, Hao N, Liu H, Chen D, Tang F. ACS Nano. 2011;5:5390. doi: 10.1021/nn200365a. [DOI] [PubMed] [Google Scholar]
- 172.Albanese A, Tang PS, Chan WC. Annu Rev Biomed Eng. 2012;14:1. doi: 10.1146/annurev-bioeng-071811-150124. [DOI] [PubMed] [Google Scholar]
- 173.Toy R, Peiris PM, Ghaghada KB, Karathanasis E. Nanomedicine. 2014;9:121. doi: 10.2217/nnm.13.191. [DOI] [PMC free article] [PubMed] [Google Scholar]
- 174.Liu C, Gao Z, Zeng J, Hou Y, Fang F, Li Y, Qiao R, Shen L, Lei H, Yang W, Gao M. ACS Nano. 2013;7:7227. doi: 10.1021/nn4030898. [DOI] [PubMed] [Google Scholar]
- 175.Zhao M, Beauregard DA, Loizou L, Davletov B, Brindle KM. Nat Med. 2001;7:1241. doi: 10.1038/nm1101-1241. [DOI] [PubMed] [Google Scholar]
- 176.Yang L, Mao H, Wang YA, Cao Z, Peng X, Wang X, Duan H, Ni C, Yuan Q, Adams G. Small. 2009;5:235. doi: 10.1002/smll.200800714. [DOI] [PMC free article] [PubMed] [Google Scholar]
- 177.Weissleder R, Moore A, Mahmood U, Bhorade R, Benveniste H, Chiocca EA, Basilion JP. Nat Med. 2000;6:351. doi: 10.1038/73219. [DOI] [PubMed] [Google Scholar]
- 178.Louie AY, Huber MM, Ahrens ET, Rothbacher U, Moats R, Jacobs RE, Fraser SE, Meade TJ. Nat Biotechnol. 2000;18:321. doi: 10.1038/73780. [DOI] [PubMed] [Google Scholar]
- 179.Torres E, Mainini F, Napolitano R, Fedeli F, Cavalli R, Aime S, Terreno E. J Controlled Release. 2011;154:196. doi: 10.1016/j.jconrel.2011.05.017. [DOI] [PubMed] [Google Scholar]
- 180.Lim EK, Huh YM, Yang J, Lee K, Suh JS, Haam S. Adv Mater. 2011;23:2436. doi: 10.1002/adma.201100351. [DOI] [PubMed] [Google Scholar]
- 181.Yang X, Grailer JJ, Rowland IJ, Javadi A, Hurley SA, Matson VZ, Steeber DA, Gong S. ACS Nano. 2010;4:6805. doi: 10.1021/nn101670k. [DOI] [PubMed] [Google Scholar]
- 182.Chan KW, Liu G, Song X, Kim H, Yu T, Arifin DR, Gilad AA, Hanes J, Walczak P, van Zijl PC, Bulte JW, McMahon MT. Nat Mater. 2013;12:268. doi: 10.1038/nmat3525. [DOI] [PMC free article] [PubMed] [Google Scholar]
- 183.Nejadnik H, Lenkov O, Gassert F, Fretwell D, Lam I, Daldrup-Link HE. Sci Rep. 2016;6:25897. doi: 10.1038/srep25897. [DOI] [PMC free article] [PubMed] [Google Scholar]
- 184.Nejadnik H, Ye D, Lenkov OD, Donig JS, Martin JE, Castillo R, Derugin N, Sennino B, Rao J, Daldrup-Link H. ACS Nano. 2015;9:1150. doi: 10.1021/nn504494c. [DOI] [PMC free article] [PubMed] [Google Scholar]
- 185.Schwarz S, Wong JE, Bornemann J, Hodenius M, Himmelreich U, Richtering W, Hoehn M, Zenke M, Hieronymus T. Nanomedicine. 2012;8:682. doi: 10.1016/j.nano.2011.08.010. [DOI] [PubMed] [Google Scholar]
- 186.Ananta JS, Godin B, Sethi R, Moriggi L, Liu X, Serda RE, Krishnamurthy R, Muthupillai R, Bolskar RD, Helm L, Ferrari M, Wilson LJ, Decuzzi P. Nat Nanotechnol. 2010;5:815. doi: 10.1038/nnano.2010.203. [DOI] [PMC free article] [PubMed] [Google Scholar]
- 187.Ni K, Zhao Z, Zhang Z, Zhou Z, Yang L, Wang L, Ai H, Gao J. Nanoscale. 2016;8:3768. doi: 10.1039/c5nr08402d. [DOI] [PubMed] [Google Scholar]
- 188.Huang P, Qian X, Chen Y, Yu L, Lin H, Wang L, Zhu Y, Shi J. J Am Chem Soc. 2017;139:1275. doi: 10.1021/jacs.6b11846. [DOI] [PubMed] [Google Scholar]
- 189.Zhang Q, Wang P, Ling Y, Li X, Xia L, Yang Y, Liu X, Zhang F, Zhou Y. Adv Funct Mater. 2017;27:1605313. [Google Scholar]
- 190.Lu AH, Salabas EL, Schuth F. Angew Chem Int Ed. 2007;46:1222. doi: 10.1002/anie.200602866. [DOI] [PubMed] [Google Scholar]
- 191.Chung R-J, Ou K-L, Chen S-P, Liu H-L. Adv Powder Technol. 2016;27:994. [Google Scholar]
- 192.Chou S-W, Liu C-L, Liu T-M, Shen Y-F, Kuo L-C, Wu C-H, Hsieh T-Y, Wu P-C, Tsai M-R, Yang C-C. Biomaterials. 2016;85:54. doi: 10.1016/j.biomaterials.2016.01.053. [DOI] [PubMed] [Google Scholar]
- 193.Sun S. Adv Mater. 2006;18:393. [Google Scholar]
- 194.Chou SW, Shau YH, Wu PC, Yang YS, Shieh DB, Chen CC. J Am Chem Soc. 2010;132:13270. doi: 10.1021/ja1035013. [DOI] [PubMed] [Google Scholar]
- 195.Perez JM, Josephson L, O’Loughlin T, Hogemann D, Weissleder R. Nat Biotechnol. 2002;20:816. doi: 10.1038/nbt720. [DOI] [PubMed] [Google Scholar]
- 196.Gallo J, Kamaly N, Lavdas I, Stevens E, Nguyen QD, Wylezinska-Arridge M, Aboagye EO, Long NJ. Angew Chem Int Ed. 2014;53:9550. doi: 10.1002/anie.201405442. [DOI] [PMC free article] [PubMed] [Google Scholar]
- 197.Yuan Y, Ding Z, Qian J, Zhang J, Xu J, Dong X, Han T, Ge S, Luo Y, Wang Y, Zhong K, Liang G. Nano Lett. 2016;16:2686. doi: 10.1021/acs.nanolett.6b00331. [DOI] [PubMed] [Google Scholar]
- 198.Gao Z, Hou Y, Zeng J, Chen L, Liu C, Yang W, Gao M. Adv Mater. 2017:29. doi: 10.1002/adma.201701095. [DOI] [PubMed] [Google Scholar]
- 199.Liang G, Ronald J, Chen Y, Ye D, Pandit P, Ma ML, Rutt B, Rao J. Angew Chem Int Ed. 2011;50:6283. doi: 10.1002/anie.201007018. [DOI] [PMC free article] [PubMed] [Google Scholar]
- 200.Ye D, Pandit P, Kempen P, Lin J, Xiong L, Sinclair R, Rutt B, Rao J. Bioconjugate Chem. 2014;25:1526. doi: 10.1021/bc500254g. [DOI] [PMC free article] [PubMed] [Google Scholar]
- 201.Ye D, Shuhendler AJ, Pandit P, Brewer KD, Tee SS, Cui L, Tikhomirov G, Rutt B, Rao J. Chem Sci. 2014;4:3845. doi: 10.1039/C4SC01392A. [DOI] [PMC free article] [PubMed] [Google Scholar]
- 202.Berret JF, Schonbeck N, Gazeau F, ElKharrat D, Sandre O, Vacher A, Airiau M. J Am Chem Soc. 2006;128:1755. doi: 10.1021/ja0562999. [DOI] [PubMed] [Google Scholar]
- 203.Ai H, Flask C, Weinberg B, Shuai XT, Pagel MD, Farrell D, Duerk J, Gao J. Adv Mater. 2005;17:1949. [Google Scholar]
- 204.Chen H, Yeh J, Wang L, Khurshid H, Peng N, Wang AY, Mao H. Nano Res. 2010;3:852. [Google Scholar]
- 205.Wang L, Huang J, Chen H, Wu H, Xu Y, Li Y, Yi H, Wang YA, Yang L, Mao H. ACS Nano. 2017;11:4582. doi: 10.1021/acsnano.7b00038. [DOI] [PMC free article] [PubMed] [Google Scholar]
- 206.Martinelli J, Fekete M, Tei L, Botta M. Chem Commun. 2011;47:3144. doi: 10.1039/c0cc05428c. [DOI] [PubMed] [Google Scholar]
- 207.Kim MH, Son HY, Kim GY, Park K, Huh YM, Haam S. Biomaterials. 2016;101:121. doi: 10.1016/j.biomaterials.2016.05.054. [DOI] [PubMed] [Google Scholar]
- 208.Yu L, Chen Y, Wu M, Cai X, Yao H, Zhang L, Chen H, Shi J. J Am Chem Soc. 2016;138:9881. doi: 10.1021/jacs.6b04299. [DOI] [PubMed] [Google Scholar]
- 209.Loving GS, Mukherjee S, Caravan P. J Am Chem Soc. 2013;135:4620. doi: 10.1021/ja312610j. [DOI] [PMC free article] [PubMed] [Google Scholar]
- 210.Deng R, Xie X, Vendrell M, Chang YT, Liu X. J Am Chem Soc. 2011;133:20168. doi: 10.1021/ja2100774. [DOI] [PubMed] [Google Scholar]
- 211.Chu C, Lin H, Liu H, Wang X, Wang J, Zhang P, Gao H, Huang C, Zeng Y, Tan Y, Liu G, Chen X. Adv Mater. 2017:29. doi: 10.1002/adma.201605928. [DOI] [PMC free article] [PubMed] [Google Scholar]
- 212.Shi J. Chem Rev. 2013;113:2139. doi: 10.1021/cr3002752. [DOI] [PubMed] [Google Scholar]
- 213.Choi JS, Kim S, Yoo D, Shin TH, Kim H, Gomes MD, Kim SH, Pines A, Cheon J. Nat Mater. 2017;16:537. doi: 10.1038/nmat4846. [DOI] [PubMed] [Google Scholar]
- 214.Zhou Z, Tian R, Wang Z, Yang Z, Liu Y, Liu G, Wang R, Gao J, Song J, Nie L, Chen X. Nat Commun. 2017;8:15468. doi: 10.1038/ncomms15468. [DOI] [PMC free article] [PubMed] [Google Scholar]
- 215.Yu M, Zheng J. ACS Nano. 2015;9:6655. doi: 10.1021/acsnano.5b01320. [DOI] [PMC free article] [PubMed] [Google Scholar]
- 216.Ehlerding EB, Chen F, Cai W. Adv Sci. 2016;3 doi: 10.1002/advs.201500223. [DOI] [PMC free article] [PubMed] [Google Scholar]
- 217.Liu JN, Bu W, Shi J. Chem Rev. 2017;117:6160. doi: 10.1021/acs.chemrev.6b00525. [DOI] [PubMed] [Google Scholar]
- 218.Dai Y, Xu C, Sun X, Chen X. Chem Soc Rev. 2017;46:3830. doi: 10.1039/c6cs00592f. [DOI] [PMC free article] [PubMed] [Google Scholar]
- 219.Song G, Liang C, Yi X, Zhao Q, Cheng L, Yang K, Liu Z. Adv Mater. 2016;28:2716. doi: 10.1002/adma.201504617. [DOI] [PubMed] [Google Scholar]
- 220.Song G, Chen Y, Liang C, Yi X, Liu J, Sun X, Shen S, Yang K, Liu Z. Adv Mater. 2016;28:7143. doi: 10.1002/adma.201602111. [DOI] [PubMed] [Google Scholar]
- 221.Chen Q, Feng L, Liu J, Zhu W, Dong Z, Wu Y, Liu Z. Adv Mater. 2016;28:7129. doi: 10.1002/adma.201601902. [DOI] [PubMed] [Google Scholar]
- 222.Liu YY, Liu Y, Bu WB, Cheng C, Zuo CJ, Xiao QF, Sun Y, Ni DL, Zhang C, Liu JA, Shi JL. Angew Chem Int Ed. 2015;54:8105. doi: 10.1002/anie.201500478. [DOI] [PubMed] [Google Scholar]
- 223.Di Gregorio E, Ferrauto G, Gianolio E, Lanzardo S, Carrera C, Fedeli F, Aime S. ACS Nano. 2015;9:8239. doi: 10.1021/acsnano.5b02604. [DOI] [PubMed] [Google Scholar]
- 224.Tanabe K, Harada H, Narazaki M, Tanaka K, Inafuku K, Komatsu H, Ito T, Yamada H, Chujo Y, Matsuda T. J Am Chem Soc. 2009;131:15982. doi: 10.1021/ja904953b. [DOI] [PubMed] [Google Scholar]