

Abstract
In the present study, we sought to identify lncRNA expression profiles in NASH patients with histological evidence of lobular inflammation and advanced fibrosis. We profiled lncRNA expression using RNA-sequencing of wedge liver biopsies from 24 NAFLD patients with normal liver histology, 53 NAFLD patients with lobular inflammation, and 65 NAFLD patients with advanced fibrosis. Transcript profiling identified 4432 and 4057 differentially expressed lncRNAs in comparisons of normal tissue with lobular inflammation and fibrosis samples, respectively. Functional enrichment analysis revealed lncRNA participation in TGFB1 and TNF signaling, insulin resistance, and extracellular matrix maintenance. Several lncRNAs were highly expressed in fibrosis relative to normal tissue, including nuclear paraspeckle assembly transcript 1 (NEAT1), hepatocellular carcinoma upregulated lncRNA (HULC), and metastasis-associated lung adenocarcinoma transcript 1 (MALAT1). Two potential target mRNAs, syndecan 4 (SDC4) and C-X-C motif chemokine ligand 5 (CXCL5) were identified for HULC and MALAT1, respectively, but only CXCL5 showed differential expression among the different histological classes. Knockdown of MALAT1 expression reduced CXCL5 transcript and protein levels by 50% and 30%, respectively, in HepG2 cells. Expression of MALAT1 and CXCL5 was upregulated in activated hepatic stellate (LX-2) cells compared to cells in the quiescent state, and MALAT1 expression was regulated by hyperglycemia and insulin in HepG2 cells, but only by insulin in LX-2 cells. Dysregulated lncRNA expression is associated with inflammation and fibrosis in NASH. Functionally relevant differences in MALAT1 expression may contribute to the development of fibrosis in NASH through mechanisms involving inflammatory chemokines.
Keywords: nonalcoholic steatohepatitis, liver fibrosis, noncoding RNA, epigenetic, gene regulation, RNA-sequencing, liver biopsy, obesity, chemokine, MALAT1, CXCL5
Introduction
Nonalcoholic steatohepatitis (NASH) is a clinically severe manifestation of nonalcoholic fatty liver disease (NAFLD), characterized by significant liver inflammation and hepatic fibrosis [1]. NASH is recognized as the major cause of chronic liver disease and a leading determinant of cryptogenic cirrhosis [2], and is projected to become the most common indication for liver transplantation within the next few years [3]. Clinical outcomes for NASH patients contribute to greater liver-related morbidity and mortality in affected patients [4, 5]. Obesity [6], insulin resistance and type 2 diabetes (T2D) [7, 8], oxidative stress [9], pro-inflammatory cytokines [10, 11], and immune response [12, 13] are associated with the coincident development of inflammation and fibrosis in NAFLD patients, although to date, the molecular mechanisms underlying the progression to NASH remain poorly defined. Given the strong link between fibrosis and heightened risk of cirrhosis and liver-related mortality in NASH patients [14, 15], studies to identify and characterize the specific mechanisms contributing to disease progression are critical for the development of new therapies to delay, halt, or reverse hepatic fibrosis.
The approach of characterizing gene expression in NAFLD and NASH has long been utilized to better understand the molecular basis of disease development [16, 17]. For example, in humans, gene expression patterns clearly separated steatohepatitis from steatosis and normal liver [18], mild fibrosis and septal fibrosis [19], and low versus high levels of steatosis [20]. Changes in both DNA methylation and gene expression have also been associated with the presence of NAFLD [21, 22], and to date, many potential gene candidates have emerged from these studies. However, a significantly greater percentage of the human transcriptome is transcribed as noncoding RNA (ncRNA) compared to protein-coding RNA [23, 24] and these ncRNAs are emerging as potent regulators of gene expression and disease pathogenesis. Long ncRNAs (lncRNAs) represent a specific class of ncRNA molecules with transcript lengths >200 nucleotides. While lncRNAs are post-transcriptionally modified in a manner similar to mRNA, they are not translated into protein [25–27], and instead serve key regulatory roles, such as mediating activity or localization of proteins, providing organizational scaffolds for subcellular structures, modulating transcriptional programs, and regulating miRNA expression [27–30]. Little is known of the role of lncRNAs in the development or progression of NAFLD, although growing evidence suggests these molecules contribute to many of the pathophysiological mechanisms underlying the disease. For example, levels of the lncRNA, maternally expressed gene 3 (MEG3), were significantly decreased in a CCl4-induced mouse liver fibrosis model and in human liver fibrosis of undisclosed etiology [31]. Another lncRNA, Alu-mediated p21 transcriptional regulator (APTR), was found to be upregulated in human cirrhosis and activated hepatic stellate cells [32]. Expression of metastasis-associated lung adenocarcinoma transcript 1 (MALAT1) was increased in livers of ob/ob mice, as well as hepatocytes exposed to palmitate [33]. These investigations of single lncRNAs provide a further rationale for the analysis of global changes in lncRNA expression in NAFLD and NASH.
To our knowledge, only a single study has performed a genome-wide analysis of lncRNA expression in NAFLD patients. Sun et al [34] profiled lncRNA expression in liver samples from five patients with NAFLD and five patients without NAFLD, and found that ~2000 lncRNAs were differentially expressed between the two groups. While this study represented an important first step in delineating lncRNA expression patterns in NAFLD, it was limited by a very small sample size, utilization of microarray analysis, and a focus on NAFLD, not NASH.
To better understand the role of lncRNAs in NASH, we performed sequencing-based lncRNA profiling analysis of liver samples from NAFLD patients with coincident lobular inflammation, advanced fibrosis, and normal liver histology. We validated hepatic expression of 54 and 57 target lncRNAs in samples showing inflammation and advanced fibrosis, respectively. Several lncRNAs were highly expressed in fibrosis relative to normal tissue, including hepatocellular carcinoma upregulated lncRNA (HULC) and MALAT1, both of which have been implicated in the development of hepatocellular carcinoma [35–37]. We determined that MALAT1 expression increases in activated hepatic stellate cells and is regulated by hyperglycemia and insulin in vitro. We identified C-X-C motif chemokine ligand 5 (CXCL5) as a gene target of MALAT1 in liver cells, and found increased levels of CXCL5 transcript and protein in fibrotic liver and activated hepatic stellate cells. These results support a mechanistic role for lncRNAs in regulating the development of inflammation and fibrosis in NASH.
Materials and Methods
Study sample
Liver biopsies were obtained from Caucasian individuals enrolled in the bariatric surgery program at the Geisinger Clinic Center for Nutrition and Weight Management. All patients participated in a multi-disciplinary, standardized pre-operative program, during which clinical and demographic data, blood samples, and tissue specimens were obtained [38]. RNA was isolated from liver wedge biopsies obtained intraoperatively [39–41]. A portion of the biopsy tissue was fixed in neutral buffered formalin, stained with hematoxylin and eosin, and histologically evaluated as part of clinical standard of care using NASH Clinical Research Network (CRN) criteria [42], as described [40]. Patients with histologic or serologic evidence for other chronic liver diseases were excluded from this study. Both medical history and histological assessment excluded individuals with clinically significant alcohol intake and drug use from participation in the bariatric surgery program. Clinical data were obtained from an obesity database as described [43], and included demographics, clinical measures, ICD-9 codes, medical history, medication use, and common lab results.
The study sample was comprised of 142 patients: 24 with normal liver histology, 53 with lobular inflammation, and 65 with advanced fibrosis. Demographic and clinical characteristics of the study sample are shown in Table 1. All study participants provided written informed consent for research, which was conducted according to The Code of Ethics of the World Medical Association (Declaration of Helsinki). The Institutional Review Boards of Geisinger Health System, the Translational Genomics Research Institute, National Jewish Health, and the Temple University School of Medicine approved the research.
Table 1.
Patient demographics and clinical characteristics
| Normal | Inflammation | P-value* | Fibrosis | P-value* | |
|---|---|---|---|---|---|
| N | 24 | 53 | 65 | ||
| Female, n (%) | 22 (0.92) | 45 (0.85) | NS | 48 (0.73) | 3.0E-02 |
| Mean age in years at biopsy (SD) | 44.8 (7.9) | 43.4 (12.7) | NS | 48.3 (10.9) | NS |
| BMI at biopsy (SD) | 43.3 (6.9) | 48.9 (7.8) | 3.2 E-03 | 48.4 (10.4) | 3.4E-02 |
| Diabetes mellitus, n (%) | 5 (0.21) | 14 (0.26) | NS | 40 (0.62) | 3.4E-04 |
| Laboratory measures, mean (SD) | |||||
| Serum AST, U/L | 21.9 (4.9) | 27.9 (10.0) | 1.2 E-02 | 39.6 (20.5) | 1.1E-08 |
| Serum ALT, U/L | 21.7 (7.4) | 32.9 (15.0) | 7.6E-04 | 40.5 (22.8) | 1.1E-07 |
| AST/ALT, U/L | 1 (0.66) | 0.85 (0.67) | 1.7E-07 | 0.98 (1.1) | 7.2E-15 |
| Alkaline Phosphatase | 78.7 (19.0) | 84.5 (21.2) | NS | 86.0 (44.4) | NS |
| Total bilirubin | 0.47 (0.22) | 0.5 (0.25) | NS | 0.56 (0.29) | NS |
| Glucose (mg/dL) | 92.1 (22.5) | 102.9 (40.3) | NS | 129.2 (55.3) | 4.4E-04 |
| Insulin | 12.4 (9.7) | 25.6 (22.1) | 3.4E-04 | 49.6 (68.2) | 1.0E-04 |
| HbA1c, % (SD) | 5.8 (0.87) | 6.5 (1.5) | 1.2E-03 | 7.2 (1.6) | 1.3E-06 |
| Triglycerides | 139.4 (58.7) | 187.5 (91.8) | 1.0E-02 | 195.7 (111.4) | 2.0E-02 |
| Total cholesterol | 187.4 (27.3) | 194.6 (31.8) | NS | 185.1 (40.7) | NS |
| LDL-C | 108.6 (28.1) | 108.2 (30.9) | NS | 102.4 (34.9) | NS |
| HDL-C | 52.4 (13.2) | 49.0 (11.0) | NS | 12.1 | 1.1E-02 |
| Histologic characteristics | |||||
| Steatosis, mean grade (SD) | 0 | 1.9 (0.7) | <0.0001 | 2.1 (0.8) | <0.0001 |
| Lobular inflammation, %=grade 1 | 0 | 1.3 (0.4) | <0.0001 | 1.25 (0.7) | <0.0001 |
| Lobular inflammation, %>grade 2 | 0 | 0 | NS | 3.4 (0.48) | <0.0001 |
| Portal inflammation, (%) | 0 | 0.9 (0.6) | <0.0001 | 1.2 (0.7 | <0.0001 |
| Ballooning (mean score) | 0 | 1.9 (0.7) | <0.0001 | 2.1 (0.8) | <0.0001 |
P-values are based on comparisons of normal versus inflammation and normal versus fibrosis using the Mann-Whitney U test
RNA extraction, sequencing, and analysis
We extracted total RNA using the RNeasy Mini Kit (Qiagen Inc.; Valencia, CA) according to the manufacturer’s protocol, and quantified products using the NanoDrop 2000 spectrophotometer (Thermo Fisher Scientific; Wilmington, DE). We used the Ovation RNA-Seq System V2 (NuGEN; San Carlos, CA) to prepare amplified cDNA from polyA-selected RNA prior to sequencing. We sequenced samples using the HiSeq 2000 sequencing platform (Illumina; San Diego, CA). RNA libraries were sequenced to a depth of 60M 83 bp paired-end reads. Sequencing data were processed using the Illumina pipeline CASAVA v1.8.4 to generate raw FASTQ reads. During the generation of qseq and FASTQ files for alignment, low quality reads were identified and removed, and indexed reads were identified and grouped accordingly. Filtered reads were aligned against the human genome using the Bowtie program [44]. Aligned RNA-Seq reads and Ensembl GRCh37–74 GTF files were imported into the HTSeq tool [45] to quantify the number of reads per gene. The counts were then used as input to DESeq2 [46] to identify lncRNAs that were differentially expressed among the histological categories, comparing lobular inflammation or advanced fibrosis samples with normal samples. We determined statistical significance using the method of Benjamini and Hochberg [47]. The level of statistical significance and the degree of fold-change were used to identify transcripts showing the strongest differential expression between phenotypic categories.
We used the heatmap.2 function from the gplots R package (http://CRAN.R-project.org/package=gplots) to plot heatmaps, which were created using log10-transformed normalized readcounts of the differentially expressed lncRNAs obtained from the DESeq2 data analysis. Counts were normalized within DESeq2 [46] using the default normalization method (quantile). Hierarchical data clustering of normalized readcounts was performed using a combination of the Manhattan method and the WardD-linkage clustering method. These methods were performed and applied to cluster samples (represented as columns in the heatmap) and genes (rows). Clustering is shown as dendrograms in each heatmap.
Functional Enrichment Analysis
To evaluate interactions between lncRNAs filtered by base mean ≥ 10, log2 fold-change ≥ |±1|, and p-value <0.05 and potential mRNA targets, we first used the publically available, curated database (http://www.lncrna2target.org) to identify experimentally validated interactions for each differentially expressed lncRNA discovered using RNA-seq (Supplemental Table S1). The resulting gene list was uploaded to DAVID Bioinformatics Resources 6.8 Beta with updated Knowledgebase (https://david-d.ncifcrf.gov/) to identify canonical signaling pathways and establish network connections between differentially expressed lncRNAs (Supplementary Table S2). The significance of the association between lncRNA transcripts and the canonical pathway was assessed using two criteria: 1) the ratio of the number of molecules mapped to the pathway and total number of molecules involved in the canonical pathway, and 2) the Benjamini-Hochberg corrected p-value from the right-tailed Fisher Exact test [47].
Targeted sequencing using the Ion AmpliSeq Transcriptome Human Gene Expression kit
To validate RNA-sequencing results, we analyzed gene expression with an orthogonal method utilizing the real-time PCR transcriptome panel found in the Ion AmpliSeq Transcriptome Human Gene Expression kit (Life Technologies; Carlsbad, CA). We selected a subset of 48 individuals from the RNA-sequencing sample, corresponding to 16 samples from each of the three histological classes (normal, lobular inflammation, and advanced fibrosis). Total RNA was isolated and quantified as described above and reverse transcription was performed using random priming. Once validated, libraries were sequenced as barcoded-pooled samples on the Ion S5XL NGS platform (Life Technologies). Differentially expressed lncRNAs were analyzed using DESeq2 and plotted in heatmaps as described above.
Analysis of individual RNAs using quantitative real time-polymerase chain reaction (RT-qPCR)
To validate expression levels of individual transcripts, we performed RT-qPCR using RNA extracted from the same liver samples used in the sequencing experiment. Primer sequences are available upon request. We converted RNA to cDNA using the TaqMan RNA-to-Ct 1-Step kit (Life Technologies) according to the manufacturer’s protocol, followed by RT-qPCR analysis in conjunction with the QuantStudio 6 Flex (Life Technologies). Cycle threshold value was generated using QuantStudio Real-Time PCR Software 1.0 (Life Technologies). Data were normalized using glyceraldehyde 3-phosphate dehydrogenase (GAPDH). The −ΔΔCt method was used to determine fold-change of gene expression between samples. All assays were performed in triplicate. A two-tailed t-test was used to determine p-values.
Cell culture and cell treatments
We used two cell lines to characterize effects of lncRNAs on target gene expression: HepG2 cells as a model for hepatocytes, and LX-2 cells as a model for hepatic stellate cells, which are central to the fibrogenic process in the liver and reside in close proximity to hepatocytes in vivo. HepG2 (ATCC; Manassas, VA) and LX-2 (Merck Millipore; Billerica, MA) cells were cultured in Dulbecco’s Modified Eagle Medium (DMEM) supplemented with 10% fetal bovine serum (FBS). Cells were grown in 24-well culture dishes (VWR International; Radnor, PA) containing 0.5 mL cell culture medium and placed at 37°C in a Hera Ce ll 5% CO2 incubator (Thermo Fisher Scientific). Culture medium was replaced the first day after seeding, and then every 48 and 72 hours for HepG2 and LX-2 cells, respectively, until 80% confluence was reached. Prior to treatment, cells were serum-starved overnight, and then treated with serum-free media containing insulin (I: 100 nM) or high glucose (HG: 30 mM).
Activated LX-2 cells were put into a quiescent state by treating with DMEM, 10% FBS, and MDI solution (0.5 mM isobutylmethylxanthine, 1 μM dexamethasone, and 167 nM insulin; Sigma-Aldrich) as described [48]. Phenotypic differences observed with a light microscope and changes in alpha smooth muscle actin (ACTA2) transcript levels were measured as a marker of cell state. Total RNA was extracted and MALAT1 and CXCL5 transcript levels were quantified with RT-qPCR as described.
For knockdown studies, HepG2 cells were transfected using RNAiMAX (Thermo Fisher Scientific) with either MALAT1 siRNA or a scrambled sequence over 48 hours. RNA extraction, quantification, and RT-qPCR analysis were performed as described above. Cell media was collected, spun at 5000 x g for 5 minutes to remove cell debris, and concentrated using Amicon tubes (Millipore). Protein concentration was determined using the bicinchoninic acid (BCA) assay (Thermo Fisher). CXCL5 mRNA (relative expression) and protein (percent of total soluble protein) were compared with housekeeping genes and untreated controls, respectively. All experiments were performed in triplicate. A two-tailed t-test was used to determine significance; a p-value<0.05 was considered statistically significant.
Results
Clinical characteristics of study sample
We applied massively parallel RNA-Seq to quantify expression of lncRNAs derived from wedge liver biopsies from 24 individuals with normal liver histology, 53 NAFLD patients with lobular inflammation, and 65 NAFLD patients with advanced fibrosis. The degree of liver fibrosis was evaluated using Masson’s Trichrome stain. Patient characteristics are shown in Table 1. As expected, individuals with either lobular inflammation or advanced fibrosis had higher BMIs and triglyceride levels and showed greater derangement in glucose metabolism and liver function compared to individuals with normal histology. The presence of T2D was significantly greater in patients with fibrosis compared to those with normal histology or inflammation (62% vs 21% and 26%, respectively).
lncRNA profiling in NASH fibrosis, lobular inflammation, and normal liver
Quality-filtered sequencing reads were aligned to the reference genome, and then quantified as read counts for each known lncRNA gene feature and plotted as heatmaps. We performed unsupervised hierarchical clustering using the Ward linkage clustering method [49] with a Manhattan distance matrix to provide an unbiased assessment of the ability of lncRNAs to differentiate between livers with normal histology and those with either lobular inflammation or fibrosis. The column-wise clustering dendrogram showed a largely independent grouping of the control and diseased liver samples. We observed strong discrimination between normal samples and those with advanced fibrosis (Fig. 1A). A similar pattern was seen in the heatmap comparing samples with lobular inflammation to those showing normal liver histology (Fig. 1B).
Figure 1. Differential hepatic lncRNA expression in NAFLD patients with fibrosis or lobular inflammation.


The heatmaps show differentially expressed lncRNAs in NAFLD patients with A) advanced fibrosis or B) lobular inflammation compared to individuals with no histological evidence of liver damage. Samples were grouped using hierarchical clustering based on similar expression profiles. Heatmap color codes for column labels are indicated on the top right of the heatmap. The title of each label is displayed on the left side of each band. The data are represented by the Z-score of log2-normalized readcounts. The color-key legend is shown on the top left of the first heatmap: red (i.e., Z-score>0) indicates over-expression; white indicates no change in gene expression; blue (i.e., Z-score<0) indicates under-expression. F0 represents normal histology without steatosis, lobular inflammation, or fibrosis. Inflammation represents lobular inflammation without fibrosis, and advanced fibrosis included stage 3 or bridging fibrosis, “incomplete” cirrhosis, and stage 4 fibrosis/cirrhosis.
A comparison of lncRNA expression profiles in fibrotic and normal liver samples identified 4057 lncRNAs with a statistically significant log2 fold-change ≥ 1.0 and base mean cut-off =1 in NASH fibrosis using a false-discovery rate p-value ≤ 0.05. Using the same criteria, we observed 4432 lncRNAs that were differentially expressed between samples with lobular inflammation and those with normal histology. Comparison of profiles from lobular inflammation and advanced fibrosis revealed 3122 differentially expressed lncRNAs shared between the two groups. The lncRNAs common to each list showing the greatest fold-change and highest expression levels are shown in Table 2.
Table 2.
Differentially expressed lncRNAs common to fibrosis and lobular inflammation
| Fibrosis | Inflammation | |||||||
|---|---|---|---|---|---|---|---|---|
| lncRNA | BM* | FC** | p-value | p-adj*** | BM* | FC** | p-value | p-adj*** |
| MALAT1 | 172157.26 | 1.64 | 1.49E-48 | 1.11E-47 | 198742.83 | 1.84 | 3.18E-114 | 7.39E-111 |
| TSIX | 198.65 | −3.38 | 2.28E-29 | 7.19E-29 | 242.01 | −3.09 | 2.46E-27 | 1.41E-26 |
| RMRP | 127.26 | 2.70 | 2.38E-26 | 6.50E-26 | 105.11 | 2.38 | 5.00E-28 | 3.06E-27 |
| TPTEP1 | 79.58 | −2.49 | 5.19E-93 | 1.79E-91 | 95.60 | −2.26 | 3.18E-48 | 9.75E-47 |
| LINC00910 | 75.13 | −2.07 | 1.94E-103 | 1.08E-101 | 83.90 | −2.10 | 2.16E-62 | 1.62E-60 |
| MIAT | 69.44 | −1.80 | 5.16E-37 | 2.36E-36 | 72.01 | −2.10 | 5.43E-45 | 1.33E-43 |
| LINC00842 | 44.12 | −2.03 | 2.86E-25 | 7.39E-25 | 44.70 | −2.52 | 2.96E-24 | 1.30E-23 |
| PART1 | 45.73 | −5.84 | 2.26E-72 | 3.87E-71 | 56.89 | −4.96 | 3.90E-26 | 2.03E-25 |
| LINC00882 | 33.95 | −2.06 | 7.48E-54 | 6.69E-53 | 36.66 | −2.24 | 2.41E-44 | 5.59E-43 |
| LINC0841 | 27.90 | −6.48 | 4.67E-34 | 1.85E-33 | 34.63 | −5.38 | 2.94E-22 | 1.08E-21 |
BM: base mean (FPKM);
FC: log2 fold-change;
adjusted p-value determined using the method of Benjamini and Hochberg [47]
To address differences in BMI, T2D status, glucose and triglyceride levels, and sex distribution among patients with lobular inflammation and advanced fibrosis with those individuals showing normal liver histology, we performed additional analyses adjusting for the appropriate covariates. For patients with lobular inflammation, adjusting for the effects of BMI, insulin levels, and HbA1c reduced the number of differentially expressed lncRNAs to 681. Likewise, for patients with advanced fibrosis, adjusting for the effects of sex, diabetes status, glucose, insulin, and HbA1c resulted in 658 differentially expressed lncRNAs. Comparison of profiles from lobular inflammation and advanced fibrosis revealed 640 differentially expressed lncRNAs shared between the two groups.
We also explored lncRNAs differentially expressed between lobular inflammation and advanced fibrosis and identified 74 differentially expressed lncRNAs (P <0.05; Supplemental Table S2). As shown in the clustering dendrogram (Supplemental Figure S1), inflammation and fibrotic samples were not strongly clustered according to histological class.
lncRNA target genes involved in liver-related pathways
To identify pathways by which lncRNAs might exert effects on hepatic function or metabolism, we investigated interactions among differentially expressed lncRNAs common to both lobular inflammation and advanced fibrosis, filtered by log2 fold-change ≥ 1.0, a false-discovery rate p-value ≤ 0.05, and an arbitrary base mean cut-off =10 (N=125) and potential target mRNAs using a publically available, curated database as described in the Methods section. We undertook this approach because at the present time, there are no comprehensive databases containing annotated lncRNAs. Using this strategy, we identified 77 experimentally validated target mRNAs, which were found to participate in 137 pathways (p<0.05), including those involved in TGFB1 and TNF signaling, insulin resistance, and extracellular matrix maintenance (Supplemental Table S3). The top pathways related to lncRNA target genes are shown in Table 3.
Table 3.
Top pathways related to lncRNA target genes
| Term | Genes | % | P-val | P-valadj |
|---|---|---|---|---|
| Cancer | WNT5A, COL4A1, BCR, EPAS1, PTGS2, PDGFB, ARNT2, LPAR1, MAPK10, FZD5, TGFB1, SUFU, MAPK1, LAMA3, EP300, CRKL, CDKN2B, MAPK3, MAPK9, MAPK8, FAS, FGF1, WNT6, AKT3, FN1 | 33.8 | 2.10E-17 | 3.20E-15 |
| TNF signaling | MAPK1, PTGS2, CSF1, MAPK3, MAPK9, MAPK8, FAS, MAPK10, AKT3 | 12.2 | 7.00E-07 | 2.20E-05 |
| MAPK signaling | MAPK1, CRKL, PDGFB, MAPK3, MKNK2, MAPK9, MAPK8, FAS, MAPK10, FGF1, TGFB1, AKT3 | 16.2 | 1.40E-06 | 3.70E-05 |
| Insulin signaling | MAPK1, PRKAR2A, CRKL, MAPK3, MKNK2, MAPK9, MAPK8, MAPK10, AKT3 | 12.2 | 5.60E-06 | 1.10E-04 |
| Hepatitis B | MAPK1, EP300, MAPK3, MAPK9, MAPK8, FAS, MAPK10, TGFB1, AKT3 | 12.2 | 7.70E-06 | 1.20E-04 |
| Type 2 diabetes | MAPK1, MAPK3, MAPK9, MAPK8, MAPK10, PRKCE | 8.1 | 2.20E-05 | 2.50E-04 |
| ECM | WNT5A, CTHRC1, LAMA3, COL4A1, COL6A1, ADAMTS12, WNT6, TGFB1, FN1 | 12.2 | 4.20E-06 | 3.30E-04 |
| ErbB signaling | MAPK1, CRKL, MAPK3, MAPK9, MAPK8, MAPK10, AKT3 | 9.5 | 3.50E-05 | 3.60E-04 |
| PI3K-Akt signaling | MAPK1, LAMA3, COL4A1, PDGFB, CSF1, MAPK3, COL6A1, LPAR1, FGF1, AKT3, FN1 | 14.9 | 1.50E-04 | 1.10E-03 |
| Ras signaling | MAPK1, PDGFB, CSF1, MAPK3, MAPK9, MAPK8, MAPK10, FGF1, AKT3 | 12.2 | 1.90E-04 | 1.20E-03 |
| Sphingolipid signaling | MAPK1, MAPK3, MAPK9, MAPK8, MAPK10, PRKCE, AKT3 | 9.5 | 2.10E-04 | 1.20E-03 |
| ECM-receptor binding | LAMA3, COL4A1, COL6A1, SDC4, FN1, HMMR | 8.1 | 3.90E-04 | 1.90E-03 |
| Wnt signaling | WNT5A, EP300, MAPK9, MAPK8, MAPK10, WNT6, FZD5 | 9.5 | 4.30E-04 | 2.10E-03 |
| cAMP signaling | MAPK1, DRD1, EP300, MAPK3, MAPK9, MAPK8, MAPK10, AKT3 | 10.8 | 4.90E-04 | 2.30E-03 |
| Extracellular space | WNT5A, CTHRC1, CPM, PDGFB, CXCL5, CSF1, GGT1, MCAM, TGFB1, BMPER, GPC6, STC1, CA2, FAS, FGF1, WNT6, FN1 | 23 | 3.70E-05 | 2.40E-03 |
| NAFLD | NDUFC2, MAPK9, MAPK8, FAS, MAPK10, TGFB1, AKT3 | 9.5 | 6.70E-04 | 2.80E-03 |
| Hepatitis C | MAPK1, MAPK3, MAPK9, MAPK8, MAPK10, AKT3 | 8.1 | 2.50E-03 | 9.20E-03 |
| TGF-beta signaling | MAPK1, EP300, CDKN2B, MAPK3, TGFB1 | 6.8 | 3.00E-03 | 1.00E-02 |
| Insulin resistance | MAPK9, MAPK8, MAPK10, PRKCE, AKT3 | 6.8 | 7.60E-03 | 2.30E-02 |
| ECM organization | LAMA3, COL4A1, PDGFB, COL6A1, SDC4, TGFB1, FN1 | 9.5 | 1.60E-03 | 4.60E-02 |
% number of genes mapped to pathway and total number of molecules involved in canonical pathway
Validation of selected lncRNAs using an orthogonal platform
As shown in Figure 1, the majority of differentially expressed lncRNAs in fibrosis and lobular inflammation were downregulated relative to normal tissue. To validate this skewed distribution, we analyzed a subset of samples (16 samples corresponding to each histological class) using a real-time PCR mRNA transcriptome panel that also contained 262 lncRNAs, as an orthogonal method. In comparisons with normal tissue, 72 and 67 lncRNAs were differentially expressed in liver samples with advanced fibrosis and inflammation, respectively. Of these, 65/72 and 61/67 were downregulated, reflecting the trend observed in the analyses of the RNA-Seq data. Of the 72 lncRNAs showing differential expression in fibrotic tissue in the AmpliSeq analysis, 57 were also differentially expressed in the RNA-Seq data and 52 of these were dysregulated in the same direction (r =0.71; Supplemental Fig. S2A). In samples with inflammation, 51/52 were dysregulated in the same direction (r =0.80; Supplemental Fig. S2B). These findings are in agreement with previous findings of concordance in log2 fold-change in a comparison of the two platforms [50].
RT-qPCR validation of differentially expressed lncRNAs previously associated with hepatocellular carcinoma
To validate the differential expression of hepatic lncRNAs in NAFLD fibrosis identified by sequencing, we selected three candidates to analyze using quantitative real-time polymerase chain reaction (RT-qPCR) based on fold-change, statistical significance, and prior association with hepatocellular carcinoma, to which NASH patients may be predisposed. These lncRNAs included NEAT1 (nuclear paraspeckle assembly transcript 1), MALAT1, and HULC (hepatocellular carcinoma up-regulated long non-coding RNA). As shown in Figure 2, we observed modest upregulation of NEAT1 in both inflammation (p=1.0 x 10⁻⁴) and advanced fibrosis (p=3.0 x 10⁻⁴) compared to normal liver. In contrast, levels of MALAT1 were 3.6-fold (p=8.02 x 10⁻⁶) higher in fibrotic samples compared to samples with normal and inflammation histology, both of which showed similar levels of expression. Levels of HULC were 2.3-fold (p=2.53 x 10⁻⁵) and 3.6-fold (p=1.08 x 10⁻⁸) higher in inflammation and fibrosis samples, respectively, compared with normal tissue (p=0.01). These findings are concordant with results obtained with the analysis of the RNA-sequencing data.
Figure 2. Analysis of NEAT1, MALAT1, and HULC by RT-qPCR.
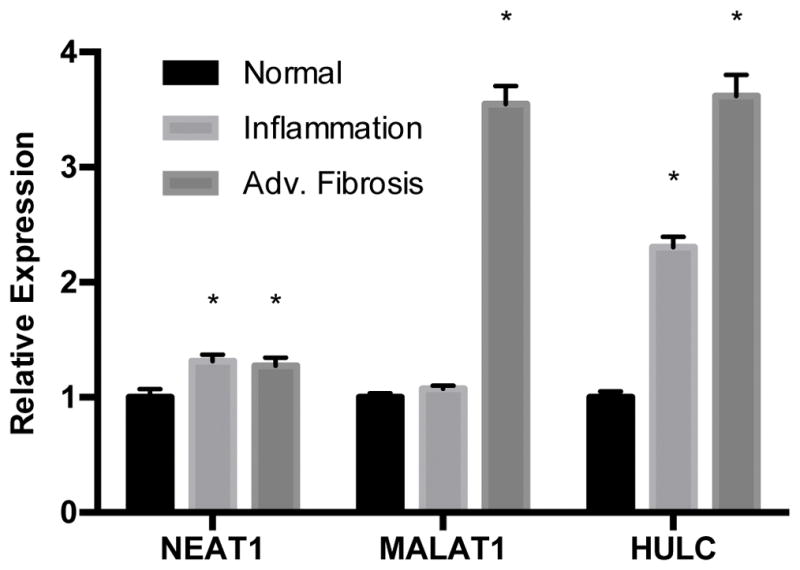
Total RNA was extracted from liver tissue as described in the Methods section. Relative quantification of lncRNAs was performed using TaqMan qPCR. Results are shown as inflammation and advanced fibrosis relative to normal histology, levels of which were set to a value of 1. Expression levels were normalized against GAPDH. All experiments were performed in triplicate. Data are expressed as mean ± standard deviation. *p>0.05.
Identification and validation of gene targets of validated lncRNAs
We used the lncrna2target database (http://www.lncrna2target.org) to identify potential validated mRNA targets of NEAT1, MALAT1, and HULC. Of these, we identified potential mRNA targets only for HULC and MALAT1, but not NEAT1 (Supplemental Table S1). Although several potential mRNA targets for HULC and MALAT1 were identified, we observed hepatic dysregulation in our samples of only two transcripts with biological relevance to liver injury: syndecan 4 (SDC4), which is potentially targeted by HULC, and C-X-C motif chemokine ligand 5 (CXCL5), a target of MALAT1. Using RT-qPCR, we found a significant increase of CXCL5 transcript in liver samples with histological evidence for fibrosis and lobular inflammation compared to normal liver tissue (Fig. 3). However, we did not observe differences in SDC4 expression among the different histological classes (data not shown), and for this reason, we focused our attention on investigating the relationship between MALAT1 and CXCL5.
Figure 3. CXCL5 expression is increased in lobular inflammation and advanced fibrosis.
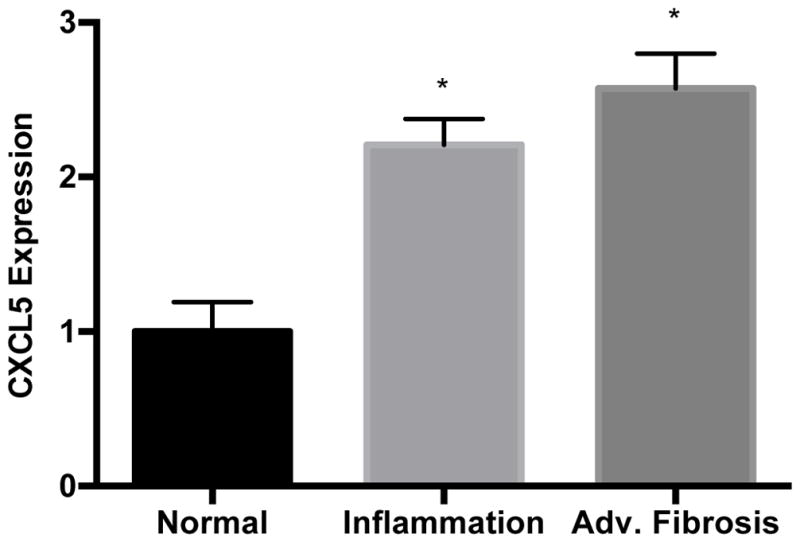
Total RNA was extracted from liver tissue as described in the Methods section. Relative quantification of CXCL5 was performed using TaqMan qPCR. Results are shown as inflammation and advanced fibrosis relative to normal histology, levels of which were set to a value of 1. Expression levels were normalized against GAPDH. All experiments were performed in triplicate. Data are expressed as mean ± standard deviation. *p>0.05.
MALAT1 knockdown affects CXCL5 expression in liver cells
To begin to characterize the relationship between MALAT1 and CXCL5, we treated HepG2 cells with MALAT1 siRNA and measured transcript and protein levels of the predicted target. Treatment of HepG2 cells with MALAT1 siRNA resulted in 85% reduction in MALAT1 levels compared to untreated and scrambled siRNA control cells (Fig. 4A). In the presence of MALAT1 siRNA, levels of CXCL5 transcript (Fig. 4B) and secreted protein (Fig. 4C) were decreased by 50% and 30%, respectively, suggesting that MALAT1 plays a role in the regulation of CXCL5 expression.
Figure 4. MALAT1 knockdown decreases CXCL5 transcript and protein levels.
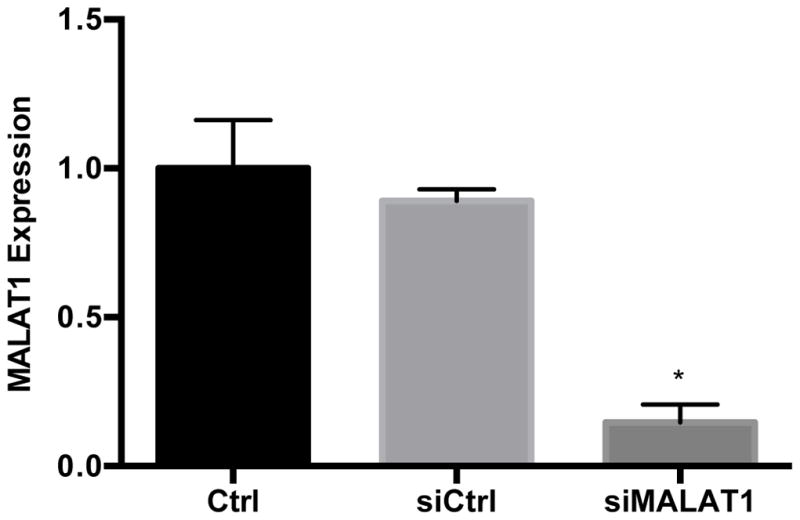
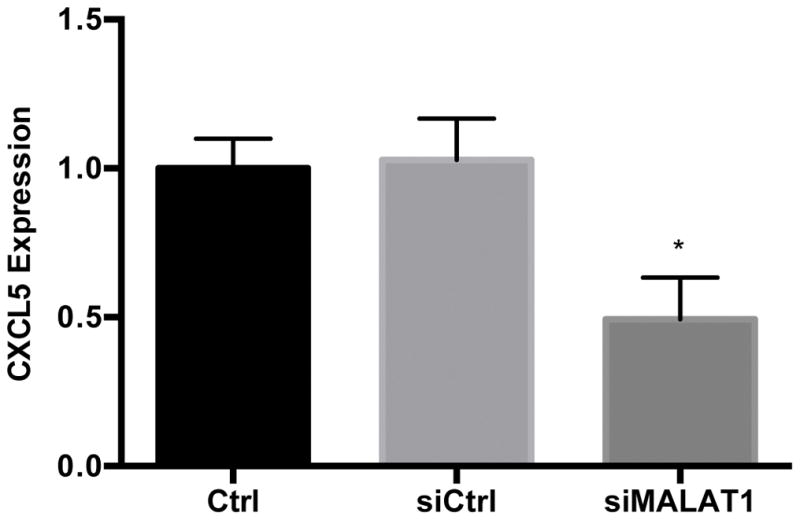

HepG2 cells were transfected with MALAT1 siRNA for 48 hours and levels of A) MALAT1, B) CXCL5 transcript and C) CXCL5 protein were quantified. Total RNA and protein were extracted and collected, respectively, as described in the Methods section. Relative quantification of transcripts was performed using TaqMan qPCR and normalized against GAPDH. Protein concentrations were assessed using commercially available enzyme-linked immunosorbent assays. All experiments were performed in triplicate. Data are expressed as mean ± standard deviation. *p>0.05.
CXCL5 and MALAT1 expression is elevated in activated LX-2 cells
Earlier studies have shown that hepatic stellate cells and sinusoidal endothelial cells are the main sources of hepatic CXCL5 in the mouse [51]. The LX-2 cell line retains key features of human hepatic stellate cells and can be maintained in either a quiescent or activated state like primary cells [52]; thus, we measured CXCL5 levels in this cell line. Levels of CXCL5 transcript (Fig. 5A) and protein (Fig. 5B) were 49% and 535% higher in activated versus quiescent LX-2 cells, respectively. We also found that MALAT1 levels were almost 2-fold higher in activated LX-2 cells compared to quiescent cells (Fig. 5C). These results suggest that expression of CXCL5 and MALAT1 is altered during the transition of hepatic stellate cells from a quiescent to activated state.
Figure 5. Expression of MALAT1 and CXCL5 increases in activated hepatic stellate (LX-2) cells.
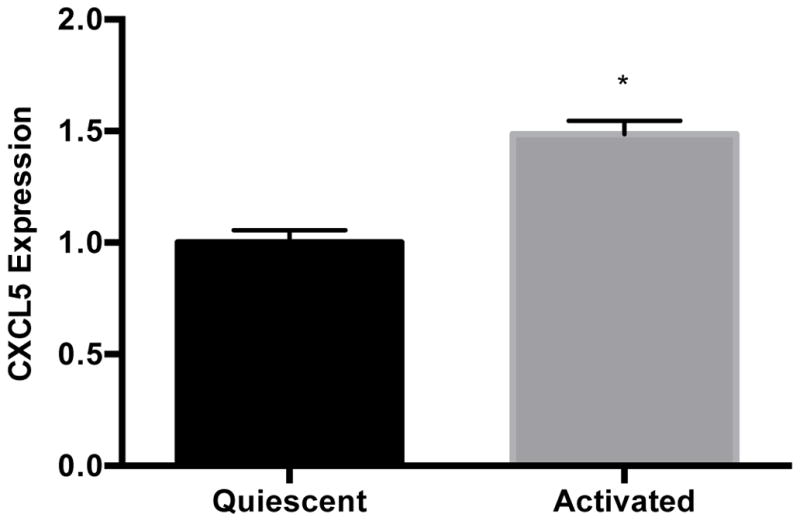
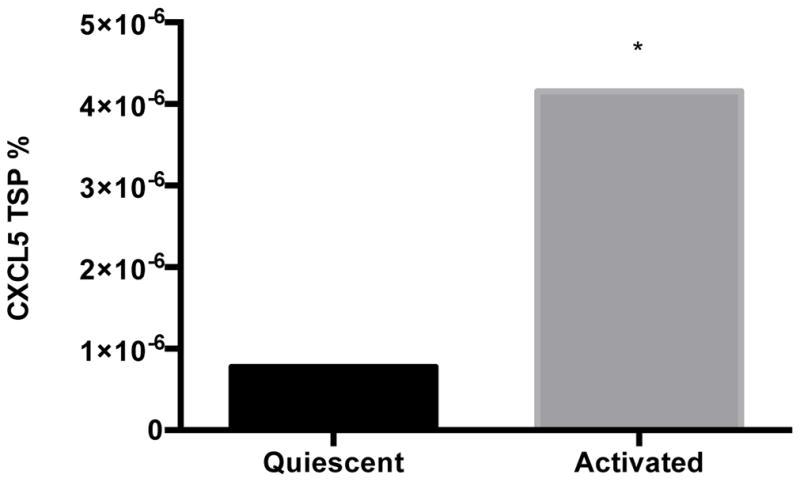
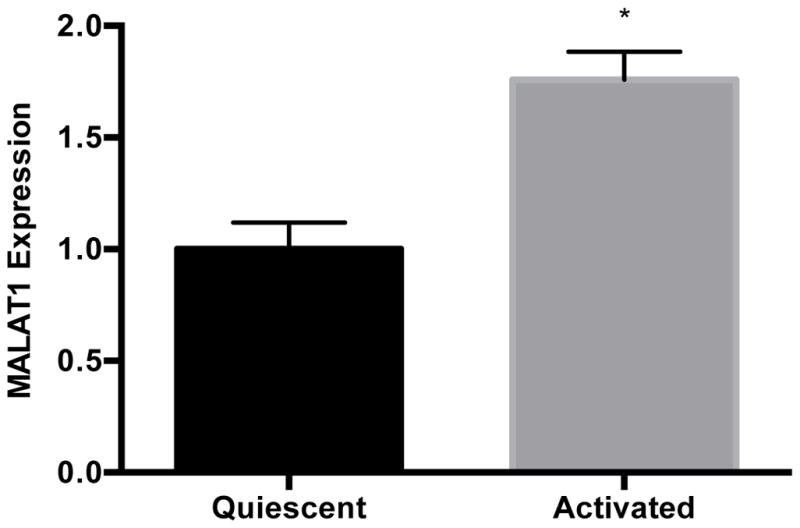
Levels of A) MALAT1, B) CXCL5 trancript and C) CXCL5 protein in quiescent or activated LX-2 cells. Activated LX-2 cells were put into a quiescent state using the MDI cocktail as described in the Methods section. Relative quantification of transcripts was performed using TaqMan qPCR and normalized against GAPDH. Protein concentrations were assessed using commercially available enzyme-linked immunosorbent assays. All experiments were performed in triplicate. Data are expressed as mean ± standard deviation. *p>0.05.
High glucose and insulin regulate MALAT1 expression in liver cells
Because hyperglycemia, hyperinsulinemia, and T2D are linked to NAFLD severity and progression to hepatic inflammation and advanced fibrosis [53–55] and MALAT1 expression has been shown to be regulated by high glucose levels in human umbilical endothelial cells [56], we sought to assess the effects of glucose and insulin on MALAT1 expression in liver cells. Treatment of HepG2 cells with high glucose (30 mM) and insulin (100 nM) resulted in an increase in MALAT1 expression over time, beginning at 24 hours and peaking to more than 3.5-fold at 48 hours (Fig. 6). In contrast, MALAT1 levels in activated LX-2 cells increased only in response to treatment with 100 nM insulin, but did not vary with high glucose (Fig. 6).
Figure 6. Effects of hyperglycemia and insulin treatment on MALAT1 expression.

MALAT1 expression in response to treatment with high glucose or insulin was measured in HepG2 and LX-2 cells were grown to 80% confluence and serum-starved prior to treatment with normal glucose (5 mM), high glucose (30 mM), or 100 mM insulin. Total RNA was extracted as described in the Methods section. Relative quantification of transcripts was performed using TaqMan qPCR and normalized against GAPDH. All experiments were performed in triplicate. Data are expressed as mean ± standard deviation. *p>0.05.
Discussion
We conducted genome-wide profiling of lncRNAs using a well-characterized cohort of patients with biopsy-proven NAFLD to identify lncRNAs differentially expressed in lobular inflammation and advanced fibrosis relative to liver samples showing normal histology from obese individuals. Comparison of profiles from lobular inflammation and advanced fibrosis revealed 3122 differentially expressed lncRNAs shared by the two histological groups, indicating that changes in lncRNA expression that correspond with advanced fibrosis may begin with the onset of hepatic inflammation that appear to involve 137 pathways, including those involved in TGFB1 and TNF signaling, insulin resistance, and extracellular matrix maintenance. A major finding of this study is evidence that MALAT1, well known for participation in the development of hepatocellular carcinoma [57], may play a role in the development of steatohepatitis and fibrosis in patients with NAFLD through a chemokine-mediated mechanism.
The role of lncRNAs in the development of NASH is only now emerging. In addition to investigations of individual lncRNAs, including MEG3 [31], APTR [32], and MALAT1 [33], to our knowledge, only a single study has reported a genome-wide analysis of lncRNAs in human liver tissue with NAFLD [34]. In that study, liver tissue was obtained from ten patients with gallbladder stones, five with NAFLD, and none with metabolic disease (i.e., T2D). The authors used microarray analysis to identify 1,735 lncRNAs differentially expressed between NAFLD and normal samples. A random selection of seven lncRNAs assessed by RT-qPCR showed significantly smaller degrees in fold-change compared to those obtained with the microarray results, and in most cases, expression levels were no longer significantly different between the two groups, suggesting that microarray analyses may be prone to false positive results. Compared to array hybridization, RNA sequencing provides a broader dynamic range through quantification of discrete, digital sequencing read counts and higher levels of specificity and sensitivity, which enhances detection of differential expression. Consistent with these differences, none of the seven lncRNAs identified in the microarray study overlapped with the findings reported here.
We used a two-pronged strategy to validate findings of differential expression in the present study. First, we compared our RNA-sequencing results with readouts derived using a real-time PCR transcriptome panel containing 262 lncRNAs. Of these, we found evidence of differential expression for 67 and 72 lncRNAs in samples with lobular inflammation and advanced fibrosis versus normal tissue. In comparison with the RNA-sequencing data, 54 and 57 lncRNAs overlapped with the results for lobular inflammation and advanced fibrosis in the validation method. We also selected three lncRNAs for validation using RT-qPCR and observed the strongest evidence for differential expression for HULC and MALAT1. Differential expression of MALAT1 was further validated in an analysis of microarray data deposited in the GEO DataSets resource. We found evidence that MALAT1, but not HULC or NEAT1, expression was increased 0.77-fold (p=1.92 x 10⁻⁵) using profiling data from 19 NASH patients and 24 healthy controls [58]. A recent study reported a seven-fold increase in MALAT1 expression in cirrhotic liver compared to healthy tissue, suggesting that this lncRNA may play a role in processes underlying the progression of NASH and development of hepatocellular carcinoma [59].
Our studies and those of others have assessed MALAT1 expression in whole liver tissue. In mice, however, MALAT1 expression was shown to increase 9.7-fold in primary hepatic stellate cells at day 10 versus day 2, and in comparisons of CCL4-treated animals, a model for liver fibrosis, with oil-treated controls, MALAT1 expression increased 5.9-fold and 2.7-fold in hepatic stellate cells and isolated hepatocytes, respectively [59]. Our results showing an elevation of MALAT1 expression in activated hepatic stellate cells are concordant with these findings. Notably, in primary hepatic stellate cells isolated from C57BL/6 mice, knockdown of MALAT1 expression correlated with reduced levels of alpha-smooth muscle actin and type 1 collagen and reduced the appearance of the myofibroblast-like morphology characteristic of activated hepatic stellate cells [59]. Knockdown of MALAT1 in CCL4-treated mice also correlated with reduced levels of alpha-smooth muscle actin and type 1 collagen, as well as down-regulation of collagen accumulation in liver tissue, suggesting that this lncRNA plays a role in the progression of liver fibrosis in mice.
Our findings that MALAT1 expression increased in response to high glucose treatment in HepG2 cells is consistent with a previous report of glucose-mediated MALAT1 upregulation in endothelial cells [56]. In that study, MALAT1 upregulation peaked at 12 hours and was not apparent at later time points, in contrast to our findings in liver cells. However, we also observed peak MALAT1 expression at different timepoints between HepG2 and LX-2 cells, and combined with the earlier finding, these results suggest that hyperglycemia-mediated regulation of MALAT1 expression may vary by liver cell type. MALAT1 expression increased levels of reactive oxygen species and was paralleled by upregulation of serum amyloid antigen 3 (SAA3), which was abrogated in the presence of MALAT1 siRNA [56]. Changes in MALAT1 expression in response to hyperglycemia were also accompanied by SAA3-mediated upregulation of the inflammatory markers tumor necrosis factor alpha (TNFA) and interleukin 6 (IL6), which was diminished in the presence of MALAT1 siRNA, supporting a mechanistic role for the lncRNA in mediating hyperglycemia-induced inflammation. IL6 has been shown to be a biomarker for the presence of liver fat in humans [60].
We identified CXCL5 as a potential target of MALAT1 and observed upregulation of transcript levels in lobular inflammation and advanced fibrosis. CXCL5 expression was also elevated in activated LX-2 cells, which is consistent with increased cytokine expression from hepatic stellate cells in response to liver injury [61]. Treatment of liver cells with siMALAT1 corresponded with decreased expression of CXCL5 transcript and protein. Early studies reported that CXCL5, also known as epithelial neutrophil-activating peptide 78 (ENA-78), was upregulated in liver injury [62–64] and contributed to hepatocyte proliferation [62]. CXCL5 belongs to the CXC chemokine family, has specificity for CXCR2 receptors, and is involved in the recruitment and activation of neutrophils [65]. CXCL5 is associated with neutrophil infiltration and poor prognosis in liver cancer, and is considered a therapeutic target in liver cancer, as treatment with small-interfering RNAs or antibodies against CXCL5 can suppress tumor growth, proliferation, migration and invasion [66]. In non-small cell lung cancer cells, CXCL5 was identified as a downstream target of MALAT1, and together, they regulated cell migration and invasion [67].
The role of CXCL5 in the development of NASH is not yet known. In rats, acute liver injury resulting from partial hepatectomy or hepatic ischemia/reperfusion was associated with increased hepatic expression of CXCL5 [62, 63, 68]. Hepatic CXCL5 expression in mice was increased in chronic liver disease compared to normal liver, particularly in hepatic stellate and endothelial cells [51]. In humans with alcoholic hepatitis, hepatic expression of CXCL5 was upregulated and associated with a worse prognosis [69]. In contrast, plasma CXCL5 levels were reduced in patients with liver cirrhosis, and correlated with hepatic synthetic capacity, fibrosis, and disease progression [51]. Hepatic recruitment of blood monocytes has been shown to promote liver fibrosis [70], suggesting that reduced plasma CXCL5 levels may reflect an altered distribution of these infiltrating immune cells in patients with advanced liver disease. Combined with the results reported here, these findings support a role for CXCL5 in the pathogenesis of chronic liver disease, perhaps through a MALAT1-mediated mechanism. Additional studies will be necessary to delineate the relationship between MALAT1 and CXCL5 and determine the contribution from different cell types in the liver to the MALAT1-CXCL5 pathway.
Despite the significance of the findings reported here, we acknowledge limitations associated with the current study. First, the cellular source of lncRNAs identified in whole tissue is unknown, which may confound interpretation of the RNA-sequencing data. This is particularly important for lncRNAs, which exhibit more cell-type specific expression profiles than mRNAs [71]. Single-cell analysis of lncRNAs from the developing human cortex revealed abundant expression in individual cells compared to bulk tissue studies, suggesting that analysis of whole tissues may average gene expression signatures of many different cell types [72, 73], thereby muting actual expression patterns in individual cells. Thus, single-cell sequencing of hepatic stellate cells, hepatocytes, and other cells of the liver may reveal important cell type-specific contributions to biological changes that occur during the development of fibrosis and cirrhosis in NASH.
In addition, the libraries prepared for RNA-sequencing were polyA+-enriched, which biases our analyses to polyadenylated lncRNAs. While many lncRNAs are post-transcriptionally polyadenylated like mRNAs [71], many processed lncRNAs do not possess a polyA+ tail and these would not be represented in our polyA+-enriched libraries. To address the current bias toward polyA+ lncRNAs, we are currently performing a microarray analysis of lncRNAs using the same samples in the current study.
Results from this study are derived from individuals with extreme obesity, in whom the pathophysiology of hepatic fibrosis may be different from patients with less severe degrees of obesity. However, given that obesity is a significant risk factor for worse liver-related outcomes in NAFLD [74], and that the percentage of the population with severe obesity is increasing, our findings may have broader relevance. We also note that the cross-sectional design does not allow associations with disease progression to be drawn, and in the absence of serial liver biopsies, we could not evaluate lncRNA expression changes over time. Assessment of lncRNA levels in longitudinal biopsies will be necessary to determine the roles of specific candidates in disease progression.
In summary, the results obtained in the current study demonstrate that dysregulated lncRNA expression is associated with inflammation and advanced fibrosis in NASH. We also show that functionally relevant differences in MALAT1 expression may contribute to the development of fibrosis in NAFLD through mechanisms involving the inflammatory chemokine, CXCL5. Future investigations, including validation in independent cohorts and characterization of lncRNA gene targets and pathways, will be important to extend these findings.
Supplementary Material
Brief Commentary.
Background
Clinical outcomes for patients with nonalcoholic steaotohepatitis (NASH) contribute to greater liver-related morbidity and mortality in affected patients; however, the molecular mechanisms underlying the progression to coincident inflammation and fibrosis in NASH remain poorly defined. Given the strong link between fibrosis and heightened risk of cirrhosis and liver-related mortality in NASH patients, studies to identify and characterize the specific mechanisms contributing to disease progression are critical for the development of new therapies to delay, halt, or reverse hepatic fibrosis.
Translational Significance
These results support a mechanistic role for lncRNAs in regulating the development of inflammation and fibrosis in NASH.
Acknowledgments
Grant support: R01 DK088231 (JKD)
This project was supported by funding from the National Institutes of Health (R01 DK088231). All authors have read the journal’s policy on disclosure of potential conflicts of interest and all authors have disclosed any financial or personal relationship with organizations that could potentially be perceived as influencing the described research. CDS receives grant and consulting support from Ethicon Endo-Surgery. All authors have read the journal’s authorship statement and the manuscript has been reviewed by and approved by all named authors.
Footnotes
No author disclosures to report.
Publisher's Disclaimer: This is a PDF file of an unedited manuscript that has been accepted for publication. As a service to our customers we are providing this early version of the manuscript. The manuscript will undergo copyediting, typesetting, and review of the resulting proof before it is published in its final citable form. Please note that during the production process errors may be discovered which could affect the content, and all legal disclaimers that apply to the journal pertain.
References
- 1.Neuschwander-Tetri BA, Caldwell SH. Nonalcoholic steatohepatitis: summary of an AASLD Single Topic Conference. Hepatology. 2003;37(5):1202–19. doi: 10.1053/jhep.2003.50193. Epub 2003/04/30 S0270913903002106 [pii] [DOI] [PubMed] [Google Scholar]
- 2.Starley BQ, Calcagno CJ, Harrison SA. Nonalcoholic fatty liver disease and hepatocellular carcinoma: a weighty connection. Hepatology. 2010;51(5):1820–32. doi: 10.1002/hep.23594. Epub 2010/05/01. [DOI] [PubMed] [Google Scholar]
- 3.Wong RJ, Cheung R, Ahmed A. Nonalcoholic steatohepatitis is the most rapidly growing indication for liver transplantation in patients with hepatocellular carcinoma in the U.S. Hepatology. 2014;59(6):2188–95. doi: 10.1002/hep.26986. [DOI] [PubMed] [Google Scholar]
- 4.Matteoni CA, Younossi ZM, Gramlich T, Boparai N, Liu YC, McCullough AJ. Nonalcoholic fatty liver disease: a spectrum of clinical and pathological severity. Gastroenterology. 1999;116(6):1413–9. doi: 10.1016/s0016-5085(99)70506-8. Epub 1999/05/29. [DOI] [PubMed] [Google Scholar]
- 5.Rafiq N, Bai C, Fang Y, Srishord M, McCullough A, Gramlich T, et al. Long-term follow-up of patients with nonalcoholic fatty liver. Clin Gastroenterol Hepatol. 2009;7(2):234–8. doi: 10.1016/j.cgh.2008.11.005. Epub 2008/12/04. [DOI] [PubMed] [Google Scholar]
- 6.Wong VW, Wong GL, Choi PC, Chan AW, Li MK, Chan HY, et al. Disease progression of non-alcoholic fatty liver disease: a prospective study with paired liver biopsies at 3 years. Gut. 2010;59(7):969–74. doi: 10.1136/gut.2009.205088. [DOI] [PubMed] [Google Scholar]
- 7.Campbell PT, Newton CC, Patel AV, Jacobs EJ, Gapstur SM. Diabetes and cause-specific mortality in a prospective cohort of one million U.S. adults. Diabetes Care. 2012;35(9):1835–44. doi: 10.2337/dc12-0002. [DOI] [PMC free article] [PubMed] [Google Scholar]
- 8.Porepa L, Ray JG, Sanchez-Romeu P, Booth GL. Newly diagnosed diabetes mellitus as a risk factor for serious liver disease. CMAJ. 2010;182(11):E526–31. doi: 10.1503/cmaj.092144. [DOI] [PMC free article] [PubMed] [Google Scholar]
- 9.Koek GH, Liedorp PR, Bast A. The role of oxidative stress in non-alcoholic steatohepatitis. Clin Chim Acta. 2011;412(15–16):1297–305. doi: 10.1016/j.cca.2011.04.013. [DOI] [PubMed] [Google Scholar]
- 10.Jorge AS, Andrade JM, Paraiso AF, Jorge GC, Silveira CM, de Souza LR, et al. Body mass index and the visceral adipose tissue expression of IL-6 and TNF-alpha are associated with the morphological severity of non-alcoholic fatty liver disease in individuals with class III obesity. Obes Res Clin Pract. 2016 doi: 10.1016/j.orcp.2016.03.009. [DOI] [PubMed] [Google Scholar]
- 11.Liu W, Baker RD, Bhatia T, Zhu L, Baker SS. Pathogenesis of nonalcoholic steatohepatitis. Cell Mol Life Sci. 2016;73(10):1969–87. doi: 10.1007/s00018-016-2161-x. [DOI] [PMC free article] [PubMed] [Google Scholar]
- 12.Arrese M, Cabrera D, Kalergis AM, Feldstein AE. Innate Immunity and Inflammation in NAFLD/NASH. Dig Dis Sci. 2016 doi: 10.1007/s10620-016-4049-x. [DOI] [PMC free article] [PubMed] [Google Scholar]
- 13.Heymann F, Tacke F. Immunology in the liver - from homeostasis to disease. Nat Rev Gastroenterol Hepatol. 2016;13(2):88–110. doi: 10.1038/nrgastro.2015.200. [DOI] [PubMed] [Google Scholar]
- 14.Angulo P, Kleiner DE, Dam-Larsen S, Adams LA, Bjornsson ES, Charatcharoenwitthaya P, et al. Liver Fibrosis, but No Other Histologic Features, Is Associated With Long-term Outcomes of Patients With Nonalcoholic Fatty Liver Disease. Gastroenterology. 2015;149(2):389–97. e10. doi: 10.1053/j.gastro.2015.04.043. [DOI] [PMC free article] [PubMed] [Google Scholar]
- 15.Ekstedt M, Hagstrom H, Nasr P, Fredrikson M, Stal P, Kechagias S, et al. Fibrosis stage is the strongest predictor for disease-specific mortality in NAFLD after up to 33 years of follow-up. Hepatology. 2015;61(5):1547–54. doi: 10.1002/hep.27368. [DOI] [PubMed] [Google Scholar]
- 16.Moylan CA, Pang H, Dellinger A, Suzuki A, Garrett ME, Guy CD, et al. Hepatic gene expression profiles differentiate presymptomatic patients with mild versus severe nonalcoholic fatty liver disease. Hepatology. 2014;59(2):471–82. doi: 10.1002/hep.26661. [DOI] [PMC free article] [PubMed] [Google Scholar]
- 17.Teufel A, Itzel T, Erhart W, Brosch M, Wang XY, Kim YO, et al. Comparison of Gene Expression Patterns Between Mouse Models of Nonalcoholic Fatty Liver Disease and Liver Tissues From Patients. Gastroenterology. 2016;151(3):513–25. e0. doi: 10.1053/j.gastro.2016.05.051. [DOI] [PubMed] [Google Scholar]
- 18.Starmann J, Falth M, Spindelbock W, Lanz KL, Lackner C, Zatloukal K, et al. Gene expression profiling unravels cancer-related hepatic molecular signatures in steatohepatitis but not in steatosis. PLoS One. 2012;7(10):e46584. doi: 10.1371/journal.pone.0046584. [DOI] [PMC free article] [PubMed] [Google Scholar]
- 19.Asselah T, Bieche I, Laurendeau I, Paradis V, Vidaud D, Degott C, et al. Liver gene expression signature of mild fibrosis in patients with chronic hepatitis C. Gastroenterology. 2005;129(6):2064–75. doi: 10.1053/j.gastro.2005.09.010. [DOI] [PubMed] [Google Scholar]
- 20.Wruck W, Kashofer K, Rehman S, Daskalaki A, Berg D, Gralka E, et al. Multi-omic profiles of human non-alcoholic fatty liver disease tissue highlight heterogenic phenotypes. Sci Data. 2015;2:150068. doi: 10.1038/sdata.2015.68. [DOI] [PMC free article] [PubMed] [Google Scholar]
- 21.Ahrens M, Ammerpohl O, von Schonfels W, Kolarova J, Bens S, Itzel T, et al. DNA methylation analysis in nonalcoholic fatty liver disease suggests distinct disease-specific and remodeling signatures after bariatric surgery. Cell Metab. 2013;18(2):296–302. doi: 10.1016/j.cmet.2013.07.004. [DOI] [PubMed] [Google Scholar]
- 22.Murphy WJ, Eizirik E, Johnson WE, Zhang YP, Ryder OA, O’Brien SJ. Molecular phylogenetics and the origins of placental mammals. Nature. 2001;409(6820):614–8. doi: 10.1038/35054550. [DOI] [PubMed] [Google Scholar]
- 23.An integrated encyclopedia of DNA elements in the human genome. Nature. 2012;489(7414):57–74. doi: 10.1038/nature11247. Epub 2012/09/08. [DOI] [PMC free article] [PubMed] [Google Scholar]
- 24.Maher B. ENCODE: The human encyclopaedia. Nature. 2012;489(7414):46–8. doi: 10.1038/489046a. Epub 2012/09/11. [DOI] [PubMed] [Google Scholar]
- 25.Mercer TR, Dinger ME, Mattick JS. Long non-coding RNAs: insights into functions. Nat Rev Genet. 2009;10(3):155–9. doi: 10.1038/nrg2521. Epub 2009/02/04. [DOI] [PubMed] [Google Scholar]
- 26.Ponting CP, Oliver PL, Reik W. Evolution and functions of long noncoding RNAs. Cell. 2009;136(4):629–41. doi: 10.1016/j.cell.2009.02.006. Epub 2009/02/26. [DOI] [PubMed] [Google Scholar]
- 27.Yan B, Wang Z. Long noncoding RNA: its physiological and pathological roles. DNA Cell Biol. 2012;31(Suppl 1):S34–41. doi: 10.1089/dna.2011.1544. Epub 2012/05/23. [DOI] [PubMed] [Google Scholar]
- 28.Moran VA, Perera RJ, Khalil AM. Emerging functional and mechanistic paradigms of mammalian long non-coding RNAs. Nucleic Acids Res. 2012;40(14):6391–400. doi: 10.1093/nar/gks296. Epub 2012/04/12. [DOI] [PMC free article] [PubMed] [Google Scholar]
- 29.Nagano T, Fraser P. No-nonsense functions for long noncoding RNAs. Cell. 2011;145(2):178–81. doi: 10.1016/j.cell.2011.03.014. Epub 2011/04/19. [DOI] [PubMed] [Google Scholar]
- 30.Wang KC, Chang HY. Molecular mechanisms of long noncoding RNAs. Mol Cell. 2011;43(6):904–14. doi: 10.1016/j.molcel.2011.08.018. Epub 2011/09/20. [DOI] [PMC free article] [PubMed] [Google Scholar]
- 31.He Y, Wu YT, Huang C, Meng XM, Ma TT, Wu BM, et al. Inhibitory effects of long noncoding RNA MEG3 on hepatic stellate cells activation and liver fibrogenesis. Biochim Biophys Acta. 2014;1842(11):2204–15. doi: 10.1016/j.bbadis.2014.08.015. [DOI] [PubMed] [Google Scholar]
- 32.Yu F, Zheng J, Mao Y, Dong P, Li G, Lu Z, et al. Long non-coding RNA APTR promotes the activation of hepatic stellate cells and the progression of liver fibrosis. Biochem Biophys Res Commun. 2015;463(4):679–85. doi: 10.1016/j.bbrc.2015.05.124. [DOI] [PubMed] [Google Scholar]
- 33.Yan C, Chen J, Chen N. Long noncoding RNA MALAT1 promotes hepatic steatosis and insulin resistance by increasing nuclear SREBP-1c protein stability. Sci Rep. 2016;6:22640. doi: 10.1038/srep22640. [DOI] [PMC free article] [PubMed] [Google Scholar]
- 34.Sun C, Liu X, Yi Z, Xiao X, Yang M, Hu G, et al. Genome-wide analysis of long noncoding RNA expression profiles in patients with non-alcoholic fatty liver disease. IUBMB Life. 2015;67(11):847–52. doi: 10.1002/iub.1442. [DOI] [PubMed] [Google Scholar]
- 35.Konishi H, Ichikawa D, Yamamoto Y, Arita T, Shoda K, Hiramoto H, et al. Plasma level of metastasis-associated lung adenocarcinoma transcript 1 is associated with liver damage and predicts development of hepatocellular carcinoma. Cancer Sci. 2016;107(2):149–54. doi: 10.1111/cas.12854. [DOI] [PMC free article] [PubMed] [Google Scholar]
- 36.Luo JH, Ren B, Keryanov S, Tseng GC, Rao UN, Monga SP, et al. Transcriptomic and genomic analysis of human hepatocellular carcinomas and hepatoblastomas. Hepatology. 2006;44(4):1012–24. doi: 10.1002/hep.21328. [DOI] [PMC free article] [PubMed] [Google Scholar]
- 37.Panzitt K, Tschernatsch MM, Guelly C, Moustafa T, Stradner M, Strohmaier HM, et al. Characterization of HULC, a novel gene with striking up-regulation in hepatocellular carcinoma, as noncoding RNA. Gastroenterology. 2007;132(1):330–42. doi: 10.1053/j.gastro.2006.08.026. [DOI] [PubMed] [Google Scholar]
- 38.Wood GC, Chu X, Manney C, Strodel W, Petrick A, Gabrielsen J, et al. An electronic health record-enabled obesity database. BMC Med Inform Decis Mak. 2012;12(1):45. doi: 10.1186/1472-6947-12-45. Epub 2012/05/30. [DOI] [PMC free article] [PubMed] [Google Scholar]
- 39.Leti F, Malenica I, Doshi M, Courtright A, Van Keuren-Jensen K, Legendre C, et al. High-throughput sequencing reveals altered expression of hepatic microRNAs in nonalcoholic fatty liver disease-related fibrosis. Translational research : the journal of laboratory and clinical medicine. 2015 doi: 10.1016/j.trsl.2015.04.014. [DOI] [PMC free article] [PubMed] [Google Scholar]
- 40.DiStefano JK, Kingsley C, Craig Wood G, Chu X, Argyropoulos G, Still CD, et al. Genome-wide analysis of hepatic lipid content in extreme obesity. Acta Diabetol. 2015;52(2):373–82. doi: 10.1007/s00592-014-0654-3. [DOI] [PMC free article] [PubMed] [Google Scholar]
- 41.Gerhard GS, Benotti P, Wood GC, Chu X, Argyropoulos G, Petrick A, et al. Identification of novel clinical factors associated with hepatic fat accumulation in extreme obesity. Journal of obesity. 2014;2014:368210. doi: 10.1155/2014/368210. [DOI] [PMC free article] [PubMed] [Google Scholar]
- 42.Kleiner DE, Brunt EM, Van Natta M, Behling C, Contos MJ, Cummings OW, et al. Design and validation of a histological scoring system for nonalcoholic fatty liver disease. Hepatology. 2005;41(6):1313–21. doi: 10.1002/hep.20701. Epub 2005/05/26. [DOI] [PubMed] [Google Scholar]
- 43.Wood GC, Chu X, Manney C, Strodel W, Petrick A, Gabrielsen J, et al. An electronic health record-enabled obesity database. BMC medical informatics and decision making. 2012;12:45. doi: 10.1186/1472-6947-12-45. Epub 2012/05/30. [DOI] [PMC free article] [PubMed] [Google Scholar]
- 44.Langmead B, Trapnell C, Pop M, Salzberg SL. Ultrafast and memory-efficient alignment of short DNA sequences to the human genome. Genome Biol. 2009;10(3):R25. doi: 10.1186/gb-2009-10-3-r25. [DOI] [PMC free article] [PubMed] [Google Scholar]
- 45.Anders S, Pyl PT, Huber W. HTSeq--a Python framework to work with high-throughput sequencing data. Bioinformatics. 2015;31(2):166–9. doi: 10.1093/bioinformatics/btu638. [DOI] [PMC free article] [PubMed] [Google Scholar]
- 46.Love MI, Huber W, Anders S. Moderated estimation of fold change and dispersion for RNA-seq data with DESeq2. Genome Biol. 2014;15(12):550. doi: 10.1186/s13059-014-0550-8. [DOI] [PMC free article] [PubMed] [Google Scholar]
- 47.Benjamini Y, Hochberg Y. Controlling the False Discovery Rate: a Practical and Powerful Approach to Multiple Testing. J R Statist Soc B. 1995;57:289–300. [Google Scholar]
- 48.Wu Y, Liu X, Zhou Q, Huang C, Meng X, Xu F, et al. Silent information regulator 1 (SIRT1) ameliorates liver fibrosis via promoting activated stellate cell apoptosis and reversion. Toxicol Appl Pharmacol. 2015;289(2):163–76. doi: 10.1016/j.taap.2015.09.028. [DOI] [PubMed] [Google Scholar]
- 49.Ward JH. Hierarchical Grouping to Optimize an Objective Function. Journal of the American Statistical Association. 1963;58(301):236–44. doi: 10.2307/2282967. [DOI] [Google Scholar]
- 50.Li W, Turner A, Aggarwal P, Matter A, Storvick E, Arnett DK, et al. Comprehensive evaluation of AmpliSeq transcriptome, a novel targeted whole transcriptome RNA sequencing methodology for global gene expression analysis. BMC Genomics. 2015;16:1069. doi: 10.1186/s12864-015-2270-1. [DOI] [PMC free article] [PubMed] [Google Scholar]
- 51.Tacke F, Zimmermann HW, Trautwein C, Schnabl B. CXCL5 plasma levels decrease in patients with chronic liver disease. J Gastroenterol Hepatol. 2011;26(3):523–9. doi: 10.1111/j.1440-1746.2010.06436.x. [DOI] [PMC free article] [PubMed] [Google Scholar]
- 52.Xu L, Hui AY, Albanis E, Arthur MJ, O’Byrne SM, Blaner WS, et al. Human hepatic stellate cell lines, LX-1 and LX-2: new tools for analysis of hepatic fibrosis. Gut. 2005;54(1):142–51. doi: 10.1136/gut.2004.042127. [DOI] [PMC free article] [PubMed] [Google Scholar]
- 53.Farrell GC, Larter CZ. Nonalcoholic fatty liver disease: from steatosis to cirrhosis. Hepatology. 2006;43(2 Suppl 1):S99–S112. doi: 10.1002/hep.20973. [DOI] [PubMed] [Google Scholar]
- 54.Nakamura A, Yoneda M, Fujita K, Tajima K, Kikuchi K, Nakajima A, et al. Impact of glucose tolerance on the severity of non-alcoholic steatohepatitis. J Diabetes Investig. 2011;2(6):483–9. doi: 10.1111/j.2040-1124.2011.00134.x. [DOI] [PMC free article] [PubMed] [Google Scholar]
- 55.Paradis V, Perlemuter G, Bonvoust F, Dargere D, Parfait B, Vidaud M, et al. High glucose and hyperinsulinemia stimulate connective tissue growth factor expression: a potential mechanism involved in progression to fibrosis in nonalcoholic steatohepatitis. Hepatology. 2001;34(4 Pt 1):738–44. doi: 10.1053/jhep.2001.28055. [DOI] [PubMed] [Google Scholar]
- 56.Puthanveetil P, Chen S, Feng B, Gautam A, Chakrabarti S. Long non-coding RNA MALAT1 regulates hyperglycaemia induced inflammatory process in the endothelial cells. J Cell Mol Med. 2015;19(6):1418–25. doi: 10.1111/jcmm.12576. [DOI] [PMC free article] [PubMed] [Google Scholar]
- 57.Li C, Chen J, Zhang K, Feng B, Wang R, Chen L. Progress and Prospects of Long Noncoding RNAs (lncRNAs) in Hepatocellular Carcinoma. Cell Physiol Biochem. 2015;36(2):423–34. doi: 10.1159/000430109. [DOI] [PubMed] [Google Scholar]
- 58.Arendt BM, Comelli EM, Ma DW, Lou W, Teterina A, Kim T, et al. Altered hepatic gene expression in nonalcoholic fatty liver disease is associated with lower hepatic n-3 and n-6 polyunsaturated fatty acids. Hepatology. 2015;61(5):1565–78. doi: 10.1002/hep.27695. [DOI] [PubMed] [Google Scholar]
- 59.Yu F, Lu Z, Cai J, Huang K, Chen B, Li G, et al. MALAT1 functions as a competing endogenous RNA to mediate Rac1 expression by sequestering miR-101b in liver fibrosis. Cell Cycle. 2015;14(24):3885–96. doi: 10.1080/15384101.2015.1120917. [DOI] [PMC free article] [PubMed] [Google Scholar]
- 60.Hamirani YS, Katz R, Nasir K, Zeb I, Blaha MJ, Blumenthal RS, et al. Association between inflammatory markers and liver fat: The Multi-Ethnic Study of Atherosclerosis. J Clin Exp Cardiolog. 2014:5. doi: 10.4172/2155-9880.1000344. [DOI] [PMC free article] [PubMed] [Google Scholar]
- 61.Wobser H, Dorn C, Weiss TS, Amann T, Bollheimer C, Buttner R, et al. Lipid accumulation in hepatocytes induces fibrogenic activation of hepatic stellate cells. Cell Res. 2009;19(8):996–1005. doi: 10.1038/cr.2009.73. [DOI] [PubMed] [Google Scholar]
- 62.Colletti LM, Green M, Burdick MD, Kunkel SL, Strieter RM. Proliferative effects of CXC chemokines in rat hepatocytes in vitro and in vivo. Shock. 1998;10(4):248–57. doi: 10.1097/00024382-199810000-00004. [DOI] [PubMed] [Google Scholar]
- 63.Colletti LM, Kunkel SL, Green M, Burdick M, Strieter RM. Hepatic inflammation following 70% hepatectomy may be related to up-regulation of epithelial neutrophil activating protein-78. Shock. 1996;6(6):397–402. doi: 10.1097/00024382-199612000-00002. [DOI] [PubMed] [Google Scholar]
- 64.Colletti LM, Kunkel SL, Walz A, Burdick MD, Kunkel RG, Wilke CA, et al. The role of cytokine networks in the local liver injury following hepatic ischemia/reperfusion in the rat. Hepatology. 1996;23(3):506–14. doi: 10.1002/hep.510230315. [DOI] [PubMed] [Google Scholar]
- 65.Bisset LR, Schmid-Grendelmeier P. Chemokines and their receptors in the pathogenesis of allergic asthma: progress and perspective. Curr Opin Pulm Med. 2005;11(1):35–42. doi: 10.1097/01.mcp.0000144502.50149.e0. [DOI] [PubMed] [Google Scholar]
- 66.Xia J, Xu X, Huang P, He M, Wang X. The potential of CXCL5 as a target for liver cancer - what do we know so far? Expert Opin Ther Targets. 2015;19(2):141–6. doi: 10.1517/14728222.2014.993317. [DOI] [PubMed] [Google Scholar]
- 67.Guo F, Guo L, Li Y, Zhou Q, Li Z. MALAT1 is an oncogenic long non-coding RNA associated with tumor invasion in non-small cell lung cancer regulated by DNA methylation. Int J Clin Exp Pathol. 2015;8(12):15903–10. [PMC free article] [PubMed] [Google Scholar]
- 68.Colletti LM, Green ME, Burdick MD, Strieter RM. The ratio of ELR+ to ELR- CXC chemokines affects the lung and liver injury following hepatic ischemia/ reperfusion in the rat. Hepatology. 2000;31(2):435–45. doi: 10.1002/hep.510310225. [DOI] [PubMed] [Google Scholar]
- 69.Dominguez M, Miquel R, Colmenero J, Moreno M, Garcia-Pagan JC, Bosch J, et al. Hepatic expression of CXC chemokines predicts portal hypertension and survival in patients with alcoholic hepatitis. Gastroenterology. 2009;136(5):1639–50. doi: 10.1053/j.gastro.2009.01.056. [DOI] [PubMed] [Google Scholar]
- 70.Karlmark KR, Weiskirchen R, Zimmermann HW, Gassler N, Ginhoux F, Weber C, et al. Hepatic recruitment of the inflammatory Gr1+ monocyte subset upon liver injury promotes hepatic fibrosis. Hepatology. 2009;50(1):261–74. doi: 10.1002/hep.22950. [DOI] [PubMed] [Google Scholar]
- 71.Quinn JJ, Chang HY. Unique features of long non-coding RNA biogenesis and function. Nat Rev Genet. 2016;17(1):47–62. doi: 10.1038/nrg.2015.10. [DOI] [PubMed] [Google Scholar]
- 72.Liu SJ, Nowakowski TJ, Pollen AA, Lui JH, Horlbeck MA, Attenello FJ, et al. Single-cell analysis of long non-coding RNAs in the developing human neocortex. Genome Biol. 2016;17:67. doi: 10.1186/s13059-016-0932-1. [DOI] [PMC free article] [PubMed] [Google Scholar]
- 73.Shalek AK, Satija R, Adiconis X, Gertner RS, Gaublomme JT, Raychowdhury R, et al. Single-cell transcriptomics reveals bimodality in expression and splicing in immune cells. Nature. 2013;498(7453):236–40. doi: 10.1038/nature12172. [DOI] [PMC free article] [PubMed] [Google Scholar]
- 74.Chiang DJ, Pritchard MT, Nagy LE. Obesity, diabetes mellitus, and liver fibrosis. Am J Physiol Gastrointest Liver Physiol. 2011;300(5):G697–702. doi: 10.1152/ajpgi.00426.2010. Epub 2011/02/26. [DOI] [PMC free article] [PubMed] [Google Scholar]
Associated Data
This section collects any data citations, data availability statements, or supplementary materials included in this article.