Abstract
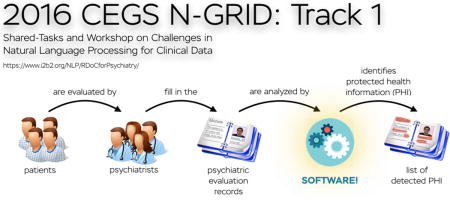
The 2016 CEGS N-GRID shared tasks for clinical records contained three tracks. Track 1 focused on de-identification of a new corpus of 1,000 psychiatric intake records. This track tackled de-identification in two sub-tracks: Track 1.A was a “sight unseen” task, where nine teams ran existing de-identification systems, without any modifications or training, on 600 new records in order to gauge how well systems generalize to new data. The best-performing system for this track scored an F1 of 0.799. Track 1.B was a traditional Natural Language Processing (NLP) shared task on de-identification, where 15 teams had two months to train their systems on the new data, then test it on an unannotated test set. The best-performing system from this track scored an F1 of 0.914. The scores for Track 1.A show that unmodified existing systems do not generalize well to new data without the benefit of training data. The scores for Track 1.B are slightly lower than the 2014 de-identification shared task (which was almost identical to 2016 Track 1.B), indicating that these new psychiatric records pose a more difficult challenge to NLP systems. Overall, de-identification is still not a solved problem, though it is important to the future of clinical NLP.
Keywords: Natural language processing, machine learning, clinical records, shared task
Graphical abstract
1. Introduction
The 2016 Centers of Excellence in Genomic Science (CEGS) and Neuropsychiatric Genome-Scale and RDOC Individualized Domains (N-GRID) shared tasks for clinical records contained three tracks. Track 1 focused on de-identification of a new corpus of 1,000 psychiatric intake records. This corpus is the first of its kind made available to the medical NLP community. Psychiatric records are substantially different in content compared to records seen in previous de-identification challenges in that they contain significantly more text and more personal details about the patients’ lives. Previous corpora for clinical Natural Language Processing (NLP) challenges have included records focused on detailed data about the patients’ physical health: test results, measurements, family histories of disease, and so on. In contrast, psychiatric intake records contain considerably more details about patients’ personal and social lives: places lived, jobs held, children’s ages, names, and occupations, hobbies, traumatic events, even pet names. These details make de-identifying psychiatric intake records a new challenge for automated computer systems.
The United States’ Health Insurance Portability and Accountability Act (HIPAA; 45 CFR 164.514) defines 18 categories of information about patients and their families, employers, and household members that must be removed from medical records in order for the records to be “de-identified” (Table 1). Category R of HIPAA refers to “any other unique identifying number, characteristic, or code” and may broadly cover people’s jobs, hobbies, military history, or criminal backgrounds. The challenge of applying Category R to our corpus is determining which pieces of data about a patient – or anyone else mentioned in the record, including medical staff – could open a path to identification. We discuss these challenges further in Sections 3, 4.1, and For the de-identification task of the 2016 CEGS N-GRID Shared Tasks, we organized two tracks: 1.A and 1.B. Track 1.A aimed to evaluate whether the systems that were already trained on other data sets (such as the i2b2 2014 data set) would generalize to the new data in the 2016 corpus. To that end, this track focused on de-identification outputs generated by existing systems, without any training or modifications related to psychiatric records, on 600 unannotated records from the 2016 data. Participants had three days to run their systems and submit up to three sets of results.
Table 1.
HIPAA-defined Private Health Information (PHI) categories (quoted from 45 CFR 164.514)
The following identifiers of the individual or of relatives, employers, or household members of the individual, are removed:
|
Track 1.B followed a more standard approach to shared tasks. The goal of Track 1.B was to design new or update existing systems for new data, and to advance the state of the art in medical record de-identification. Accordingly, we released 600 records with gold standard annotations for training data, and participants had two months to train their systems. After the training period, we released the 400 test records with no annotations, and participants had three days to run their systems and submit up to three sets of results.
This paper provides a brief overview of Track 1, the de-identification track of the CEGS N-GRID 2016 shared task. The paper is organized as follows: related work (Section 2), data (Section 3) and methods (Section 4). Sub-task 1.A, the sight unseen task, is described in Section 5 including its evaluation, participants, results, and error analysis, including comparisons to the 2014 shared task which was almost identical in its nature to the 2016 de-identification task. Task 1.B, the traditional de-identification task, is described similarly in Section 6. We close the paper with a discussion (Section 7) and conclusions (Section 8).
2. Related work
Due to the difficulty of obtaining medical records and the permission to share them, there have been relatively few shared tasks using clinical records, and even fewer de-identification tasks.
The 2006 i2b2 (Informatics for integrating Biology and the Bedside) shared task in de-identification used 889 discharge summaries from Partners HealthCare (Uzuner, Luo, and Szolovits 2007). The organizers cleaned and tokenized the summaries prior to annotating them for PHI. The annotation guidelines for the 2006 task specified the following PHI categories: patients, doctors, hospitals, IDs, dates (excluding years), locations (specifically “cities, states, street names, zip codes, building names, and numbers”), phone numbers, and ages over 90. When preparing the discharge summaries for release, the organizers replaced the original PHI with surrogate PHI (i.e., made up names and places). In order to examine the effect of ambiguity on the systems, they deliberately replaced some names with medical terms (e.g, disease or test names). Seven teams participated in this task, submitting a total of 16 system runs. The systems performed worst on identifying locations and phone numbers, but scores for hospital and doctors tended to be higher.
The 2012 NTCIR-10 de-identification task (Morita et al. 2013) used 50 fabricated medical reports written in Japanese. Their annotation guidelines focused on the following PHI categories: “age, person’s name, sex, time, hospital name, and location”. Their definition of “time” included year, month, and day. Six groups submitted 15 system runs to this task. Overall, the systems performed worst when identifying ages, and best when identifying hospitals.
The 2014 i2b2/UTHealth (University of Texas Health Science Center at Houston) shared task (Stubbs and Uzuner 2015) used a new corpus of 1,304 longitudinal medical records from Partners HealthCare. The 2014 corpus consists of “a mixture of discharge summaries and correspondences between medical professionals” (Kumar et al. 2015) and included an expanded list of PHI (see Section 4.1 for the full list). Ten teams submitted 22 system runs to this shared task. Professions and locations proved to be the most difficult PHI for the systems to correctly identify, while dates and ages were easier to find.
Overall, the number of teams and submissions to the past shared tasks shows that interest in de-identification is strong and growing. The differences in the task outcomes indicate that some PHI categories present greater and lesser challenges in different corpora, though certain categories (such as LOCATION) are consistently difficult in English data. These challenges are likely due to linguistic and distributional differences of the corpora, in addition to changes in capabilities of de-identification systems due to advances in technology. We investigate these challenges further in this paper by comparing the 2014 and 2016 corpora.
The 2016 CEGS N-GRID de-identification track differs from the past efforts both in its use of psychiatric intake records (first ever released to the community) and the linguistic challenges that these records present. Compared to the 2014 data set, the 2016 records contain more PHI overall but fewer PHI compared to the total number of words, significantly different PHI distributions from the 2014 data set, and consistent problems with conjoined tokens, which make processing these records more challenging (see Section 3 for more details). Track 1.A of the 2016 shared task is a sight unseen challenge, where participants tested their existing, unmodified systems against brand new data. Track 1.A provided insight into what PHI are more challenging in this data set, while Track 1.B allowed participants to test the limits of traditional machine learning methods on this new set of psychiatric intake records.
3. Data
We used a new corpus of 1,000 psychiatric intake records, which were randomly selected from Partners HealthCare. Intake records are extensive interviews with patients. They contain information about the patients, their medical and psychiatric histories, drug and alcohol use, family history, current living situations, and other information potentially relevant to their psychiatric problems. These records are mixtures of standard questionnaires and narrative descriptions of the patient’s answers, as well as the clinician’s observations about the patient (see Figure 1).
Figure 1.
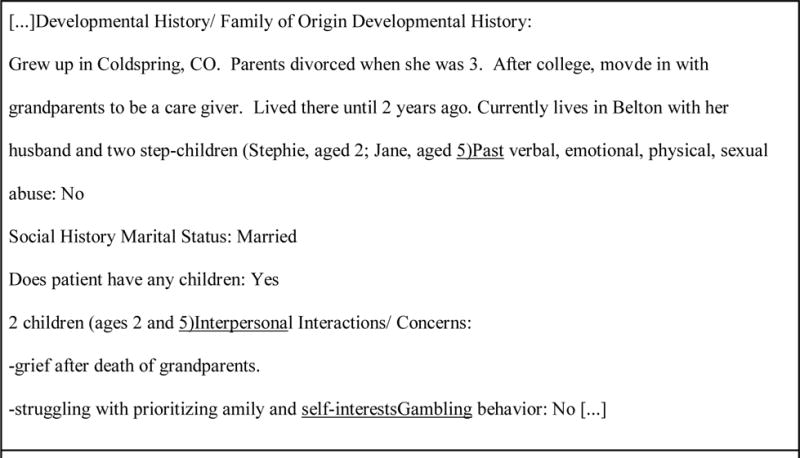
Excerpt from a sample fabricated record showing errors, including spelling mistakes and missing line breaks (underlined).
Table 2 describes the number of whitespace-separated tokens in this corpus overall and per record. It compares this corpus to the 2014 i2b2/UTHealth de-identification task corpus (Stubbs and Uzuner 2015). Overall, the 2016 corpus contains three times as many tokens per record than the 2014 corpus, due to the extensive notes the psychiatrists in this data set take about their patients.
Table 2.
Comparison of token counts in 2016 and 2014 shared task corpora
| 2016 | 2014 | |
|---|---|---|
| Total tokens | 1,862,452 | 805,118 |
| Average per record | 1,862.4 | 617.4 |
| Max | 4,610 | 2,984 |
| Min | 304 | 617 |
Much like the 2014 i2b2/UTHealth corpus, the 2016 corpus contained raw text of the records as drawn from the hospital. As a result, the records contained significant amounts of spelling and punctuation errors, line break errors, and conjoined paragraphs. Additionally, there is a peculiarity about how these records were stored that is worth noting: in the questionnaire sections, if an answer other than “yes” or “no” is entered, the end of that answer is merged with the next standard question. Figure 1 shows a sample excerpt from a fabricated record, with examples of this formatting issue underlined.
We used these records for the 2016 CEGS N-GRID shared tasks “as is”; the records accurately reflect the state of the data as we received it from Partners. This decision increased the difficulty of both annotating the data and training machine learning (ML) systems on the data (see Sections 4, 5, and 6), but presented a real-world scenario for the participants.
In preparation for the shared tasks, we split the corpus 60%-40%. The unannotated version of the 600 records in the 60% became the test data for Track 1.A. The annotated version of the 600 records became the training set for Track 1.B, and we used the remaining 400 records as the test set for Track 1.B.
3.1. PHI distribution in the corpus
The 2016 corpus contains more than 34,000 PHI phrases, with an average of 34 PHI phrases per record (Table 3). The maximum number of PHI phrases per record is 130. This corpus contains many more PHI instances in total and on average per record than the 2014 corpus. However, when comparing the number of PHI phrases to the number of whitespace-separated tokens, we see that the PHI are actually more sparse in the 2016 corpus: the ratio of PHI to tokens is much lower in 2016 (.0185) than 2014 (.0358). This contributed to the low recall metrics discussed in Section 5.1: the PHI signal was simply harder to identify in the noise of the rest of the text.
Table 3.
PHI category distributions between 2016 training and testing data, and comparison of PHI category totals between 2016 and 2014 corpora
| PHI category | Total #: 2016 | Total #: 2014 |
|---|---|---|
| NAME: PATIENT | 2,107 | 2,195 |
| NAME: DOCTOR | 3,963 | 4,797 |
| NAME: USERNAME | 25 | 356 |
| PROFESSION | 2,481 | 413 |
| LOCATION: HOSPITAL | 3,523 | 2,312 |
| LOCATION: ORGANIZATION | 1,810 | 206 |
| LOCATION: STREET | 80 | 352 |
| LOCATION: CITY | 2,214 | 654 |
| LOCATION: STATE | 1,143 | 504 |
| LOCATION: COUNTRY | 1,042 | 183 |
| LOCATION: ZIP CODE | 40 | 352 |
| LOCATION: OTHER | 44 | 17 |
| AGE | 5,991 | 1,997 |
| DATE | 9,544 | 12,487 |
| CONTACT: PHONE | 256 | 524 |
| CONTACT: FAX | 9 | 10 |
| CONTACT: EMAIL | 7 | 5 |
| CONTACT: URL | 8 | 2 |
| CONTACT: IPADDRESS | 0 | 0 |
| ID: SSN | 0 | 0 |
| ID: MEDICAL RECORD | 6 | 1033 |
| ID: HEALTH PLAN | 2 | 1 |
| ID: ACCOUNT | 0 | 0 |
| ID: LICENSE | 59 | 0 |
| ID: VEHICLE | 0 | 0 |
| ID: DEVICE | 0 | 15 |
| ID: BIO ID | 0 | 1 |
| ID: ID NUMBER | 10 | 456 |
| Total # of PHI phrases | 34,364 | 28,872 |
| Average PHI per file | 34 | 22.14 |
Table 3 shows the number of PHI phrases in each category and subcategory in the 2016 and 2014 corpora. The descriptive nature of the intake records can be inferred by comparing the numbers of different types of PHI in the corpora. The 2014 corpus focuses heavily on the names of the medical staff (NAME: DOCTOR), and contained significantly more instances of NAME: USERNAME, LOCATION: STREET, LOCATION: ZIP, DATE, ID: MEDICAL RECORD, and ID: DEVICE. In terms of content, the records in the 2014 corpus detail patient locations, the dates of different medical procedures and tests, and information on medical personnel (e.g., sign off user names). In comparison, the 2016 records include more information about patients’ lives overall: their livelihoods (PROFESSION), where they lived (LOCATION: CITY and LOCATION: STATE), where they worked (LOCATION: ORGANIZATION), and their ages (AGE) at different milestones in their lives.
Table 3 also shows the split in PHI distributions between the training and testing data for Task 1.B. With the exception of NAME: USERNAME and a few other sparsely represented categories, the training set has roughly the same distribution of tags as the testing set.
4. Methods
4.1. Annotation guidelines
2016 CEGS N-GRID de-identification tasks used the annotation guidelines developed for the 2014 i2b2/UTHealth shared task (Stubbs and Uzuner 2015). These guidelines expand the definitions of some of the HIPAA PHI categories (see Table 1) so that they include doctors (NAME: DOCTOR) and hospitals (LOCATION: HOSPITAL), all types of locations including states (LOCATION: STATE), countries (LOCATION: COUNTRY), and broad geographical areas such as “the Northeast” (LOCATION: OTHER). The 2016 guidelines also cover all parts of dates including years. Additionally, they include a PHI category for jobs the patient or family members had or have (PROFESSION). Different from 2014, the 2016 PHI explicitly included “generic” organizations in the LOCATION: ORGANIZATION tag. Locations such as “deli” or “gas station” fell under this tag. Although they are not named organizations, these locations, in combination with the rest of the information contained in these records, increase the possibility of identifying the patient. Therefore, we obfuscated them.
Table 4 shows the PHI categories and subcategories applied to our data. By grouping the PHI this way, we facilitated the annotation process.
Table 4.
PHI categories and subcategories for 2016 de-identification annotation. Similar tables appeared in previous publications (Stubbs and Uzuner 2015; Stubbs, Kotfila, and Uzuner 2015)
| Category | Subcategory |
|---|---|
| NAME | PATIENT, DOCTOR, USERNAME |
| AGE | n/a |
| DATE | n/a |
| LOCATION | STREET, ZIP, CITY, STATE, COUNTRY, HOSPITAL, ORGANIZATION, LOCATION-OTHER |
| CONTACT | EMAIL, FAX, PHONE, URL |
| ID | SOCIAL SECURITY NUMBER, MEDICAL RECORD NUMBER, HEALTH PLAN NUMBER, ACCOUNT NUMBER, LICENSE NUMBER, VEHICLE ID, DEVICE ID, BIOMETRIC ID, ID NUMBER |
| PROFESSION | n/a |
| OTHER | n/a |
4.2. Annotation Procedure
We followed the process outlined in Figure 2 to create the gold standard for the shared task. Three undergraduate students, two from MIT and one from Wellesley, carried out the annotations. We randomly assigned each record to two annotators, who worked in parallel (Figure 2, Step 2). One of the authors (AS) adjudicated their annotations by checking all the annotations, and by reading through the documents for any missed PHI (Step 3). After that, we ran a program that checked to ensure that all instances of PHI were annotated in each record (Step 4). If we discovered any, we added the annotations to the adjudicated files and re-ran the program. In the absence of any missed PHI, we generated realistic surrogates to replace the PHI (Step 5), then read through the files again to ensure that the surrogates were consistently replaced and made sense in context (Step 6). Finally, we read through the records a final time and removed any text segments that contained too many personal details about the patient that could lead to them being identified, even if the segments did not contain any direct PHI (Step 7). For example, one record contained a long, detailed list of the offenses of which a patient had been convicted. Each conviction individually would not have lead to the patient being identified (especially with relevant PHI already replaced), but the list taken together could have lead to the patient’s identity if the combination was sufficiently unique. We made similar decisions with other patient records. Once such segments were removed, we finalized the gold standard for the task.
Figure 2.
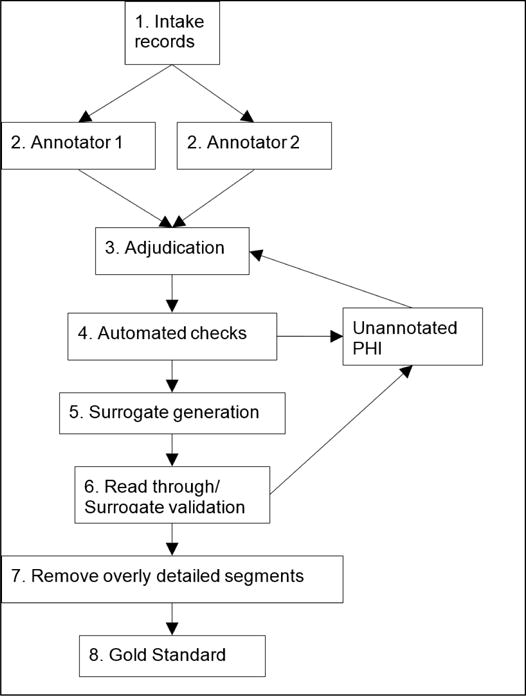
Procedure for creating the gold standard
Previous research (Yeniterzi et al. 2010) has shown that using surrogate PHI to train systems decreases the performance of those systems when applied to authentic PHI. This does suggest that using surrogate PHI somewhat limits the utility of the data in real-world settings. However, we posit that the addition of a new type of clinical narrative, the psychiatric intake records, adds value to the field of de-identification as a whole, despite the use of surrogate PHI, which was required by HIPAA.
For surrogate generation, we used the same methods described in (Stubbs and Uzuner 2015). Specifically, we replaced the PHI with authentic-sounding surrogates: we generated false names, locations, and professions by randomly selecting identifiers from pre-compiled lists. Additionally, we ensured that the replacements were consistent within each individual record. We shifted all dates into the future by a random number of days, months, and years, and that number was different for each record. We replaced named entities (people and locations) and professions consistently within each record, and made an effort to re-create spelling errors. When a person’s profession had an impact on other aspects of their lives, we tried to ensure that their surrogate profession still fit within the narrative. For example, if a patient was at risk for mesothelioma due to her time as a firefighter, the surrogate for “firefighter” would be a job with a similar risk profile. These checks and replacements were carried out by hand so that the data for the shared task would be both syntactically correct and as realistic and accurate as possible, while still protecting patient privacy.
4.3. Evaluation Metrics
We evaluated annotator accuracy and participant’s results using micro-averaged (i.e., averaged the results over the complete corpus) precision (Eq. 1), recall (Eq. 2), and F1-measure (Eq. 3).
| Eq. 1 |
| Eq. 2 |
| Eq. 3 |
We computed1 multiple versions of these metrics for evaluation, including variations for the strictness of offset matching and combinations of PHI. The evaluation script allows three levels of strictness:
Strict (aka phrase-based matching): first and last offset must match exactly
Relaxed: also phrase-based but the last offset can be off by up to 2 characters
Overlap: (aka token-based matching): matches if system annotates a token that is contained in a gold standard PHI
The evaluation script also allows two variations of PHI detection:
All PHI: all PHI in the gold standard, which is annotated more strictly than HIPAA requires
- HIPAA PHI: PHI that HIPAA requires only
-
◦excludes doctor names, hospital names, professions, locations larger than state
-
◦
We used strict- and overlap matching over all PHI to evaluate the quality of the annotation. For tracks 1.A and 1.B, we used strict matching for all PHI as our primary ranking metric, and ranked teams based on their F1 score from their best run.
5. Results
5.1. Annotation quality
As previously noted, two annotators worked in parallel to identify the PHI in each document. This process resulted in two singly-annotated sets of the corpus. We compared each set of annotations against the adjudicated gold standard (Figure 2, step 3), calculated micro-averaged precision, recall, and F1, and averaged the results from both sets to determine annotation quality. We used two agreement measures: (1) strict (aka phrase-based) matching, where the beginning and ending of each tag had to match the gold standard exactly, and (2) overlap (aka token-based) matching, where separate tags for parts of a PHI are considered equivalent to a single tag that covers all parts of that PHI, e.g., “Tamika” “Flynn” is equivalent to “Tamika Flynn” tag in the gold standard. Table 5 shows the results of both the strict and overlap matching in the 2016 corpus, and compares the results to the 2014 annotations (Stubbs and Uzuner 2015).
Table 5.
Comparison of annotation quality between 2014 and 2016 shared tasks.
| Strict (phrase-based) matching | ||
|---|---|---|
| 2016 | 2014 | |
| Average precision | 0.896 | 0.904 |
| Average recall | 0.816 | 0.887 |
| Average F1 | 0.851 | 0.895 |
| Overlap (token-based) matching | ||
| Average precision | 0.964 | 0.939 |
| Average recall | 0.874 | 0.920 |
| Average F1 | 0.913 | 0.930 |
The most striking difference between the annotations over the two years is the comparatively low recall scores in 2016: in other words, we had higher rates of false negatives in 2016 than in 2014. This difference is largely accounted for by three factors. First, there was some confusion over whether quasi-generic descriptions of patients and organizations should be annotated as PHI in 2016: “teen” was annotated while “child” was not; whether “Army” should be annotated at all, and so on. In the end, most of these were included in the gold standard (except for “child”), lowering the annotators’ recall. Second, PHI in the 2016 corpus were somewhat harder to find due to the fact that the PHI-to-token ratio is much lower in the 2016 corpus (see Section 2.1). In other words, the PHI signal was simply harder to identify in the noise of the rest of the text. Third, the line formatting errors described in Section 2 meant that PHI were often merged with standard questions, making them harder to see.
The overlap evaluation yields higher scores than strict evaluation for both data sets. Examining the 2016 and 2014 annotations showed that when comparing annotators’ work to the gold standard, there were many off-by-one-character errors at the beginning and end of words and phrases (i.e., including a space or a period), and that there was some discrepancy in annotation styles: some annotators annotated names as two PHI (“Tamika” “Flynn”) rather than one (“Tamika Flynn”), and some annotators included the word “Hospital” as part of the hospital name (“Mass General Hospital”) while others did not (“Mass General” Hospital). These differences are relatively minor, and we resolved them during the adjudication phase of the de-identification process.
5.2. Track 1.A: Sight unseen
Track 1.A focused on testing the portability of existing, unmodified systems to new data. We ran this task on 600 unannotated psychiatric records. Participants had three days to run their systems on the data and submit up to three system runs. We evaluated each team on their best performing run.
For Track 1.A, we evaluated teams against a slightly modified version of the gold standard. As mentioned before, different from 2014, the 2016 annotations included “generic” locations (i.e., “gas station”) in the LOCATION: OTHER category. In order to make Track 1.A description consistent with past challenges, so that we can test the portability of systems to new data when the task remains unchanged, we removed generic organizations from the gold standard for this task.
5.2.1. Participants
Nine teams, with members representing 12 institutions and seven countries participated in Track 1.A. In total, we received 20 submissions, three of which were incompatible with the evaluation script and could not be scored. Table 6 shows the teams, self-reported methods, and represented institutions and countries that participated in Track 1.A.
Table 6.
Teams participating in Track 1.A.
| # | Affiliations | # of members | # of runs | methods | Manipulated data | Countries |
|---|---|---|---|---|---|---|
| 1 | California State University San Marcos | 1 | 2 | rule-based | 1 manipulated 1 unmanipulated |
USA |
| 2 | Harbin Institute of Technology Shenzhen Graduate School | 3 | 3 | hybrid | unmanipulated | China |
| 3 | Harbin Institute of Technology | 3 | 1 | supervised | unmanipulated | China |
| 4 | LIMSI-CNRS | 4 | 3 | hybrid | 2 unmanipulated 1 manipulated |
France |
| 5 | Med Data Quest Inc. | 5 | 1 | supervised | unmanipulated | USA |
| 6 | MITRE | 7 | 3 | supervised | unmanipulated | USA |
| 7 | NED University of Engineering & Technology | 3 | 1 | rule-based | manipulated | Pakistan |
| 8 | The University of Manchester University of Novi Sad Australian Inst. of Health Informatics University of Oxford | 6 | 3 | hybrid | unmanipulated | UK Serbia Australia |
| 9 | University of Texas Health Science Center at Houston | 8 | 3 | semi-supervised | 1 unmanipulated 2 manipulated |
USA |
| 12 institutions | 40 researchers | 20 runs | 3 hybrid 2 rule-based 3 supervised 1 semi-supervised |
5 yes 9 no |
7 countries |
As Table 6 shows, supervised and hybrid solutions (which also include a supervised component) are heavily represented in the methods of the participants. Since they rely on a training data set that represent similar distributions to their test set, these methods are at a distinct disadvantage when applied sight unseen to data drawn from different sources if the new sources represent different distributions. Similarly, rule-based systems are known to require tuning to adapt to new data.
The “manipulated data” column in Table 6 shows whether the participants made any modifications to their data prior to running it through their systems. These manipulations largely focused on tokenization and fixing the line break problems described in Section 3.
5.2.2. Results and error analysis
Using the evaluation scripts described in Section 4.3, we computed the aggregate results (strict matching, all PHI categories) of all the system outputs that were compatible with the evaluation software. The median score was 0.629 (standard deviation = 0.206, mean = 0565, minimum = 0.048). The top-performing system for this track achieved an F1 measure of 0.799. Compared to the results of the 2014 shared task, in which the median score was 0.845 and the maximum was 0.936 (Stubbs and Uzuner 2015), we see that the scores are substantially lower in 2016. This comparison provides insight into what caliber of results an out-of-the-box system might feasibly be expected to obtain on new data.
Table 7 lists the precision, recall and F1 for the best run (as determined by F1) from each team who submitted data compatible with the evaluation script. All teams achieved higher precision than recall. The top four teams achieved F1 scores of over 64%, with the top two achieving F1s over 74%. Even without further training on this new data, these results could potentially provide the basis for a subsequent manual annotation effort.
Table 7.
2016 Team ranks and scores for Task 1.A, best runs only. Strict matching, all PHI categories.
| Rank | Team | Systems and processing | Precision | Recall | F1 |
|---|---|---|---|---|---|
| 1 | Harbin Institute of Technology Shenzhen Graduate School | Tokenization 2 methods:
|
0.8257 | 0.7330 | 0.7985 |
| 2 | University of Texas Health Science Center at Houston | Tokenization Rules CRF Error correction (H.-J. Lee et al., n.d.) |
0.8515 | 0.6584 | 0.7426 |
| 3 | Harbin Institute of Technology | Tokenization (rules and OpenNLP2) CRF(Zhao, He, and Guan 2016) |
0.7964 | 0.6037 | 0.6868 |
| 4 | The University of Manchester | CRF systems:
|
0.7443 | 0.5683 | 0.6445 |
| 5 | LIMSI-CNRS | CRF and rules (Grouin 2016a), based on Wapiti (Lavergne, Cappé, and Yvon July 11 – 16, 2010) | 0.6577 | 0.4391 | 0.5266 |
| 6 | MITRE | CRF: MIST(Carrell et al. 2013)(Wellner et al. 2007; Aberdeen et al. 2016) | 0.6333 | 0.4087 | 0.4968 |
| 7 | Med Data Quest Inc. | n/a | 0.4336 | 0.1185 | 0.1861 |
Figure 3 shows each team’s best run F1 scores for individual PHI categories. Generally speaking, PROFESSION, LOCATION, and ID proved to be the most difficult categories, while NAME, DATE and AGE were easier. Low sample sizes in the 2014 data for PROFESSION, LOCATION, and ID in the 2014 data may account for much of the difficulty in identifying them in the 2016 data, as the distributional models in existing systems will not accurately reflect the new data.
Figure 3.
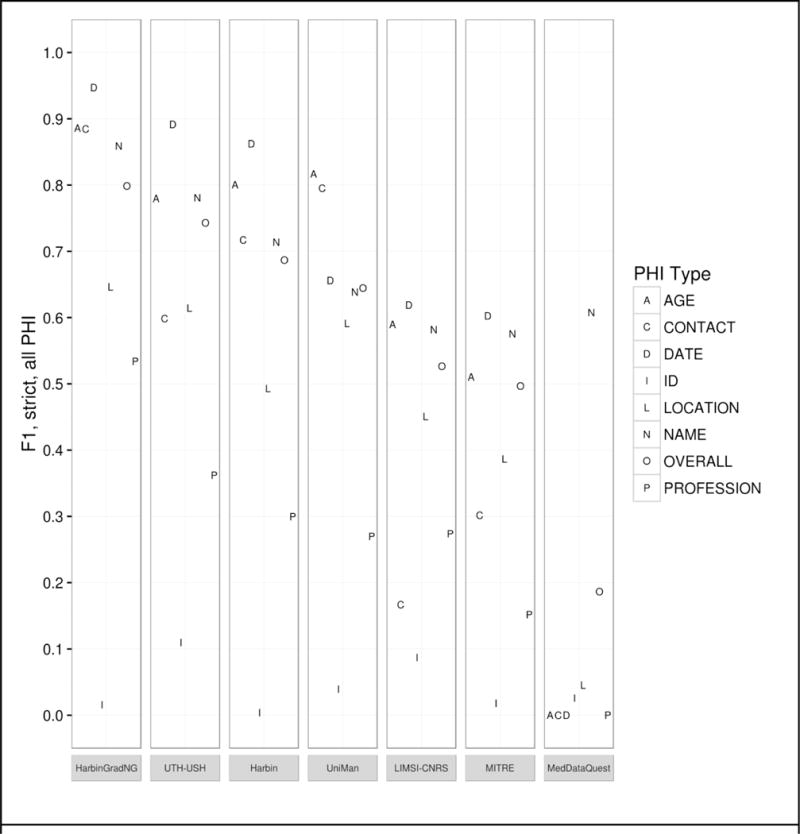
Track 1.A results by PHI category - Strict F1, all PHI.
In this track, the teams that experimented with modifying their tokenizers performed best. Beyond addressing the lack of line breaks, the HarbinGrad team used a bi-directional LSTM (long-short term memory) with three components: one for characters, one for tokens, and one for tags. The UTH team’s system combined pre-processing tokenization with rules for identifying IDs and EMAILs, and two CRFs: one to detect numbers and one to detect strings. On the other hand, teams that used only one or two out-of-the-box systems did not perform as well.
In order to better analyze how the different systems approached the task and handled different types of PHI, we analyzed the top run from each system using all PHI and strict matching. We excluded MedDataQuest from the analysis, as their system performance was an extreme outlier. The charts in Figure A in the Appendix show the distribution of each PHI category compared to the number of systems that correctly identified the PHI. For example, Figure A1 shows the distribution of AGEs: the x-axis shows the number of teams who correctly identified the AGE, and the y-axis shows the number of AGEs identified. Additionally, in order to evaluate the effect of the missing line breaks in the files (see Figure 1), each bar is split between PHI that were immediately followed by a capital letter, and those that were not.
We can see from the charts in Figure A that the missing line breaks did contribute to PHI not being annotated, as none of the PHI tagged by all teams were followed immediately by a capital letter. However, in many cases, particularly DATE, AGE, and CONTACT, three or four systems were still able to correctly annotate the PHI followed by a capital letter. These teams (HarbinGrad, Harbin, UTH, and UniMan) all specifically addressed tokenization in their papers, particularly in relation to the line breaks. While technically the teams were not supposed to modify their existing systems in any way, the addition of a simple rule to detect capital letters after numbers inside of strings had a decided effect on the accuracy of the system outputs.
PHI that met clear patterns or appeared in certain contexts were the easiest for all the teams to identify. AGEs followed by “year old”, “yo”, “year-old”, “y.o.”, “y/o” or preceded by “age”; DATEs in a standard representation such as Month day, year (e.g., May 5, 2016), mm/dd/yyyy, mm/yyyy, and mm/dd; and PHONEs with the format ###-###-#### preceded or followed by the word “phone” were all easily found.
However, PHI that required context and inference to interpret to identify were not marked by any systems. For example, a patient’s age during a past event was often estimated and written as “12/13” or “12–13”, leading some systems to misclassify these as dates. Systems also missed ages of infants written in months (e.g., “8mo”), all uses of ‘teen’ or ‘teenager’, and mentions of familial relationships followed by ages (e.g., “daughter 8, son 6”). Similarly for DATEs, the seasons “fall” and “spring” were not annotated, nor were mentions of decades (“the 60s”, “mid-2010s”), or abbreviations of years (“09”, “2011–12”, “77/78”). Phone numbers with extensions or lacking hyphens were also missed or identified incorrectly.
In many of these cases, it can be difficult even for a human to determine if, for example, “60s” is a reference to the person’s age at the time or the decade in which the event happened, and we must rely on other context (the date on the record, the person’s current age compared to when the event occurred) to tell what category of PHI to use. However, these distinctions are critical, not just for PHI-detecting systems, but for any system trying to retrieve information from a clinical narrative.
It is not surprising that hardly any ID numbers were identified by any system; the records used for this task primarily contained the license number used to verify a drug prescription, which is a use of IDs unseen in previous shared task data sets.
Regarding the text-based PHI, we again see the important of established linguistic patterns in correctly identifying the categories. As long as the line breaks and capitalization were correct, all systems got the LOCATION-CITY tags for places in the context of “live(s) in” (e.g., “lives in Boston”), the LOCATION-HOSPITAL tags for places with “hospital” “health center”, or other care-related word in the name, as well as abbreviations of names that appeared elsewhere in the document. Similarly, all systems could identify DOCTORs who were referred to as “Dr.” or “MD” in the text, and PATIENTs addressed as “Mr.”, “Mrs.”, or “Ms.”. However, some systems had difficulties when those names were hyphenated or used initials.
No systems were able to correctly identify some of the locations that were not capitalized (“lives in stormville”) or entirely capitalized (“moved to NEW LONDON”), or those preceded by “B/R” (short for “born and raised”, e.g. “B/R Milton). The line breaks were also significantly more of an issue, especially for STATEs. For NAMEs, no one got patient nicknames, or patients who were referred to by their initials, or in a context with unusual punctuation (e.g., “2 sons Tom Stan”).
Context is important in identifying what type of LOCATIONs is in the text. If a system uses a dictionary to recognize that “Sydney” is a city, it may not look at surrounding context to see that the text is referring to “Sydney High School” or “Sydney Hospital”. The LOCATION: OTHER tag is relatively rare, but can be as specific as “the Leaning Tower of Pisa” or as generic as “Europe”, making it a difficult tag to use a pre-existing dictionary for.
Finally, the PROFESSION tag proved to be one of the most difficult to identify, with the lack of line breaks having a clear effect on all the systems. Many (but not all) PROFESSIONs preceded by “works as”, “is a”, “was a” or “as a” were identified by all systems, though in some cases that context was not sufficient (for example, only three teams correctly tagged “baker” in “Her mother was a baker.”). This data set included many instances of people’s work being referred to in a context other than simply “he is a photographer”: references to the types of degrees a person has are also considered PROFESSIONs (e.g., “studied Library Science”, “degree in IT”), the type of company the person worked in (e.g., “investment firm”), and general descriptions of employment, particularly in the context of unusual grammatical constructions (e.g., “worked finance”), are all items that no system was able to identify.
Overall, PHI appearing in the immediate contexts that are correctly capitalized and grammatical, and are in phrases that would appear in other medical records were easy for all the out-of-the-box systems to identify. Teams that made adjustments for the unusual lack of line breaks were able to identify even more PHI. However, the psychiatric notes in these data sets are both more narrative and use different abbreviations and shorthands than other medical records, making them difficult to parse with systems trained on other data.
5.3. Track 1.B: Standard Shared Task
We ran Track 1.B as a more traditional NLP shared task, with time for training and testing. We provided participants with 600 annotated records. Participants developed their systems over two months. At the end of the development period we released 400 unannotated records. Participants had three days to run their systems on and submit up to three results.
5.3.1. Evaluation
We used the same evaluation metrics and script for Track 1.B as we did for Track 1.A. However, the gold standard for Track 1.B included the “generic” organization tags that we removed from the Track 1.A gold standard. For the evaluation of this track, we used strict matching and the entire set of PHI. We calculated all statistics at the micro level. We used F1 measures as the ranking metric for the teams.
5.3.2. Participants
Fifteen teams, with members representing 21 institutions and eight countries participated in Track 1.A. In total, we received 34 submissions. Five of these submissions were incompatible with the evaluation script. Table 8 shows the teams, methods, and represented institutions and countries. The “Medical experts?” column reflects which of the teams consulted with doctors, nurses, or other medical professionals while building their systems.
Table 8.
Teams participating in Track 1.B., listed alphabetically.
| # | Affiliations | # of members | # of runs | methods | Medical experts? | Countries |
|---|---|---|---|---|---|---|
| 1 | California State University San Marcos | 1 | 2 | rule-based | no | USA |
| 2 | Harbin Institute of Technology Shenzen Graduate School | 3 | 3 | hybrid | no | China |
| 3 | Harbin Institute of Technology | 3 | 3 | supervised | no | China |
| 4 | LIMSI-CNRS | 4 | 3 | supervised | no | France |
| 5 | Med Data Quest Inc. | 5 | 1 | supervised | no | USA |
| 6 | MITRE | 7 | 3 | supervised | no | USA |
| 7 | NED University of Engineering and Technology | 3 | 1 | rule-based | no | Pakistan |
| 8 | National Taitung University Taipei Medical University National Taiwan University Academia Sinica UNSW Australia |
9 | 3 | hybrid supervised | no | Taiwan Australia |
| 9 | National Central University | 3 | 3 | supervised | no | Taiwan |
| 10 | University of Alabama at Birmingham University of Utah |
3 | 3 | supervised | no | USA |
| 11 | University of Manchester University of Novi Sad Australian Institute of Health Innovation University of Oxford |
6 | 3 | hybrid | no | UK Serbia Australia |
| 12 | University of Michigan | 4 | 2 | hybrid supervised | no | USA |
| 13 | University of Texas Health Science Center at Houston | 8 | 2 | hybrid | no | USA |
| 14 | University of Utah (#8) | 1 | 1 | rule-based | yes | USA |
| 15 | University of Utah (#77) | 2 | 1 | supervised | yes | USA |
| 21 institutions | 62 researchers | 34 runs | 5 hybrid 3 rule-based 9 supervised 0 semi-supervised |
2 yes 13 no |
8 countries |
Overall, supervised methods were the most frequently used, with nine systems built that way. A further five teams built hybrid systems and three built rule-based systems. No team experimented with semi-supervised approaches for this task. Only two teams referred to medical experts while building their systems, though unfortunately their submissions did not specify what role those medical experts played.
5.3.3. Results and error analysis
We computed the aggregate results (strict matching, all PHI categories) of all the system outputs that were compatible with the evaluation software. The median score was 0.822 (standard deviation = 0.183, mean = 0.779, minimum = 0.019). The top-performing system achieved an F1 of 0.914. Compared to the 2014 task, these numbers are slightly lower (maximum 0.936, median 0.845) (Stubbs and Uzuner 2015).
Table 9 lists the precision, recall and F1 for the best run (as determined by F1) from each team who submitted data compatible with the evaluation script. With the exceptions of Harbin Institute of Technology and National Taitung University, all teams achieved higher precision than recall.
Table 9.
Track 1.B top 10 teams, best runs ranked by F1, strict matching, all PHI.
| Rank | Team | Systems and processing | Precision | Recall | F1 |
|---|---|---|---|---|---|
| 1 | Harbin Institute of Technology Shenzhen Graduate School |
Pre-processing: Tokenization System: 4 modules:
Post-processing: merged CRF and BI-LSTM outputs with SVN ensemble classifier, then incorporated rules (Liu et al., n.d.) |
0.9422 | 0.8881 | 0.91430 |
| 2 | University of Texas Health Science Center at Houston |
Pre-processing: tokenization, POS tagging, section parsing System:
Post-processing: merging output, error correction (H.-J. Lee et al., n.d.) |
0.9339 | 0.8823 | 0.90740 |
| 3 | The University of Manchester |
System: Combined outputs from two systems:
Post-processing: combined outputs of two systems; kept longer of overlapping spans(Dehghan, Kovacevic, et al., n.d.) |
0.8888 | 0.8653 | 0.87690 |
| 4 | University of Alabama at Birmingham |
Preprocessing: tokenization, sentence and section detection System: multi-pass “sieve” system:
(Duc An Bui, Wyatt, and Cimino 2017) |
0.9162 | 0.8338 | 0.87310 |
| 5 | Harbin Institute of Technology |
Pre-processing: tokenization, sentence detection System: BI-LSTMs developed tags for each token Post-processing: a CRF layer identified most likely tag for each token (Zhao et al., n.d.) |
0.8418 | 0.8728 | 0.85700 |
| 6 | National Taitung University |
Pre-processing: tokenization System: CRF (Jonnagaddala et al. 2016) |
0.7958 | 0.8501 | 0.82210 |
| 7 | MITRE | System: MIST (Carrell et al. 2013) with additional lexicons (Aberdeen et al. 2016) | 0.8552 | 0.762 | 0.80590 |
| 8 | LIMSI-CNRS |
Pre-processing: two text segmentations, token- and character-based System: 2 CRFs, one for each text segmentation Post-processing: merged outputs, prioritized character-based(Grouin 2016b) |
0.847 | 0.6963 | 0.76430 |
| 9 | National Central University |
Pre-processing: sentence detection, tokenization, POS tagging and chunking System: combination of rules and CRF Post-processing: dictionary matching, rules(Tsai et al. 2016) |
0.7892 | 0.779 | 0.75960 |
| 10 | University of Utah #77 |
Pre-processing: sentence detection, tokenization, POS tagging, chunking System: Pipeline of dictionary matching, rules, and CRF (AAlAbdulsalam and Meystre, n.d.) |
0.8645 | 0.6132 | 0.71750 |
Figure 4 shows the top ten team’s best run F1 scores for individual PHI categories. As with Track 1.A, PROFESSION, LOCATION, and ID proved to be the most difficult categories to correctly identify, while DATEs and AGEs were easier to spot.
Figure 4.
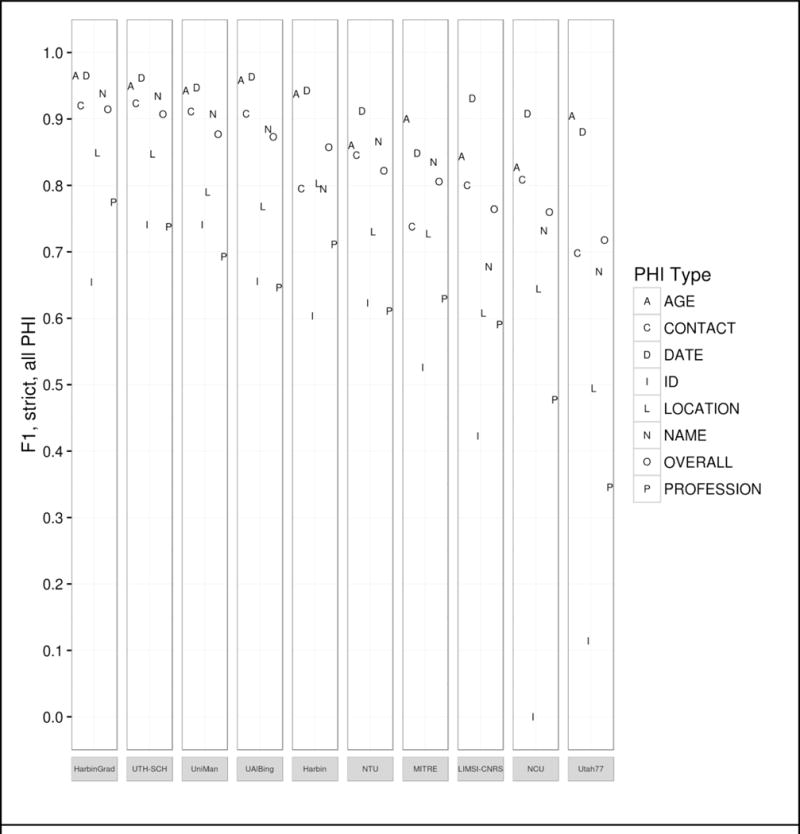
Track 1.B results by PHI category, top 10 teams.
In both tracks, CRFs were the most popular approach to the de-identification task, though more teams experimented with LSTM and RNN systems this year. The top four systems were hybrids; all four made use of combinations of different machine learning techniques, and three of the four also utilized rules. This suggests that there is no one-size-fits-all solution for identifying all PHI categories, and that using multiple methods to generate candidate PHI, then carefully curating those candidates is a better solution. The top system for both tasks included neural networks, which other research also suggests is a promising direction for this task (Dernoncourt et al. 2016).
One of the recurring questions for de-identification is “how good is good enough?”. In the shared task, we implement a stricter standard for defining PHI than HIPAA requires, and we compare results with strict matching over all the PHI categories we define. However, some might argue that we should adhere to a less rigid standard: look only at the HIPAA PHI, and allow token-based matching. Table 10 provides that information for the top ten teams. Using the HIPAA-only, token-based evaluation, most teams get a boost of around .03 or .04 in all their scores, and there is a small amount of shifting in rank. Evaluating by tokens helps teams who tagged first and last names separately, or those who tagged “Vassar Brothers” but not “Hospital” in “Vassar Brothers Hospital”. Overall the results are better, but not perfect.
Table 10.
Track 1.B top 10 teams, best runs ranked by F1, token matching, HIPAA PHI only.
| Rank | Team | Precision | Recall | F1 |
|---|---|---|---|---|
| 1 | Harbin Institute of Technology Shenzhen Graduate School | 0.9639 | 0.9241 | 0.9436 |
| 2 | University of Texas Health Science Center at Houston | 0.9630 | 0.9224 | 0.9423 |
| 3 | University of Alabama at Birmingham | 0.9560 | 0.9053 | 0.9300 |
| 4 | The University of Manchester | 0.9412 | 0.9138 | 0.9273 |
| 5 | Harbin Institute of Technology | 0.9125 | 0.9271 | 0.9197 |
| 6 | MITRE | 0.9059 | 0.8664 | 0.8857 |
| 7 | National Taitung University | 0.8401 | 0.9051 | 0.8714 |
| 8 | National Central University | 0.8483 | 0.8776 | 0.8627 |
| 9 | LIMSI-CNRS | 0.9132 | 0.7947 | 0.8499 |
| 10 | University of Utah #77 | 0.9249 | 0.7782 | 0.8452 |
As with Task 1.A, we analyzed the top run from each system. The charts in Figure B in the Appendix show the distribution of each PHI category compared to the number of systems that correctly identified the PHI. Again, to evaluate the effect of missing line breaks on the systems, we split each bar between PHI that were immediately followed by a capital letter, and those that were not.
In these results, the distribution of nearly all the tags skews heavily towards all or most teams getting nearly all the PHI. The line break/tokenization problem was corrected for by all teams, particularly in the numeric categories AGE, CONTACT, and DATE. Of those three categories, the items that remained un-tagged by all teams were those that involved misspellings (“Christams”, “sumer”), unusual phrases (“3 weeks old”, “tweener”, “2060s/70s”), and abbreviations for days of the week (“M-F” for “Monday through Friday”, “Su T R” for “Sunday, Tuesday, Thursday”). ID numbers appear to be a difficult category, but their low frequency (only 33 in the entire test corpus) contributes more to their lack of identification than any particular contextual or linguistic pattern.
For LOCATIONs, OTHER, ORGANIZATION, were still the most difficult to identify, with some additional difficulty with HOSPITAL. OTHER tags were rare, and those missed included unusual locations such as “Red River Valley” and “Westmont Park”: locations that are unlikely to be included in a list of cities or towns, but that a human would clearly recognize as a location.
Missed ORGANIZATIONs were often due to combinations of context and typographic issues. For example, one file mentions “Depew HS”, which all teams missed labeling that as an organization, and therefore did not annotate subsequent mentions of “Depew” as an organization. For HOSPITALs, the acronym “VA” was often mistaken for the state, rather than the Veteran’s Affairs health locations. Human readers with some knowledge of the United States medical system would be able to disambiguate “VA” easily, however, as the records referring to Veteran’s Affairs were clearly about military personnel.
For NAMEs, patient’s initials continued to be problematic for most teams, particularly when those initials were used with unusual context, for example, “KCs depression”. Very unusual names were also missed by all systems. In some cases, this may be an artifact of the surrogate generation system providing unusual names. In two cases there are staff members referred to only as “Yawn” and “Morrow”–though both are names in the US registry. Unusual phrasing continued to be an issue as well, as no system identified “Dr. Xique, Olivia” as a full name.
Finally, PROFESSIONs continued to be a difficult category to correctly identify. While performance in this category certainly improved compared to Task 1.A, without consistent context such as “works as”, “is a”, and so on, many systems struggled to identify job titles, job descriptions, and college majors or areas of study in the texts. While HIPAA does not consider PROFESSION to be a protected category, we believe that sufficiently detailed information about a person’s job and areas of expertise can be used to identify patients, and therefore it is important information to identify. PROFESSIONs can also have an impact on patient’s health, as different jobs can lead to exposure to different risks and environments, so identifying a person’s job has implications for medical research as well.
6. Discussion
In the overview papers for the last two i2b2 de-identification shared tasks, the authors posed the following questions: “1. Does success on this challenge problem extrapolate to similar performance on other, untested data sets? 2. Can health policy makers rely on this level of performance to permit automated or semi-automated de-identification of health data for research purposes without undue risk to patients?” (Uzuner, Luo, and Szolovits 2007; Stubbs, Kotfila, and Uzuner 2015). They added that “we are unaware of any industry standard for de-identification accuracy, but the 95% rule-of-thumb for systems continues to seem reasonable”.
In an effort to answer the first question, Track 1.A directly examined whether systems that were successful on previous challenges could be used on new, untested data with no additional training. Based on the results from Track 1.A, it would seem that the answer is “no”, assuming that we are looking for an out-of-the-box solution to all de-identification. The top-performing system for Track 1.A scored 0.8257, 0.733, 0.7985, for precision, recall, and F1 respectively, which is below the 95% guideline. However, it does present a solid base for future work with that data, as Track 1.B shows.
It is also important to consider the context in which these systems operated. As we discussed in Section 5.2.1, the majority of Track 1.A teams used supervised and hybrid systems, which would be heavily influenced by PHI distributions in their training data. Studies of machine learning for concept extraction (Torii, Wagholikar, and Liu 2011) and de-identification (Dernoncourt et al. 2016) show that the more data, particularly from multiple sources equates to better results.
The Track 1.B systems also do not reach that 95% rule of thumb, even when evaluating only HIPAA PHI at a token level. In 2014, four systems acheived F1 scores over .95. The conjoined tokens, the increased amount of PHI, and the sparsity of data in the 2016 dataset account for some of that. Looking at specific PHI categories, we see that some are close to perfect: DATEs, AGEs, and CONTACT have the best scores for almost all the teams. Other categories, such as PROFESSION and LOCATION are much harder, while NAME is somewhere in the middle. Overall, all systems do well identifying PHI in set contexts, with normal spelling and grammar. With the benefit of training the systems greatly improved over Track 1.A, but PHI in unusual contexts or that required nuance or world knowledge to interpret eluded most systems.
Unfortunately, from the perspective of providing privacy, the three categories that are harder to get are the ones that have the potential to disclose a patient’s identity, particularly considering that HIPAA does not consider the year to be PHI. This poses a chicken-and-egg scenario for researchers in the clinical NLP community: we need more data to create better models, but de-identification is difficult, time-consuming, and medical institutions are wary of sharing data even when it is de-identified. The 2016 Track 1.B systems show that we can progress with the use of different resources and carefully made ensemble systems, but Track 1.A suggests that we have not yet solved the de-identification challenge.
7. Conclusion
This paper provides an overview of Track 1.A and Track 1.B of the 2016 CEGS N-GRID shared task in natural language processing for clinical data. The data used for this task is an all-new corpus of 1,000 psychiatric intake records. Track 1.A was a “sight unseen” task, designed to test how well existing systems could perform on a new clinical dataset. The highest performing system obtained an F1 measure of 0.7985, significantly lower than previous high scores for other de-identification tasks. Track 1.B was a more traditional task, with participants getting gold standard training data and building systems to meet this new challenge. The highest-performing system in that track obtained an F1 of 0.9140: a significant improvement over Track 1.A, but still lower than the best system performances in previous de-identification tasks.
The 2016 CEGS N-GRID de-identification track differs from the past efforts both in its use of psychiatric intake records (first ever released to the community) and the linguistic challenges that these records present. Compared to the 2014 data set, the 2016 records contain more PHI overall but fewer PHI compared to the total number of words, significantly different PHI distributions from the 2014 data set, and consistent problems with conjoined tokens.
The best-performing systems for this task used a variety of approaches to identify PHI, and then used other methods to weed out inaccurate tags. Some PHI, such as DATEs and AGEs are comparatively easy for systems to find now, while PROFESSIONs and LOCATIONs continue to pose a challenge. Even after training, systems had difficulty identifying PHI that are misspelled, occur in grammatically incorrect contexts, or require deeper discourse analysis to correctly interpret, which suggests that dictionaries and larger datasets will not be enough to reach the goal of 95% recall.
Highlights.
NLP shared task with new set of 1,000 de-identified psychiatric records
“Sight-unseen” task: top F1 of .799 using out-of-the-box system on new data
“Standard task: top F1 of .914 on test data after 2 months of development
Hybrid systems most effective, but often missed PHI requiring world knowledge or context
Acknowledgments
The authors would like to thank the 2016 CEGS NGRID program committee, the annotators, and all the researchers who committed to the shared tasks. Funding for this project was provided by the grants NIH P50 MH106933 (PI: Isaac Kohane) and NIH 4R13LM011411 (PI: Ozlem Uzuner).
Appendix
Figure A.
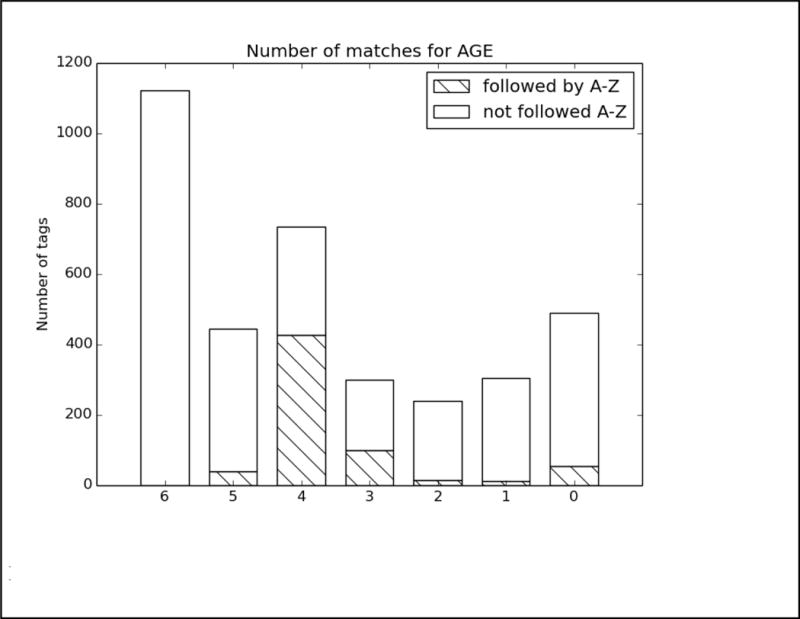
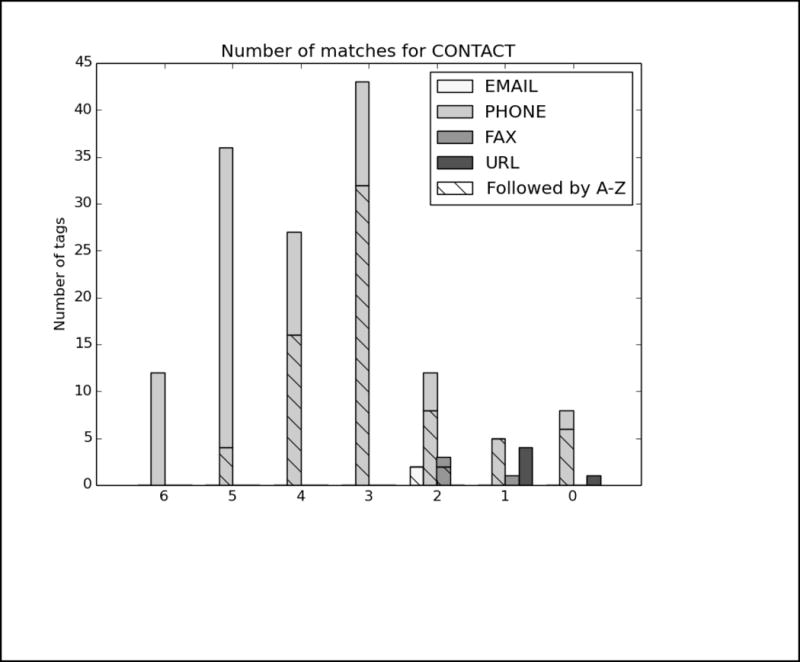
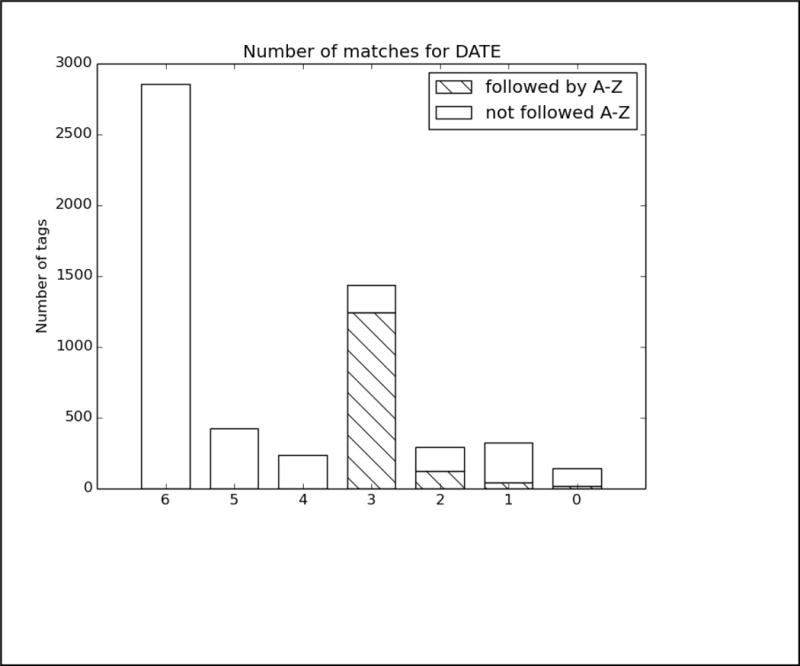
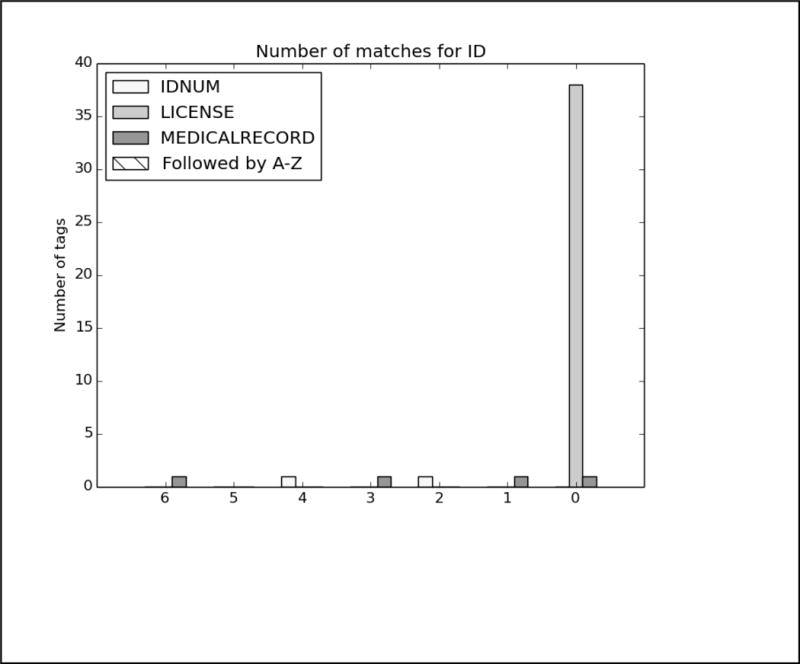
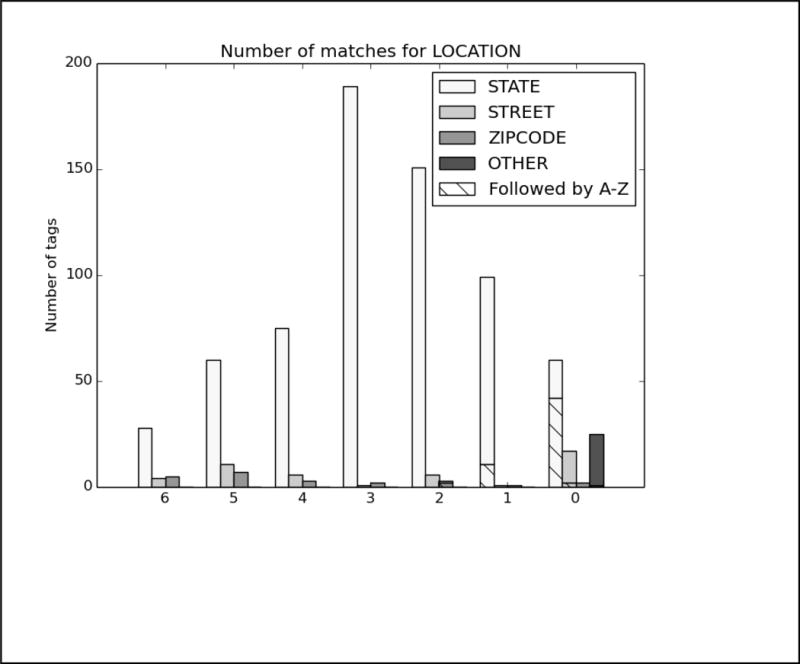
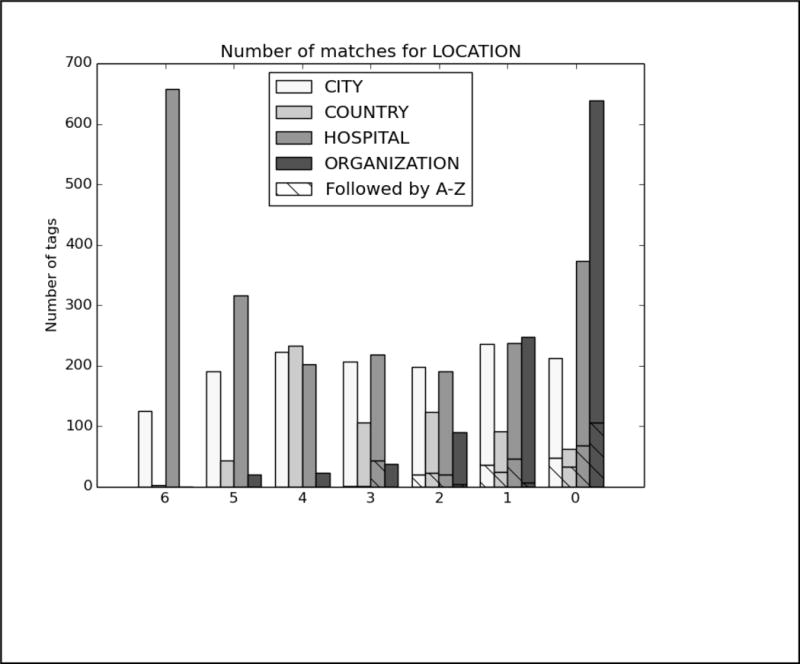
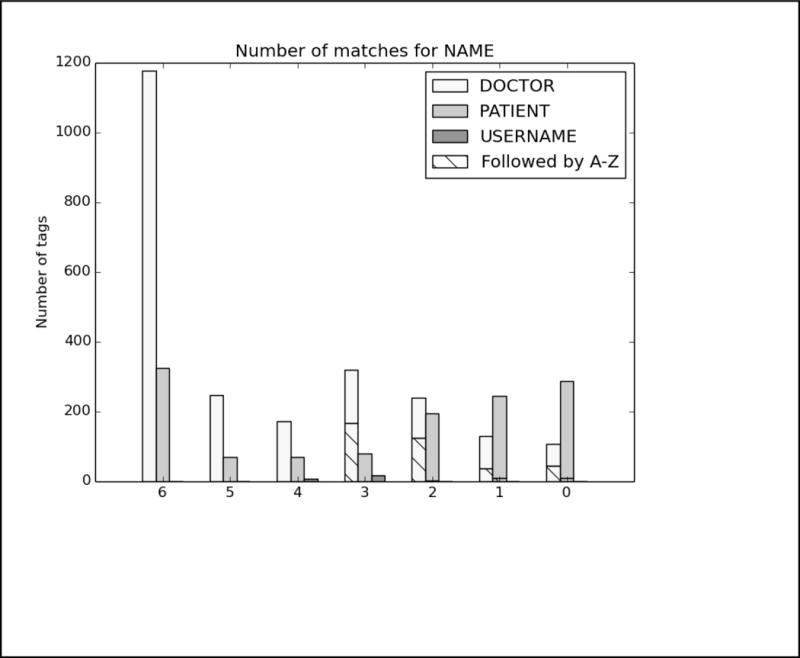
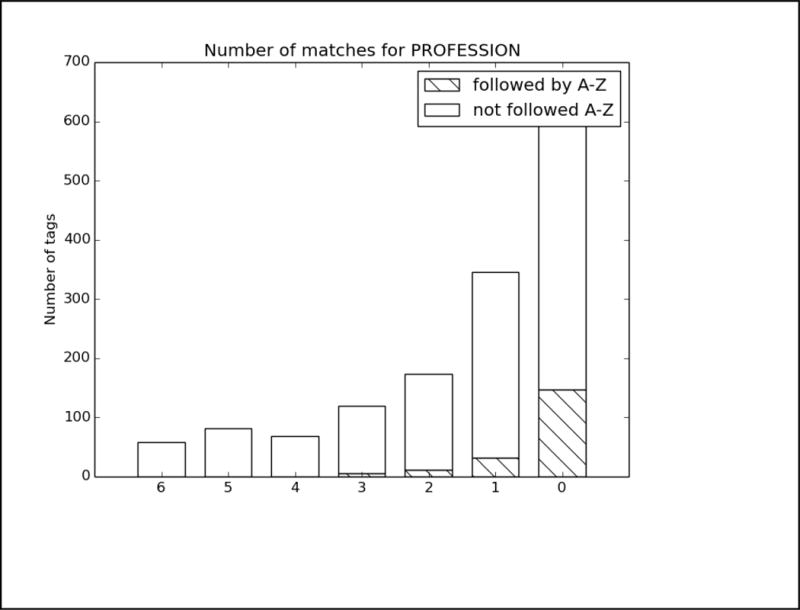
Analysis of top 6 system results compared to the gold standard for Track 1A, strict matching, all PHI. The x-axis shows the number of teams who correctly identified each PHI, and the y-axis shows the number of PHI identified. Each bar is split between PHI that were immediately followed by a capital letter, and those that were not.
Figure B.
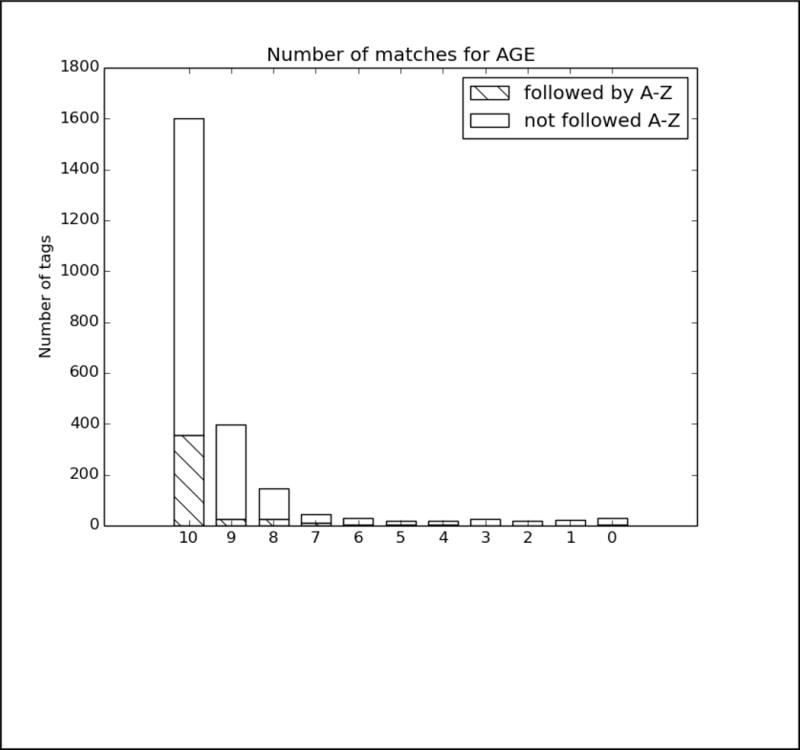
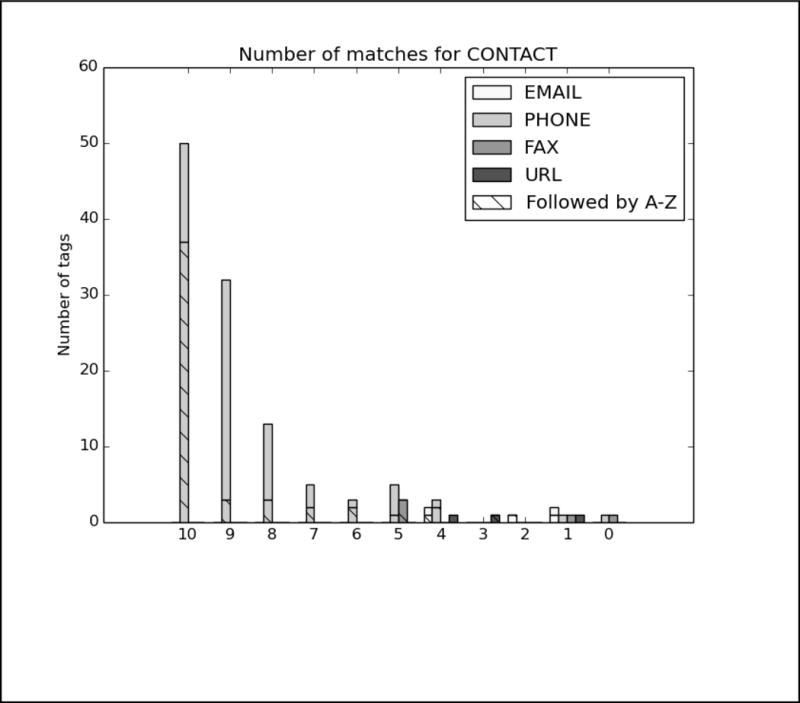
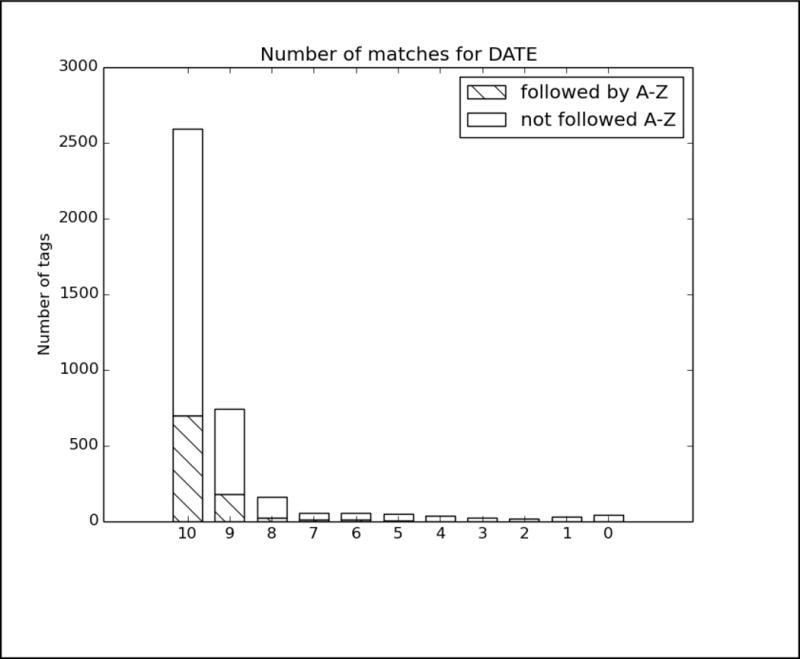
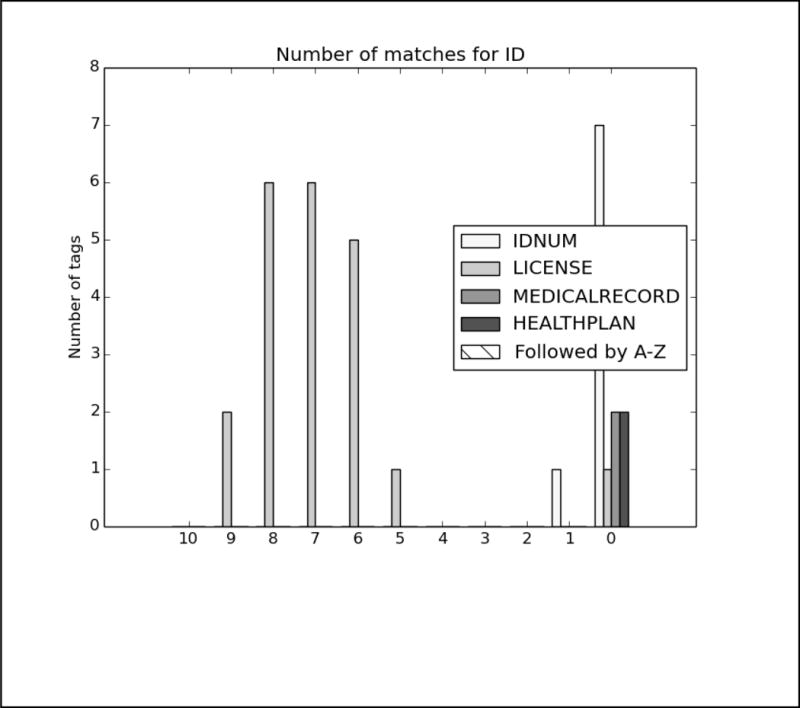
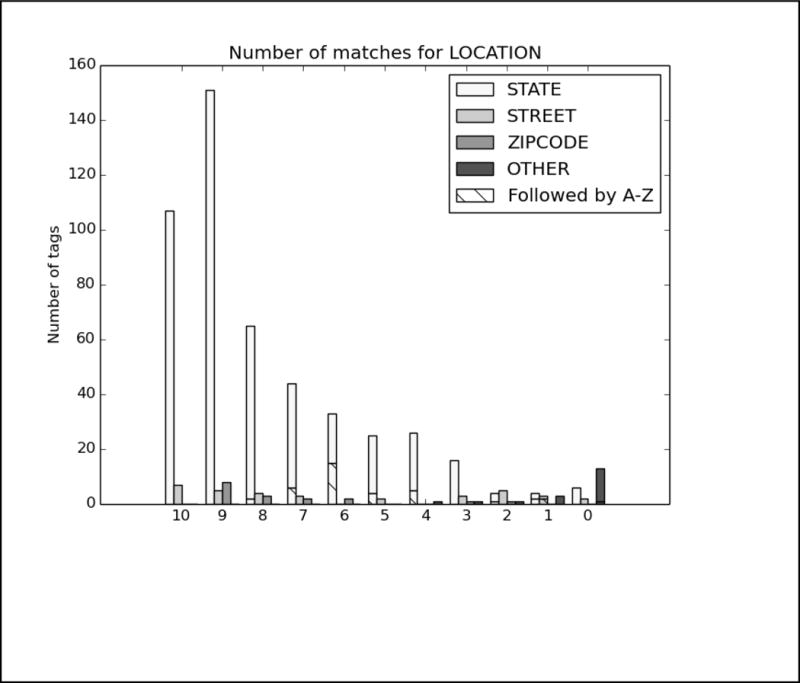
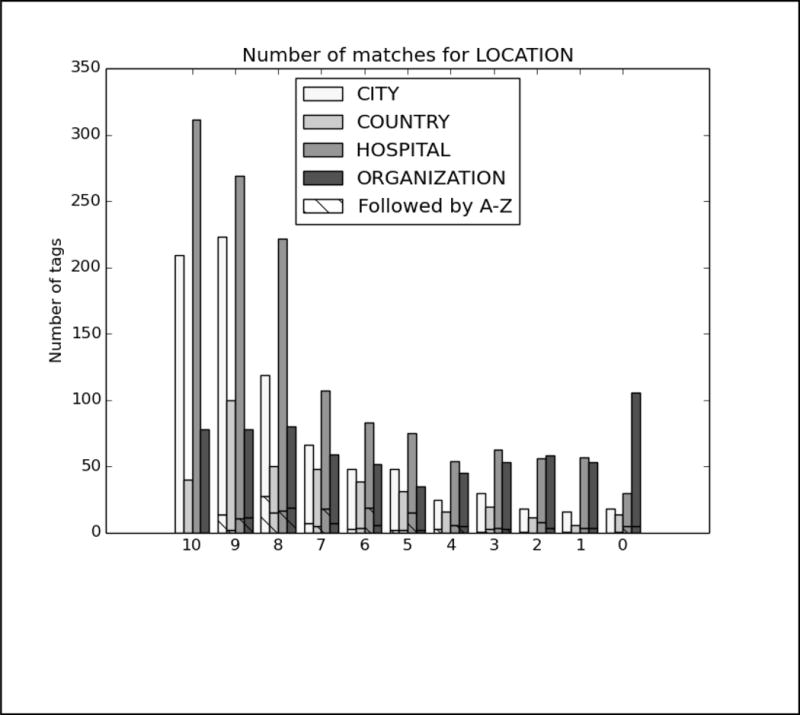
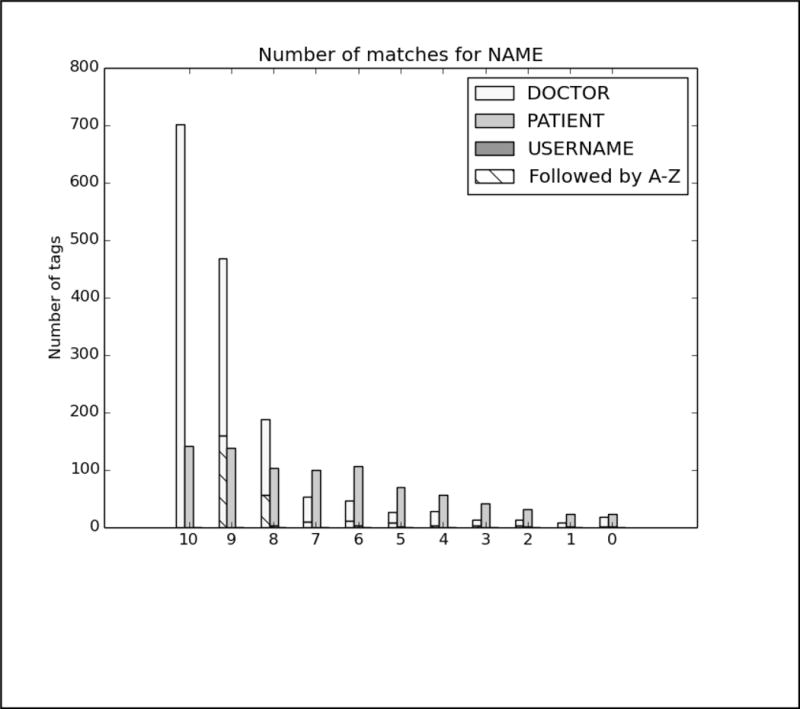
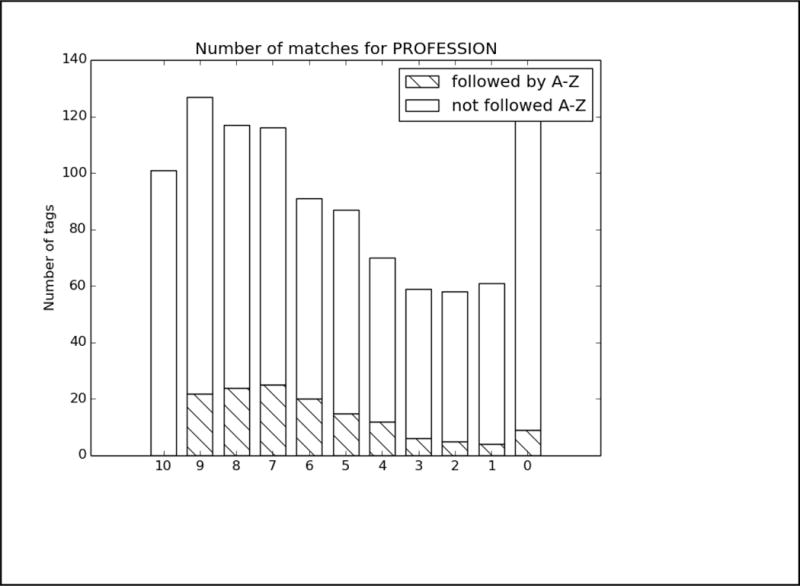
Analysis of top 6 system results compared to the gold standard for Track 1.B, strict matching, all PHI. The x-axis shows the number of teams who correctly identified each PHI, and the y-axis shows the number of PHI identified. Each bar is split between PHI that were immediately followed by a capital letter, and those that were not.
Footnotes
Publisher's Disclaimer: This is a PDF file of an unedited manuscript that has been accepted for publication. As a service to our customers we are providing this early version of the manuscript. The manuscript will undergo copyediting, typesetting, and review of the resulting proof before it is published in its final citable form. Please note that during the production process errors may be discovered which could affect the content, and all legal disclaimers that apply to the journal pertain.
Conflicts of Interest
The authors declare that there are no conflicts of interest.
Contributor Information
Amber Stubbs, Simmons College, School of Library and Information Science, 300 The Fenway, Boston, MA 02115, United States, Phone: +16175212807.
Michele Filannino, University at Albany.
Özlem Uzuner, University at Albany.
References
- AAlAbdulsalam Abdulrahman K, Meystre Stephane. Learning to De-Identify Clinical Text with Existing Hybrid Tools. Journal of Biomedical Informatics. n.d. this issue. [Google Scholar]
- Aberdeen John, Bayer Samuel, Clark Cheryl, Wellner Ben, Hirschman Lynette. De-Identification of Psychiatric Evaluation Notes with the MITRE Identification Scrubber Toolkit. Proceedings of the 2016 CEGS/N-GRID Shared Task in Clinical NLP 2016 [Google Scholar]
- Duc An Bui Duy, Wyatt Mathew, Cimino James J. The UAB Informatics Institute and the 2016 CEGS N-GRID Shared-Task: De-Identification. Journal of Biomedical Informatics This issue. doi: 10.1016/j.jbi.2017.05.001. n.d. [DOI] [PMC free article] [PubMed] [Google Scholar]
- Cairns Brian L, Nielsen Rodney D, Masanz James J, Martin James H, Palmer Martha S, Ward Wayne H, Savova Guergana K. The MiPACQ Clinical Question Answering System. AMIA Annual Symposium Proceedings/AMIA Symposium AMIA Symposium. 2011 Oct;2011:171–80. [PMC free article] [PubMed] [Google Scholar]
- Carrell David, Malin Bradley, Aberdeen John, Bayer Samuel, Clark Cheryl, Wellner Ben, Hirschman Lynette. Hiding in Plain Sight: Use of Realistic Surrogates to Reduce Exposure of Protected Health Information in Clinical Text. Journal of the American Medical Informatics Association: JAMIA. 2013;20(2):342–48. doi: 10.1136/amiajnl-2012-001034. [DOI] [PMC free article] [PubMed] [Google Scholar]
- Collobert Ronan, Weston Jason, Bottou Léon, Karlen Michael, Kavukcuoglu Koray, Kuksa Pavel. Natural Language Processing (Almost) from Scratch. Journal of Machine Learning Research: JMLR. 2011 Feb;12:2493–2537. [Google Scholar]
- Dehghan Azad, Kovacevic Aleksandar, Karystianis George, Keane John A, Nenadic Goran. Combining Knowledge- and Data-Driven Methods for de-Identification of Clinical Narratives. Journal of Biomedical Informatics. 2015;58:S53–59. doi: 10.1016/j.jbi.2015.06.029. [DOI] [PMC free article] [PubMed] [Google Scholar]
- Dehghan Azad, Kovacevic Aleksandar, Karystianis George, Keane John A, Nenadic Goran. Learning to Identify Protected Health Information by Integrating Knowledge- and Data-Driven Algorithms: A Case Study on Psychiatric Evaluation Notes. Journal of Biomedical Informatics. doi: 10.1016/j.jbi.2017.06.005. n.d. this issue. [DOI] [PMC free article] [PubMed] [Google Scholar]
- Dehghan Azad, Kovačević Aleksandar, Karystianis George, Nenadic Goran, Kim Chi-Hun, Nevado-Holgado Alejo. Integrating Existing Knowledge- and Data-Driven Algorithms to Identify Protected Health Information. Proceedings of the 2016 CEGS/N-GRID Shared Task in Clinical NLP 2016 [Google Scholar]
- Dehghan Azad, Kovačević Aleksandar, Karystianis George, Nenadic Goran, Kim Chi-Hun, Nevado-Holgado Alejo. Applying Existing off-the-Shelf Solutions to Identify Protected Health Information. Proceedings of the 2016 CEGS/N-GRID Shared Task in Clinical NLP 2016 [Google Scholar]
- Dehghan Azad, Liptrot Tom, Tibble Daniel, Barker-Hewitt Matthew, Nenadic Goran. Identification of Occupation Mentions in Clinical Narratives. Lecture Notes in Computer Science. 2016:359–65. [Google Scholar]
- Dernoncourt Franck, Lee Ji Young, Uzuner Ozlem, Szolovits Peter. De-Identification of Patient Notes with Recurrent Neural Networks. Journal of the American Medical Informatics Association: JAMIA. 2016 Dec; doi: 10.1093/jamia/ocw156. [DOI] [PMC free article] [PubMed] [Google Scholar]
- Finkel Jenny Rose, Grenager Trond, Manning Christopher. Incorporating Non-Local Information into Information Extraction Systems by Gibbs Sampling. Proceedings of the 43rd Annual Meeting on Association for Computational Linguistics - ACL ’05. 2005 doi: 10.3115/1219840.1219885. [DOI] [Google Scholar]
- Grouin Cyril. LIMSI at CEGS N-GRID 2016 NLP Shared-Tasks: Track 1.A De-Identification of Unseen Clinical Texts. Proceedings of the 2016 CEGS/N-GRID Shared Task in Clinical NLP 2016a [Google Scholar]
- Grouin Cyril. LIMSI at CEGS N-GRID 2016 NLP Shared-Tasks: Track 1.B De-Identification of Clinical Texts at Character and Token Levels. Proceedings of the 2016 CEGS/N-GRID Shared Task in Clinical NLP 2016b [Google Scholar]
- Jonnagaddala Jitendra, Dai Hong-Jie, Chen Kuan-Yu, Huang Yu-Chi, Tsai Wei-Yun. De-Identification of Unstructured Electronic Health Records Using Conditional Random Fields with Extended Context and Global Features. Proceedings of the 2016 CEGS/N-GRID Shared Task in Clinical NLP 2016 [Google Scholar]
- Kumar Vishesh, Stubbs Amber, Shaw Stanley, Uzuner Özlem. Creation of a New Longitudinal Corpus of Clinical Narratives. Journal of Biomedical Informatics. 2015;58:S6–10. doi: 10.1016/j.jbi.2015.09.018. https://doi.org/10.1016/j.jbi.2015.09.018. [DOI] [PMC free article] [PubMed] [Google Scholar]
- Lavergne Thomas, Cappé Olivier, Yvon François. Practical Very Large Scale CRFs; ACL ’10 Proceedings of the 48th Annual Meeting of the Association for Computational Linguistics; Uppsala, Sweden. Jul 11 – 16, 2010. pp. 504–13. [Google Scholar]
- Lee Hee-Jin, Wu Yonghui, Zhang Yaoyun, Xu Jun, Xu Hua, Roberts Kirk. A Hybrid Approach for Automatic de-Identification of Psychiatric Notes. Journal of Biomedical Informatics This issue. doi: 10.1016/j.jbi.2017.06.006. n.d. [DOI] [PMC free article] [PubMed] [Google Scholar]
- Lee Joon, Scott Daniel J, Villarroel Mauricio, Clifford Gari D, Saeed Mohammed, Mark Roger G. Open-Access MIMIC-II Database for Intensive Care Research. Conference Proceedings: … Annual International Conference of the IEEE Engineering in Medicine and Biology Society IEEE Engineering in Medicine and Biology Society Conference. 2011;2011:8315–18. doi: 10.1109/IEMBS.2011.6092050. [DOI] [PMC free article] [PubMed] [Google Scholar]
- Liu Zengjian, Chen Yangxin, Tang Buzhou, Wang Xiaolong, Chen Qingcai, Li Haodi, Wang Jingfeng, Deng Qiwen, Zhu Suisong. Automatic de-Identification of Electronic Medical Records Using Token-Level and Character-Level Conditional Random Fields. Journal of Biomedical Informatics. 2015;58:S47–52. doi: 10.1016/j.jbi.2015.06.009. [DOI] [PMC free article] [PubMed] [Google Scholar]
- Liu Zengjian, Tang Buzhou, Wang Xiaolong, Chen Qingcai. An Ensemble System Based on Conditional Random Field and Recurrent Neural Network for De-Identification in Clinical Texts. Proceedings of the 2016 CEGS/N-GRID Shared Task in Clinical NLP 2016 [Google Scholar]
- Liu Zengjian, Tang Buzhou, Wang Xiaolong, Chen Qingcai. Sight Unseen De-Identification of Mental Health Records with Existing RNN and CRF Based Systems. Proceedings of the 2016 CEGS/N-GRID Shared Task in Clinical NLP 2016 [Google Scholar]
- Liu Zengjian, Tang Buzhou, Wang Xiaolong, Chen Qingcai. De-Identification of Clinical Notes via Recurrent Neural Network and Conditional Random Field. Journal of Biomedical Informatics. doi: 10.1016/j.jbi.2017.05.023. n.d. this issue. [DOI] [PMC free article] [PubMed] [Google Scholar]
- Morita Mizuki, Kano Yoshinobu, Ohkuma Tomoko, Miyabe Mai, Aramaki Eiji. Overview of the NTCIR-10 MedNLP Task. Proceedings of NTCIR-10 2013 [Google Scholar]
- Savova Guergana K, Masanz James J, Ogren Philip V, Zheng Jiaping, Sohn Sunghwan, Kipper-Schuler Karin C, Chute Christopher G. Mayo Clinical Text Analysis and Knowledge Extraction System (cTAKES): Architecture, Component Evaluation and Applications. Journal of the American Medical Informatics Association: JAMIA. 2010;17(5):507–13. doi: 10.1136/jamia.2009.001560. [DOI] [PMC free article] [PubMed] [Google Scholar]
- Stubbs Amber, Kotfila Christopher, Uzuner Özlem. Automated Systems for the de-Identification of Longitudinal Clinical Narratives: Overview of 2014 i2b2/UTHealth Shared Task Track 1. Journal of Biomedical Informatics. 2015 Dec;58(Suppl):S11–19. doi: 10.1016/j.jbi.2015.06.007. https://doi.org/10.1016/j.jbi.2015.06.007. [DOI] [PMC free article] [PubMed] [Google Scholar]
- Stubbs Amber, Uzuner Özlem. Annotating Longitudinal Clinical Narratives for de-Identification: The 2014 i2b2/UTHealth Corpus. Journal of Biomedical Informatics. 2015 Dec;58(Suppl):S20–29. doi: 10.1016/j.jbi.2015.07.020. [DOI] [PMC free article] [PubMed] [Google Scholar]
- Torii Manabu, Wagholikar Kavishwar, Liu Hongfang. Journal of the American Medical Informatics Association: JAMIA. 5. Vol. 18. Oxford University Press; 2011. Using Machine Learning for Concept Extraction on Clinical Documents from Multiple Data Sources; pp. 580–87. [DOI] [PMC free article] [PubMed] [Google Scholar]
- Tsai Yi-Jung, Chen Eric, Lai Po-Ting, Tsai Richard Tzong-Han. NCU-IISR System for the I2B2 De-Identification Track. Proceedings of the 2016 CEGS/N-GRID Shared Task in Clinical NLP 2016 [Google Scholar]
- Uzuner O, Luo Y, Szolovits P. Evaluating the State-of-the-Art in Automatic De-Identification. Journal of the American Medical Informatics Association: JAMIA. 2007;14(5):550–63. doi: 10.1197/jamia.M2444. [DOI] [PMC free article] [PubMed] [Google Scholar]
- Wellner Ben, Huyck Matt, Mardis Scott, Aberdeen John, Morgan Alex, Peshkin Leonid, Yeh Alex, Hitzeman Janet, Hirschman Lynette. Rapidly Retargetable Approaches to de-Identification in Medical Records. Journal of the American Medical Informatics Association: JAMIA. 2007;14(5):564–73. doi: 10.1197/jamia.M2435. [DOI] [PMC free article] [PubMed] [Google Scholar]
- Zhao Chao, He Bin, Guan Yi. The Description of WI-deId System on Track 1.b. Proceedings of the 2016 CEGS/N-GRID Shared Task in Clinical NLP 2016 [Google Scholar]
- Zhao Chao, He Bin, Guan Yi. The Description of WI-deId System on Track 1.a. Proceedings of the 2016 CEGS/N-GRID Shared Task in Clinical NLP 2016 [Google Scholar]
- Zhao Chao, He Bin, Guan Yi, Jiang Jingchi. De-Identification of Medical Records Using Conditional Random Fields and Long Short-Term Memory Networks. Journal of Biomedical Informatiocs. doi: 10.1016/j.jbi.2017.10.003. n.d. this issue. [DOI] [PMC free article] [PubMed] [Google Scholar]


