Abstract
Background
High frequency oscillations (HFOs) are emerging as potentially clinically important biomarkers for localizing seizure generating regions in epileptic brain. These events, however, are too frequent, and occur on too small a time scale to be identified quickly or reliably by human reviewers. Many of the deficiencies of the HFO detection algorithms published to date are addressed by the CS algorithm presented here.
New Method
The algorithm employs novel methods for: 1) normalization; 2) storage of parameters to model human expertise; 3) differentiating highly localized oscillations from filtering phenomena; and 4) defining temporal extents of detected events.
Results
Receiver-operator characteristic curves demonstrate very low false positive rates with concomitantly high true positive rates over a large range of detector thresholds. The temporal resolution is shown to be +/−~5 ms for event boundaries. Computational efficiency is sufficient for use in a clinical setting.
Comparison with existing methods
The algorithm performance is directly compared to two established algorithms by Staba (2002) and Gardner (2007). Comparison with all published algorithms is beyond the scope of this work, but the features of all are discussed. All code and example data sets are freely available.
Conclusions
The algorithm is shown to have high sensitivity and specificity for HFOs, be robust to common forms of artifact in EEG, and have performance adequate for use in a clinical setting.
Keywords: High frequency oscillations, HFO, Ripples, Frequency dominance, Detection algorithm
1. Introduction
Epilepsy affects over 50 million people worldwide. Data from the World Health Organization shows the global burden of epilepsy is similar to lung cancer in men and breast cancer in women (Murray and Lopez, AD, 1994). For approximately 30–40% of the nearly three million Americans with epilepsy, their seizures are not controlled by any available therapy. Partial epilepsy represents the most common type of drug resistant epilepsy, and accounts for approximately 80% of the financial burden of epilepsy as a disease (Murray and Lopez, AD, 1994). Currently, treatment options for patients with medically refractory partial epilepsy are limited. Resective epilepsy surgery has the best chance of producing a cure, i.e. complete seizure freedom, but is only possible if the brain region generating seizures can be spatially localized and safely removed (Engel, 1987; Luders and Comair, 2001). Identifying this region often involves intracranial implantation of recording electrodes, and up to two weeks of hospitalization to record a patient’s habitual seizures. It is an arduous process for the patient and associated with increasing risk of infection as time progresses. A method to identify epileptic tissue that does not require the occurrence of spontaneous seizures would substantially reduce this burden, and the morbidity associated with the process.
High frequency oscillations (HFOs) are emerging as a promising biomarker of epileptogenic tissue. HFOs are spontaneous EEG transients with frequencies traditionally considered to range from 60 to 600 Hz, with 4–50 oscillation cycles that stand out from the background as discrete electrographic events. HFOs are usually divided into subgroups of high γ (60–80 Hz), ripple (80–250) and fast ripple (250–600) bands (Bragin et al., 1999).
Since their initial discovery in freely behaving rats (Buzsáki et al., 1992), the presence of normal and pathological HFOs was confirmed in mesiotemporal and neocortical brain structures of epileptic patients who underwent electrode implantation for treatment of medically intractable focal epilepsy (Bragin et al., 1999; Staba et al., 2002). Subsequent research further revealed association of increased high γ, ripple, and fast ripple HFO activity in seizure generating tissue (Bragin et al., 1999; Worrell et al., 2004; Staba et al., 2004; Worrell et al., 2008) and with cognitive processing (Gross and Gotman, 1999; Axmacher et al., 2008; Jadhav et al., 2012; Kucewicz et al., 2014). In the majority of these studies HFOs were detected by expert reviewers in short data segments (~10 mins), which while limited, demonstrate the correlation of HFO occurrence with both pathological foci and cognitive processing.
Although visual review of iEEG signal is still considered the gold standard, it is a time consuming process, prone to reviewer bias and drift in judgment, and has poor inter-reviewer concordance (Abend et al., 2012). Moreover, the length of iEEG recordings collected by epilepsy centers can span days and the acquired data include up to hundreds of channels, making visual review for HFOs impossible. Semi, or preferably fully, automated algorithms for HFO detection are a necessary tool to overcome this methodological weakness and make HFO detection a clinically useful tool.
The first automated HFO detectors were based solely on bandpass filtered signal energy and failed to address some important issues, resulting in low specificity. The root mean square (RMS) detector (Staba et al., 2002) and line-length detector (Gardner et al., 2007) both utilize transformation of band pass filtered signal (80–500 Hz). The candidate events are detected as the segments of signal with energy higher than a statistical threshold, computed as either a multiple of the standard deviation (Staba et al., 2002) or percentile of the empiric cumulative distribution function (Worrell et al., 2008). The low specificity of these algorithms could be ascribed to the methodology of threshold computation, which guarantees a minimum level of detection (Zelmann et al., 2012), or to the rise in false positive detections induced by filtering of sharp transients, interictal epileptiform spikes (IEDs) and sharp waves, commonly known as Gibbs’ phenomenon (Gibbs, 1899; Urrestarazu et al., 2007; Benar et al., 2010). Additionally, these and other algorithms have minimal adaptation to the known non-stationarity of EEG, using fixed thresholds for long non-overlapping stretches of data (Staba et al., 2002 [entire data set]; Gardner et al., 2007 [3 min windows]; Blanco et al., 2010, 2012 [10 min windows]).
Detection algorithms developed since 2010 use various approaches to overcome low specificity but they are still inadequate for use in a clinical setting. Zelmann et al. (2010) improved the specificity of the RMS detector by computing the energy threshold from baseline segments and Chaibi et al. (Chaibi et al., 2013) utilized a combination of RMS and empiric mode decomposition. The detection method of Dümpelmann et al. (2012) enhanced specificity by inputting signal power, line-length and instantaneous frequency features from expert reviewed events to a neural network. While these approaches successfully decrease the number of false positive detections they do not eliminate false HFO detections associated with sharp transients. One possible way to discard detections caused by the increase in filtered signal power produced by Gibbs’ phenomenon is to compute an energy ratio between HFO frequency bands and lower bands (Blanco et al., 2010; Birot et al., 2013) or to analyze the shape of power spectrum (Burnos et al., 2014).
The algorithms developed to date usually focus only on one method to increase specificity and often disregard the non-stationarity of EEG signal by using absolute, non-adaptive feature values (Blanco et al., 2010; Dümpelmann et al., 2012) or rigid thresholds (Birot et al., 2013; Chaibi et al., 2013; Burnos et al., 2014). Moreover, when presenting algorithmic efficacy, literature often disregards efficiency. Computational speed is less important in retrospective analysis, however it is required for effective use in a clinical setting. Also typically disregarded is the temporal precision with which the HFOs are detected in the signal, which may prove useful for exploring the phase relationships between HFO and ongoing background EEG. The precise estimation of HFO beginnings and ends may also play a crucial role in distinguishing between different HFO categories such as pathological and physiological HFOs, and when evaluating HFO temporal position with respect to other HFOs or EEG phenomena.
In this work, we propose an algorithm, referred to here as the CS algorithm (Cimbálník-Stead), that employs multiple approaches to improve specificity and sensitivity of HFO detections. The false positive detections induced by sharp transients are discarded on the basis of a novel metric, referred to as frequency dominance, which does not require computation of frequency spectra. Non-stationarity is accounted for by renormalizing the metrics at a specified frequency (10 s blocks with 1 second overlap is default in this version of the detector, but is an adjustable parameter). This results in a cascade of adaptive thresholds based on metric normalization and previous gold standard detections evaluated by expert reviewers. Furthermore, the method has good temporal precision of HFO detection and is efficient enough for real-time processing applications.
2. Materials and methods
To optimize the algorithm we used a large data set collected from human patients and research animals. This variety in recorded data allowed us to evaluate flexibility in the algorithm. Intracranial EEG (iEEG) recordings were reviewed from 15 different patients who underwent electrode implantation for treating intractable focal epilepsy. The data set also included two rodent and two canine intracranial EEG recordings for a total of 19 subjects. Two hours of clinical data from each subject was visually checked for noise, and care was taken to select data that were at least 2 h apart from seizures. From each of these baseline two hour recordings, 20 min of recording time was randomly selected and used to tune the parameters for the CS algorithm. For algorithm testing, a second similar dataset was created using randomly selected data segments from the human subject files that were not included in the original dataset.
The recordings were taken from either clinical macroelectrodes (~12 mm2 surface area) or microelectrodes (40 μm diameter). The macroelectrodes were sampled at 5000 Hz except for the two dog recordings, which were sampled at 400 Hz. Microelectrode recordings were sampled at 32 kHz. Many of the prior detection methods do not have sufficient flexibility to evaluate across different recording techniques without additional algorithm tweaking or tuning. The range of electrode sizes, sampling rates, and species was important to ensure consistent algorithm performance across a range of recording conditions.
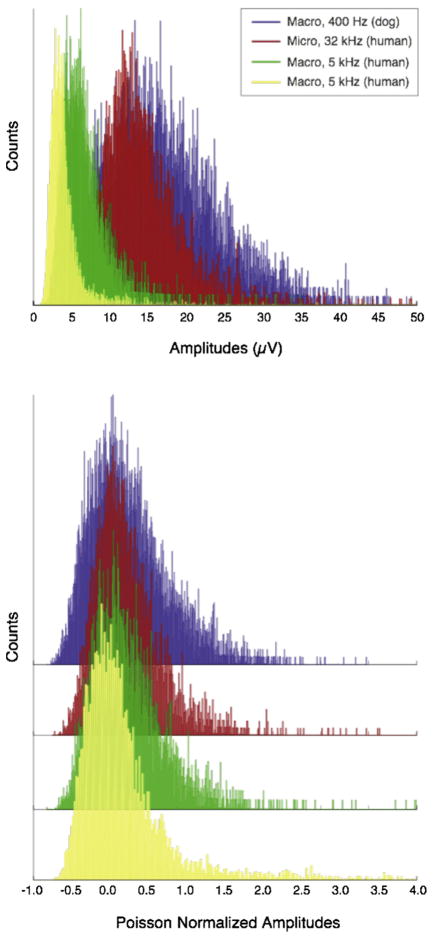
Poisson normalization was employed as part of the algorithm to address the variance stemming from these technical recording differences, as shown in Fig. 1 (top). Comparing the two human macroelectrode recordings (yellow and green data) illustrates how impedance variance in otherwise similar recording conditions can affect recording amplitude. Even greater amplitude differences arise from micro versus macro recordings. However, since amplitude distributions from individual recording sessions approximate a Poisson distribution, the data can be easily normalized by subtracting the mean and then dividing by it. Notably, for a Poisson distribution, the standard deviation is also the mean. This has the advantage of being computationally efficient, as the algorithm needs only to update a mean computation for data normalization. Although via this method normalized metrics for some data points become negative, the highest valued signals (right-sided tails of the distribution), where HFOs are found, are preserved (Fig. 1 bottom).
Fig. 1.
Poisson normalization of amplitude traces.
The CS algorithm consists of several steps including: 1) raw data filtration, 2) calculation of feature traces, 3) Poisson normalization, and 4) detection using a cascade of thresholds derived from gold standard detections. The algorithm isolates HFO features of locally increased amplitude and frequency relative to the rest of the signal and, unlike most prior algorithms, combines both amplitude and frequency detections to more accurately identify HFOs.
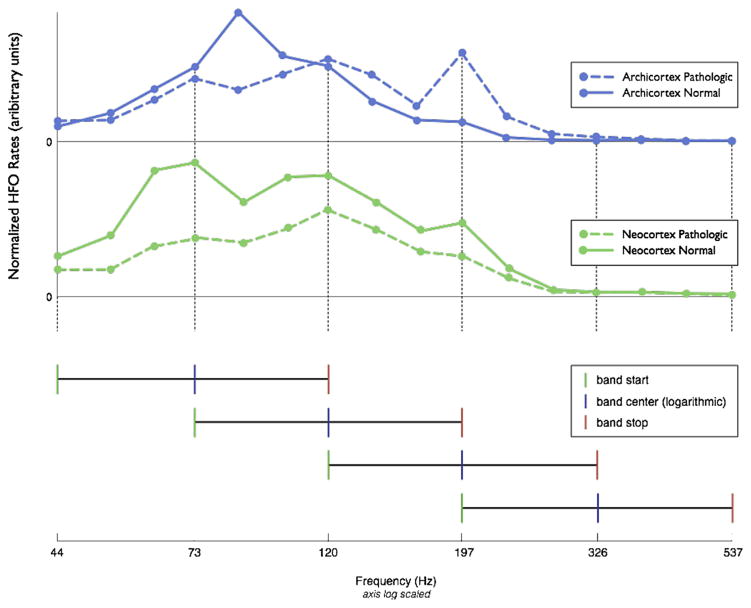
The initial step of the algorithm is to filter the raw iEEG data into a series of overlapping, exponentially spaced frequency bands (Butterworth bandpass filter, 3 poles). The remaining algorithm steps are then applied to each of the filtered datasets. To determine the filtration bands of interest, we initially analyzed 52 clinical patient microelectrode recordings using 17 exponentially spaced overlapping bands spanning the frequency range from 40 to 900 Hz. Fig. 2 shows resulting normalized occurrence rates from both pathologic and normal cortical data from archicortex (top panel) and neo-cortex (middle panel). Rates at 900 Hz were zero and therefore not plotted. The analysis revealed distinct peaks similar for both archicortex and neocortex, which allowed for band reduction to 4 overlapping frequency bands (Fig. 2 bottom panel), thus simplifying the algorithm and reducing processing time. Each frequency band is analyzed separately in the detection process.
Fig. 2.
Overlapping bands selected for HFO detection.
The algorithm does not distinctly categorize HFO events as gamma, ripples, or fast ripples, but it would be possible to sort post-processed HFO events by these categories if clinically useful. As shown in Fig. 2, the dataset contained all categories of HFO frequencies. The first frequency band (44–120 Hz) roughly emulates gamma, second band ripple (73–197 Hz), and last two bands fast ripple (120–326 and 197–537). However, these frequency bands were determined based on peaks in the original dataset and not intended to classify HFO events.
Three feature traces are next computed in the second step of the detection process:
An Amplitude trace, which represents the instantaneous amplitude characteristics of the bandpass filtered signal.
A Frequency Dominance trace, which isolates locally dominant high frequencies from the low frequency oscillations of the raw signal.
The Product trace, which is the dot product of the Amplitude & Frequency Dominance traces, and therefore identifies time points where both high amplitudes and high frequencies were detected.
Amplitude traces (Fig. 3) are created from each of the four bandpass filtered signals (example blue trace). First, the envelope (red trace) is calculated by finding the signal peaks and troughs (i.e. critical points). Linear interpolation between absolute values of the critical points is performed to match the number of samples in the original signal. Next, sharp peaks are removed from the envelope using a sliding window filter, where each value is replaced by the maximum value within the window. Window length is specific for each of the four bandpass filtered datasets, and is equal to the minimum number of cycles in an HFO (defined as 4 in this code) at its center frequency (see Figure 2 bottom panel), which is the geometric mean of the high and low cut-off frequencies. Finally, the raw amplitude trace (black trace) is Poisson normalized to obtain the final amplitude trace.
Fig. 3.
Construction of the Amplitude trace. Green lines demarcate putative HFOs.
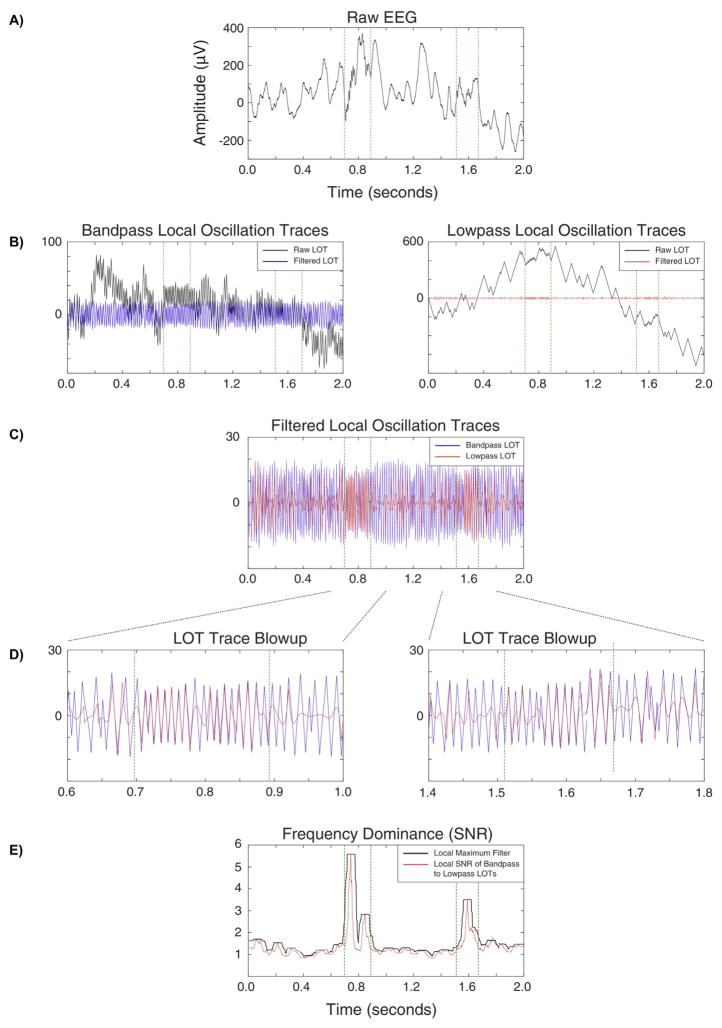
The relationship between the bandpass filtered data and low-pass filtered data is used to calculate the frequency dominance trace. This metric measures the extent to which the local signal of the bandpassed data is present in the raw data, and is exquisitely insensitive to Gibbs’ phenomenon. The frequency dominance trace is computed by differentiating the filtered bandpass and lowpass signals (for all four frequency bands). The lowpass filters employ the same high cutoff as the bandpass filters. In both ths bandpassed and lowpassed trace, values > 1 are set to 1, values <−1 are set to −1, and a raw local oscillation trace (LOT) is created by calculating the cumulative sum for the trace (Fig. 4B, black traces). This trace is then high-pass filtered with the cut-off frequency equal to the low cut-off frequency of the bandpass filter (Fig. 4B, blue & red traces), eliminating the low frequency drift in the signal. Fig. 4C shows an overlay of the example lowpass filtered LOT (red) on its corresponding bandpass filtered LOT (blue) for comparison. These example traces are enlarged in Fig. 4D to demonstrate how the two signals correlate for two example HFO events. The final frequency dominance trace is the root mean square (RMS) signal to noise ratio generated from the bandpass and lowpass LOTs. A sliding window with the length of minimum number of event cycles at the band’s center frequency is applied to the band-passed signal and RMS is calculated, thus generating “signal”. Similarly, the RMS is calculated on a second trace constructed by subtracting the low passed LOT from the band passed LOT, generating the “noise”. The raw frequency dominance trace is calculated as the instantaneous (pointwise) “signal-to-noise” ratio (Fig. 4E, red trace). As with the amplitude trace, the final signal is processed by a sliding window where each value is replaced by the window’s local maximum (Fig. 4E, black trace) and Poisson normalized.
Fig. 4.
Construction of the Frequency Dominance traces. The Frequency Dominance trace as shown (black trace, panel E) is not yet normalized to facilitate comparison with the unfiltered trace (red trace, panel E). Green lines demarcate putative HFOs.
The product trace combines the Amplitude and Frequency Dominance traces. First, values < 0 (which occur due to the Poisson normalization) are set equal to 0. The dot product of both traces is computed. Poisson normalization is again applied to the final product trace (Fig. 5 red trace).
Fig. 5.
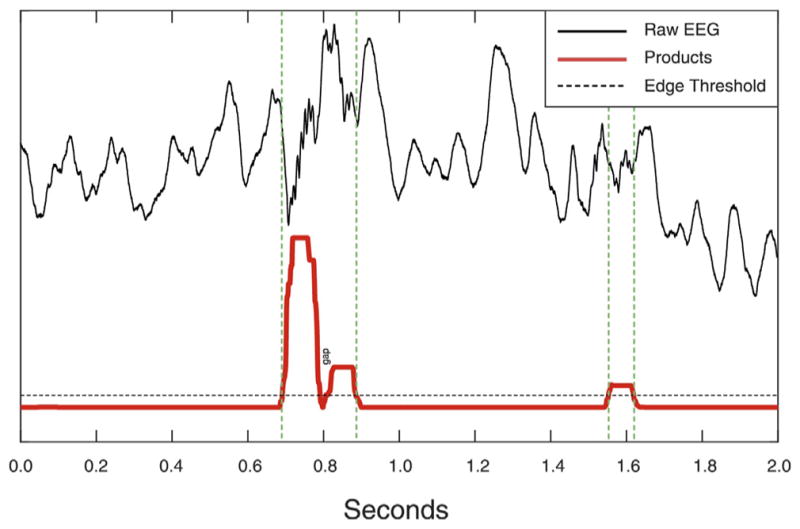
Product trace and Edge threshold. Green lines demarcate putative HFOs.
Putative HFOs are detected from the product trace as events exceeding an “edge” threshold (Fig. 5, dashed black trace, set to a value of 1 in the current code). As illustrated in Fig. 5, if the gap between two detections is shorter than the minimum number of cycles for detection, the two detections are fused into one. Subsequently, five measures are calculated for each detection and evaluated in a cascade of boundary thresholds.
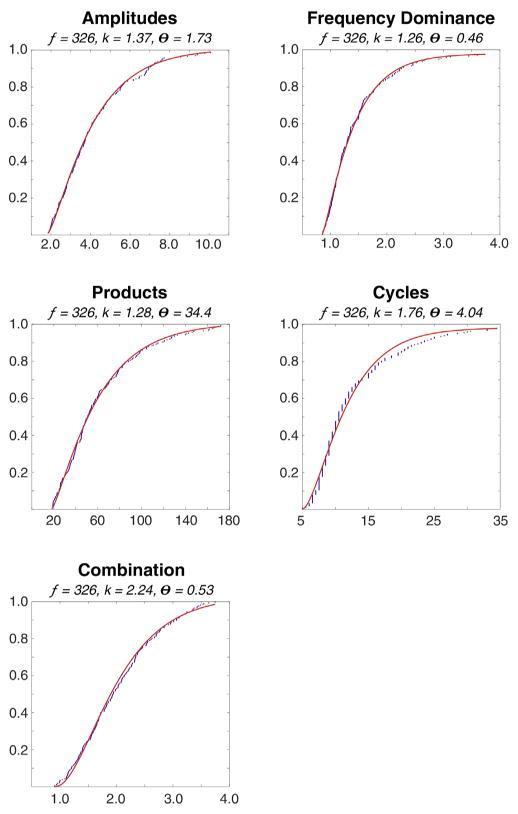
Boundary thresholds are based on the events detected by applying only the edge threshold; by expert visual review this achieves 100% sensitivity. The events were scored in each frequency band separately by three expert reviewers (JC, GW, & MS). The cumulative distributions of each measure were fitted with a gamma function (Fig. 6) and the parameters of these cumulative distribution functions (CDF) were stored in the detector code. The absolute boundary thresholds for each measure are calculated from these CDF based on two user defined relative thresholds, explained below.
Fig. 6.
Gamma functions (red) fitted to the five metrics used for detection. The fitted data (blue) derive from expert reviewed HFOs. All functions have correlations >0.99 to the fitted data.
Three measures are represented by the feature traces: Amplitude, Frequency Dominance and Product. The fourth measure is the number of cycles in the detection in each frequency band, which is extracted from the critical point arrays used to generate the Amplitude trace. The fifth measure is composed of the sum of CDF values for the four other measures. The detector applies two user defined relative thresholds, referred to here as the “AND” and the “OR” thresholds; both can vary between 0 and 1. The AND threshold is used to extract feature values from the Amplitude, Frequency Dominance, Product, and Cycle gamma curves (Fig. 6). If the corresponding values of the candidate detection is less than any of the threshold values, the detection is rejected. This threshold ensures a minimum amplitude, frequency, dominance, product, and number of cycles for every candidate detection. Detections not rejected by the AND threshold are then subjected to the OR threshold. This threshold captures the fact that expert reviewers tend to accept detections that stand out with respect to at least one feature, although which feature can vary. The OR threshold is calculated from a “Combination” score and corresponding gamma curve (Fig. 6). The Combination score is the sum of the CDF values of the candidate detection extracted from the corresponding gamma curves. The OR threshold value is extracted from the corresponding Combination score gamma curve. If the candidate event combination score is less than the combination threshold, the event is rejected. Although the performance is similar varying either the AND or the OR thresholds, we have generally set the AND threshold to 0.0 (default value), and varied the OR threshold (default 0.2).
Each accepted detection in each band is added to a conglomerate detection trace. Due to the overlapping nature of the bands, it is not uncommon for the same event to be detected in more than one band. Conglomerate detections are constructed from all detections that overlap in time and demarcated from the earliest onset to the latest offset. Conglomerate detections are subject to no subsequent thresholding. HFOs that evolve significantly in frequency are best temporally demarcated in the conglomerate detections (Fig. 7).
Fig. 7.
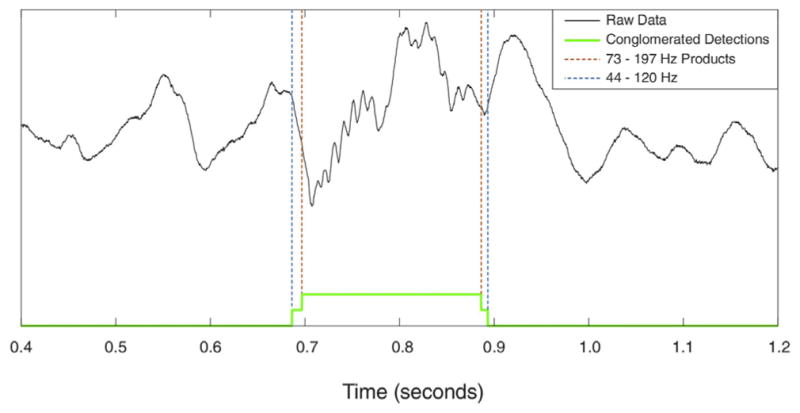
Construction of the Conglomerate detections trace. Detection occurred in two bands in this case.
2.1. Evaluation methods
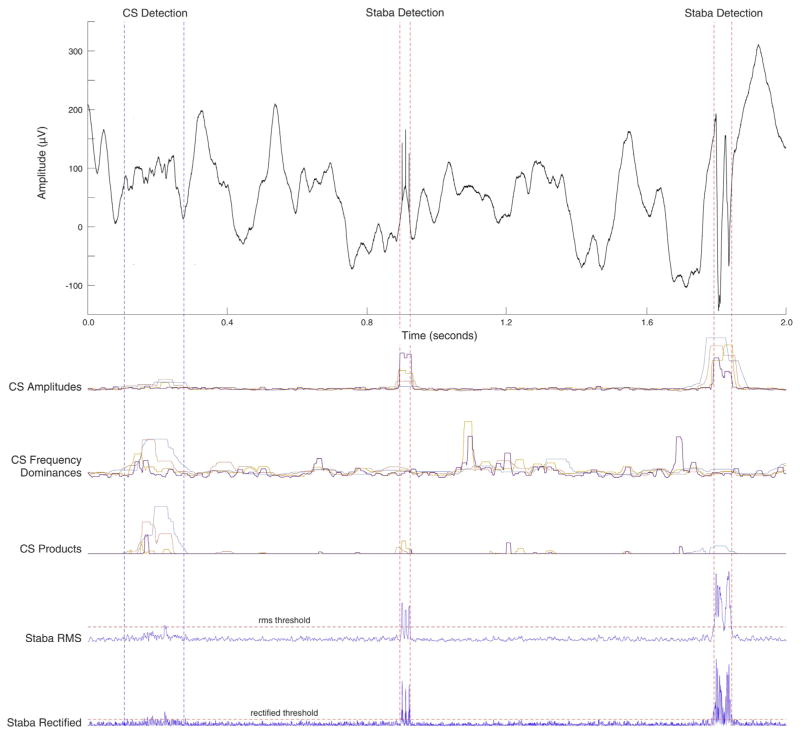
Comparison of the CS and Staba detectors indicates the CS detector is more sensitive, while still robust to artifact errors. As shown in Fig. 8 (left), the CS detector correctly identifies a low amplitude mixed frequency HFO (conglomerate detection shown) that is missed by the Staba detector. The top three traces of Fig. 8 illustrate how the CS algorithm components (amplitude, frequency domain, and product; different colors for each of the 4 frequency bands) respond to the signal, while the bottom two traces illustrate the Staba detector response. It can also be difficult for an algorithm to accurately rule out non-HFO events such as external noise (Fig. 8 middle) or large sharp epileptic spikes (Fig. 8 right). Although the CS algorithm amplitude trace responds to these artifacts, the frequency dominance trace does not, and therefore the product trace does not exceed the detection threshold. However, the Staba detector is influenced by the amplitude of the oscillatory artifacts, and the events are incorrectly identified as HFOs.
Fig. 8.
Comparison of putative CS detections to Staba detector in the cases of a low quality HFO (left), electrode popping artifact (center), and an epeptic spike (right). The principal metrics for each metric are shown below the EEG trace.
To quantify algorithmic performance, a gold standard dataset was acquired by running the detector with both the AND and OR thresholds set to 0, achieving 100% sensitivity. The detections were visually reviewed by three independent experts (JC, AH, & MS). To reduce reviewer error, each candidate event was presented to each reviewer 3 times in random order. To be included, the reviewer was required to have accepted the event in 2 out of the 3 presentations. Each of the 3 reviewer’s final scoring was then compared to produce the final gold standard data set. In this case unanimity of acceptance was required, rather than 2 of 3. This was to ensure that all gold standard events would likely be accepted by any expert reviewer.
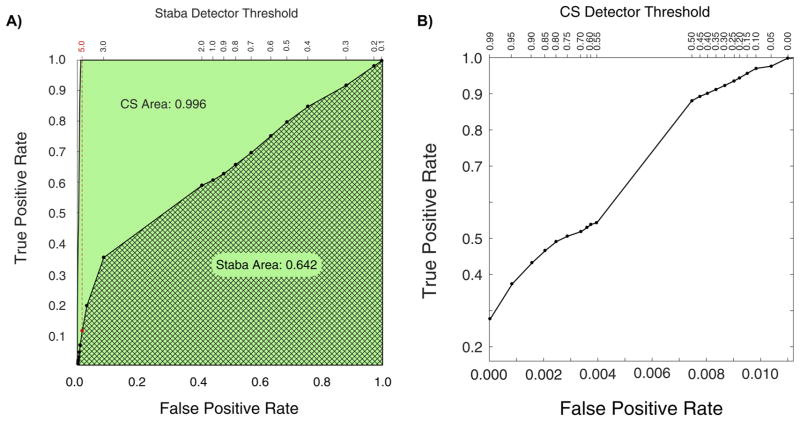
Receiver operating characteristic (ROC) analysis was performed to compare the CS algorithm performance to the Staba detector. A true positive detection was considered an event accepted by both the algorithm at a given threshold and gold standard data set. Likewise, a true negative was considered a detection rejected by both the algorithm at a given threshold and the gold standard data set. However, the HFO events in the data represent only a small percentage of the entire recording time. Even at thresholds of 0, although 100% sensitive, the detector only selects a small fraction of the data for candidate events. Therefore the ROC analysis was performed considering whether each timepoint in the dataset was correctly categorized as an event (true positive, TP) or not an event (true negative). The true positive rates (TPR) and false positive rates (FPR) were calculated as shown below for each threshold. The OR threshold was varied for the CS algorithm (default is 0.2). As threshold variance was not specified in the original Staba description, the RMS threshold originally set to five times the standard deviation of the RMS amplitude was allowed to be a varying parameter.
ROC results are shown in Fig. 9A & 9B. Fig. 9A illustrates the high specificity of the CS algorithm and its ability to rule out candidate events that may have features of HFOs, but are not true events (see Fig. 8). Fig. 9A also shows the performance of the Staba detector (Staba et al., 2002) for comparison. The area under the curve for the CS algorithm (green) was 0.996 compared to 0.642 for the Staba detector (thatched). The original Staba threshold of 5 is indicated in red on Fig. 9A. At this threshold, the Staba detector is very specific, but not highly sensitive in identifying candidate events within our gold standard data set. No true events that were detected by the Staba detector at it’s default threshold were missed by the CS detector at any threshold; note where the Staba detector threshold intersect the CS ROC in Fig. 9A. Fig. 9B expands the leftmost region of the False Positive Rate axis in Fig. 9A to better visualize the variable region of the CS algorithm’s ROC curve.
Fig. 9.
Comparison of the CS to Staba detections. Panel A on the left is the receiver-operator characteristic for the Staba detector is shown, and generated by varying the RMS threshold specified to be 5.0 in the published algorithm. Panel B, on the right, is an expansion of the leftmost portion of the CS detector ROC curve as the threshold is varied between 0 and 1.
In order to evaluate the temporal precision of the CS detector, artificially created HFO events were inserted into an intracranial EEG recording acquired from a contact located in the white matter (where HFOs are generally not detected). The signal was visually reviewed to ensure absence of any pathologic activity and physiological HFO. The detection was performed with the lowest threshold to detect all events. Inserted artificial HFOs were matched with algorithm detections and their onsets and offsets compared. The performance was compared with a line-length (LL) detector with a fixed 85 ms sliding window (Gardner et al., 2007). Fig. 10 shows the results of the differences from the known onset and offset for the two algorithms. The CS algorithm had mean differences of −4.6 ± 5.3 ms for the onsets and 4.9 ± 5.9 ms for the offsets. The LL algorithm had mean differences of −41.7 ± 14.3 ms for the onsets and 53.5 ± 10.1 ms for the offsets.
Fig. 10.

Temporal precision of the CS algorithm compared with a standard line length (LL) detector. Onset and offset time were known from artificial insertion of events.
Algorithmic speed was evaluated on a 2010 Mac Pro with dual 2.93 GHz 6-Core Intel Xeon processors, and 32 GB of 1333 MHz RAM. Two hours of a single channel of 5 kHz sampled data was processed in 2 min and 5 s (true execution time, not processor time) using the C code available, along with representative datasets at http://msel.mayo.edu/codes.html. On this equipment a single channel was processed 57.6 times faster than real acquisition time which is sufficient for use in a clinical setting. Clinical application would require parallel processing, which is easily implemented since the algorithm does not rely on interchannel detection information. We have successfully implemented the CS algorithm for real-time detection of HFO events in clinical patients.
3. Discussion
We present a novel HFO detection algorithm that is suitable for processing large datasets while efficiently eliminating false positive detections produced by sharp transients and dealing with EEG non-stationarity. Experience of expert reviewers is accounted for by a cascade of boundary thresholds calculated from visually marked events. We have made all code and data available in an effort to support reproducible research (Donoho, D. L., 2010).
In developing this algorithm, we experimented with variants of most published approaches to HFO detection. The method described here evolved in the process of overcoming shortcomings of the other techniques. A direct comparison of the CS algorithm with other published work was touched upon in the ROC analysis (Staba detector, Fig. 9) and temporal precision (line-length detector, Fig. 10). While valuable, quantitative comparison with all other published detection algorithms is beyond the scope of this paper. It is worth noting that in most cases comparison between published algorithms is difficult because neither the code nor data are made available. In an effort to stimulate comparison of the CS algorithm with existing and future algorithms we have made data and code available at http://msel.mayo.edu/codes.html.
Early detectors (Staba et al., 2002; Gardner et al., 2007) provided fast and reliable ways of detecting HFOs but completely disregarded false positive detections in filtered signals produced by sharp transients. The recently published algorithm by Birot et al. (Birot et al., 2013) addresses the Gibbs’ phenomenon by calculating power ratios in the frequency domain. While this method utilizes a simple approach its purpose is to detect fast ripples only. However, others (Worrell et al., 2008; Jacobs et al., 2010) have shown that oscillations in ripple frequency band (80–250 Hz) can have clinical value. Failure to detect these may lead to a loss of potentially important information. Another approach proposed by Burnos et al. (2014) evaluates positions of peaks and nadirs in frequency spectra. This method assumes that HFO events exhibit a peak in high frequency and are separated from low frequencies by spectral nadir, therefore not addressing the case of ripples co-occurring with IEDs, which often show overlap in the frequency domain. The CS HFO detector presented here exploits the phase correlation of bandpass filtered signal with low passed filtered signal rather than using frequency spectra to avoid filtering artifacts. This leads to clear distinction between filtered sharp transients and true oscillations in any frequency and efficiently eliminates the false positive detections produced by Gibbs’ phenomenon.
Most of the algorithms developed to date take a simple approach by integrating RMS or line-length of a bandpass filtered signal in the first stage of detection. Since both approaches are based on calculations in fixed-width or sliding or partially overlapping windows, this naturally leads to errors in detections of HFO onsets and offsets, which can have an impact on evaluation of HFO with IEDs, slow waves, and other EEG phenomena. The samplewise evaluation used by the CS algorithm allows for more precise estimation of HFO onset and offset. In comparison to a line-length detector which exhibits error of ~48 ms the presented algorithm achieved ~4.8 ms error, irrespective of the HFO relative amplitude to surrounding signal.
Historically HFOs have been divided into gamma, ripples and fast ripples based on the pioneering work of Buzsaki and Bragin (Buzsáki et al., 1992; Bragin et al., 1999, reviewed in Buzsáki et al., 2012) and HFO detectors use the same frequency bands. Nonetheless, recent studies suggest that such a distinction is incorrect because physiological HFOs can reach frequencies over 250 Hz (Kucewicz et al., 2014) and pathological HFOs can occur in the ripple range (Worrell et al., 2008). Moreover, the bimodal distribution of ripple and fast ripple HFO frequencies was not confirmed (Worrell et al., 2008; Blanco et al., 2011). The proposed algorithm detects HFOs independently in four overlapping frequency bands giving relatively coarse information about the distribution of HFOs in frequency space. However, the core of the algorithm is independent of frequency band and can be applied to any number of bands, as shown in Fig. 2.
Non-stationarirty of EEG is a commonly overlooked problem in HFO detection. In (Staba et al., 2002; Gardner et al., 2007) and all subsequent algorithms based on these early detectors the detection threshold is a statistical value of the entire, or long stretches of the processed signal; for short, multiple minute, datasets, this may not be problematic. However, this method does not compensate for changing statistical characteristics typical for longer EEG datasets. In the method proposed here, we use Poisson normalization of 10 second statistical windows to reduce effects of non-stationarity of EEG on HFO detection. The width of the statistical window is an adjustable parameter of the algorithm.
While the CS algorithm overcomes some important issues in HFO detection there remain some limitations. Expert reviewed HFOs are still considered a gold standard and are used to enhance algorithmic specificity in general. This approach commonly works, however, it introduces reviewer bias into the processing pipeline and fits the algorithm to the training dataset. Furthermore, most expert reviewed datasets begin with a superset of hypersensitive detections derived from a very low threshold version of the detector being evaluated. We, and others have previously characterized the Staba detector as sensitive, but not specific, however, examination of the Staba detector performance on this gold standard data set shown in fire 9 A reveals only about 13% sensitivity. The candidate detections for the gold standard data used here was generated by accepting all events that crossed the edge threshold on the product traces. The human reviewers were presented with the same event in 5 s, 1 s, and 0.2 s windows on the same page, with the raw data and the bandpass filtered data overlaid, simultaneously. Because of this more rigorous inspection method we believe that many more HFO events were identified than in previous method descriptions. Efforts were made in the development here to include data sets of varying integrity, sampling frequency, electrode dimensions, and species. Incorporation of more reviewed HFOs from different reviewers and datasets acquired under different conditions would likely enhance the generality of the algorithm by fine tuning the gamma curves for the feature thresholds.
Lastly, a potential weakness of implementing the algorithm this way is that it does not utilize any cross channel information. While this design is efficient and facilitates parallel computing, there are rare instances in which human expert reviewers would positively identify an event on a single channel based on its morphology alone, while multiple concomitantly recorded channels show the same event, indicating that it is truly artifactual. Rejection of coincident detections on multichannel analysis would improve algorithmic performance under these conditions. However, we have performed a second stage analysis to look for such coincident detections. Exclusion of these rare events produces negligible quantitative and no qualitative differences in our results, so we do not routinely perform this step.
Future work will focus on further enhancement of performance, detection clustering and implementation in real time processing.
4. Conclusions
We present an algorithm for HFO detection in intracranial EEG recordings acquired from both micro and macro electrode recordings. Non-stationarity of EEG signal is compensated for by normalization of statistical windows and expert clinical experience is represented by a series of normalized boundary thresholds for HFO features. Temporal localization of HFO onset and offset exceeds that of the line-length benchmark detector. Detection results do not focus only on HFO counts but provide information about HFO onset, offset, frequency, amplitude, and frequency distribution of the detections. The algorithm shows satisfactory detection performance to be employed without expert review, and computational efficiency to be used in a clinical setting.
Matlab and C code for this algorithm, and representative datasets are available at http://msel.mayo.edu/codes.html.
HIGHLIGHTS.
A novel method for detecting High Frequency Oscillations is presented and validated.
Sensitivity and specificity are shown to be superior to established algorithms.
Performance is shown to be sufficient for unsupervised use in a clinical setting.
Acknowledgments
Support
NIH/NINDS U24 NS63930 The International Epilepsy Electrophysiology Database. NIH/NINDS R01 NS78136 Microscale EEG interictal dynamics & transition into seizure in human & animals
Special thanks to Vincent Vasoli of Mayo Systems Electrophysiology Lab who contributed significantly to the concepts and code base supporting this detector in the early stages of its development.
Nomenclature
Definitions
- TT
total time of all the recordings scored
- APT
total time of gold standard positive detections
- ANT
TT - APT
- TP
total time of true positive detections
- FP
total time of false positive detections
For each threshold
- TPR
TP/APT
- FPR
FP/ANT
References
- Axmacher N, Elger CE, Fell J. Ripples in the medial temporal lobe are relevant for human memory consolidation. Brain. 2008;131:1806–1817. doi: 10.1093/brain/awn103. [DOI] [PubMed] [Google Scholar]
- Birot G, et al. Automatic detection of fast ripples. J Neurosci Methods. 2013;213(2):236–249. doi: 10.1016/j.jneumeth.2012.12.013. [DOI] [PubMed] [Google Scholar]
- Blanco JA, et al. Unsupervised classification of high-frequency oscillations in human neocortical epilepsy and control patients. J Neurophysiol. 2010;104(5):2900–2912. doi: 10.1152/jn.01082.2009. [DOI] [PMC free article] [PubMed] [Google Scholar]
- Blanco JA, et al. Data mining neocortical high-frequency oscillations in epilepsy and controls. Brain. 2012;134:2948–2959. doi: 10.1093/brain/awr212. [DOI] [PMC free article] [PubMed] [Google Scholar]
- Bragin A, et al. High-frequency oscillations in human brain. Hippocampus. 1999;9(2):137–142. doi: 10.1002/(SICI)1098-1063(1999)9:2<137::AID-HIPO5>3.0.CO;2-0. Available at: http://www.ncbi.nlm.nih.gov/pubmed/12325068. [DOI] [PubMed] [Google Scholar]
- Burnos S, et al. Human intracranial high frequency oscillations (HFOs) detected by automatic time-frequency analysis. PLOS ONE. 2014;9(4):e94381. doi: 10.1371/journal.pone.0094381. [DOI] [PMC free article] [PubMed] [Google Scholar]
- Buzsáki G, et al. High-frequency network oscillation in the hippocampus. Science (New York, NY) 1992;256(5059):1025–1027. doi: 10.1126/science.1589772. [DOI] [PubMed] [Google Scholar]
- Buzsáki G, Silva FL. High frequency oscillations in the intact brain. Prog Neurobiol. 2012;98:241–249. doi: 10.1016/j.pneurobio.2012.02.004. [DOI] [PMC free article] [PubMed] [Google Scholar]
- Chaibi S, et al. Automated detection and classification of high frequency oscillations (HFOs) in human intracereberal EEG. Biomed Signal Process Control. 2013;8(6):927–934. [Google Scholar]
- Donoho DL. An invitation to reproducible computational research. Biostatistics. 2010;11:385–388. doi: 10.1093/biostatistics/kxq028. [DOI] [PubMed] [Google Scholar]
- Dümpelmann M, et al. Automatic 80–250 Hz “ripple” high frequency oscillation detection in invasive subdural grid and strip recordings in epilepsy by a radial basis function neural network. Clin Neurophysiol. 2012;123(9):1721–1731. doi: 10.1016/j.clinph.2012.02.072. [DOI] [PubMed] [Google Scholar]
- Gardner AB, Worrell GA, Marsh E, Dlugos D, Litt B. Human and automated detection of high-frequency oscillations in clinical intracranial EEG recordings. Clin Neurophysiol. 2007;118:1134–1143. doi: 10.1016/j.clinph.2006.12.019. [DOI] [PMC free article] [PubMed] [Google Scholar]
- Gibbs J. Fourier’s Series. Nature Lix. 1899:200, 600. [Google Scholar]
- Gross DW, Gotman J. Correlation of high-frequency oscillations with the sleep-wake cycle and cognitive activity in humans. Neuroscience. 1999;94(4):1005–1018. doi: 10.1016/s0306-4522(99)00343-7. [DOI] [PubMed] [Google Scholar]
- Jacobs J, et al. High-frequency electroencephalographic oscillations correlate with outcome of epilepsy surgery. Ann Neurol. 2010;67(2):209–220. doi: 10.1002/ana.21847. [DOI] [PMC free article] [PubMed] [Google Scholar]
- Jadhav SP, et al. Awake Hippocampal Sharp-Wave Ripples Support Spatial Memory. Science. 2012;336:1454–1458. doi: 10.1126/science.1217230. [DOI] [PMC free article] [PubMed] [Google Scholar]
- Kucewicz MT, et al. High frequency oscillations are associated with cognitive processing in human recognition memory. Brain. 2014:1–14. doi: 10.1093/brain/awu149. [DOI] [PMC free article] [PubMed] [Google Scholar]
- Staba RJ, et al. Quantitative analysis of high-frequency oscillations (80–500 Hz) recorded in human epileptic hippocampus and entorhinal cortex. J Neurophysiol. 2002;88:1743–1752. doi: 10.1152/jn.2002.88.4.1743. [DOI] [PubMed] [Google Scholar]
- Staba RJ, et al. High-frequency oscillations recorded in human medial temporal lobe during sleep. Ann Neurol. 2004;56(1):108–115. doi: 10.1002/ana.20164. [DOI] [PubMed] [Google Scholar]
- Urrestarazu E, Chander R, Dubeau F, Gotman J. Interictal high-frequency oscillations (100–500 Hz) in the intracerebral EEG of epileptic patients. Brain. 2007;130:2354–2366. doi: 10.1093/brain/awm149. [DOI] [PubMed] [Google Scholar]
- Worrell GA, et al. High-frequency oscillations and seizure generation in neocortical epilepsy. Brain. 2004;127(Pt 7):1496–1506. doi: 10.1093/brain/awh149. [DOI] [PubMed] [Google Scholar]
- Worrell GA, et al. High-frequency oscillations in human temporal lobe: simultaneous microwire and clinical macroelectrode recordings. Brain. 2008;131(Pt 4):928–937. doi: 10.1093/brain/awn006. [DOI] [PMC free article] [PubMed] [Google Scholar]
- Zelmann R, et al. A comparison between detectors of high frequency oscillations. Clin Neurophysiol. 2012;123(1):106–116. doi: 10.1016/j.clinph.2011.06.006. [DOI] [PMC free article] [PubMed] [Google Scholar]
- Zelmann R, et al. Automatic detector of High Frequency Oscillations for human recordings with macroelectrodes. 32nd Annual International Conference of the IEEE EMBS; Buenos Aires. 2010. pp. 2329–2333. [DOI] [PMC free article] [PubMed] [Google Scholar]


