

Abstract
Brain regions that regulate fluid satiation are not well characterized, yet are essential for understanding fluid homeostasis. We found that oxytocin-receptor-expressing neurons in the parabrachial nucleus of mice (OxtrPBN neurons) are key regulators of fluid satiation. Chemogenetic activation of OxtrPBN neurons robustly suppressed noncaloric fluid intake, but did not decrease food intake after fasting or salt intake following salt depletion; inactivation increased saline intake after dehydration and hypertonic saline injection. Under physiological conditions, OxtrPBN neurons were activated by fluid satiation and hypertonic saline injection. OxtrPBN neurons were directly innervated by oxytocin neurons in the paraventricular hypothalamus (OxtPVH neurons), which mildly attenuated fluid intake. Activation of neurons in the nucleus of the solitary tract substantially suppressed fluid intake and activated OxtrPBN neurons. Our results suggest that OxtrPBN neurons act as a key node in the fluid satiation neurocircuitry, which acts to decrease water and/or saline intake to prevent or attenuate hypervolemia and hypernatremia.
The authors show that oxytocin-receptor-expressing neurons in the parabrachial nucleus are key regulators of fluid homeostasis that suppress fluid intake when activated, but do not decrease food intake after fasting or salt intake after salt depletion.
Main
The neuropeptide oxytocin has well-recognized roles in lactation, parturition and social interaction1. Pharmacological studies have shown that oxytocin also decreases ingestive behaviors, including feeding, drinking and salt intake2–5, and increases renal NaCl excretion after a salt load in rodents6–8. This suggests that oxytocin regulates fluid homeostasis, which requires tight control of both NaCl and water to maintain extracellular fluid (ECF) volume and osmolarity9–12. ECF volume is proportional to total body sodium content, whereas osmolarity is regulated by the ingestion and excretion of water and sodium9–12.
Oxytocin-expressing neurons are located in the paraventricular nucleus of the hypothalamus (PVH) and supraoptic nucleus (SON) and project axons to the posterior pituitary to release oxytocin peripherally1. The PVH also contains oxytocin-expressing neurons that project within the CNS1. The oxytocin receptor (Oxtr) is expressed in several brain regions and is responsible for mediating the central effects of oxytocin1,13.
To evaluate the role of oxytocin-related neural circuitry on ingestive behaviors, we generated mice expressing Cre recombinase at the Oxtr locus (Supplementary Fig. 1). A recent study demonstrated that optogenetic stimulation of Oxtr-expressing neurons in the arcuate nucleus decreases feeding14. Here we focused on Oxtr-expressing neurons in the parabrachial nucleus, a brain region that is known to modulate ingestive behaviors15–19. We found that OxtrPBN neurons are important regulators of fluid intake.
Supplementary Figure 1. Generation of OxtrCre:GFP mice.

Diagram showing: top, insertion of ires-mnCre:GFP construct just 3’ of the termination codon of the Oxtr gene; bottom, the targeting vector. Some key restriction enzymes sites used for cloning are shown. See Methods for details
Results
Oxtr is expressed in the PBN
To examine where Oxtr is expressed in the mouse brain, we bred Oxtr Cre/+ mice with Cre-dependent TdTomato reporter (Ai14) mice. We observed robust TdTomato expression in the dorsolateral (dl) and external lateral (el) parabrachial nucleus (PBN) (649 ± 39 OxtrPBN neurons per brain) and several other brain regions (Fig. 1a and Supplementary Fig. 2a,b). We confirmed adult expression of Oxtr by injecting adeno-associated virus (AAV) carrying Cre-dependent mCherry (AAV1-DIO-mCherry) into the PBN of adult Oxtr Cre/+ mice and by in situ hybridization for Oxtr mRNA in Oxtr Cre/+ ::Ai14 mice (Fig. 1b and Supplementary Fig. 2c). To characterize the effects of oxytocin on OxtrPBN neurons, we recorded the activity of fluorescently labeled cells in brain slices and observed that bath application of Thr4,Gly7-oxytocin (TGOT), a selective Oxtr agonist, efficiently activated OxtrPBN neurons, and this activation was blocked by coadministration of atosiban (oxytocin-receptor antagonist), which confirmed the specificity of the activation (Fig. 1c and Supplementary Fig. 2d).
Fig. 1. OxtrPBN activation suppresses fluid but not food intake.
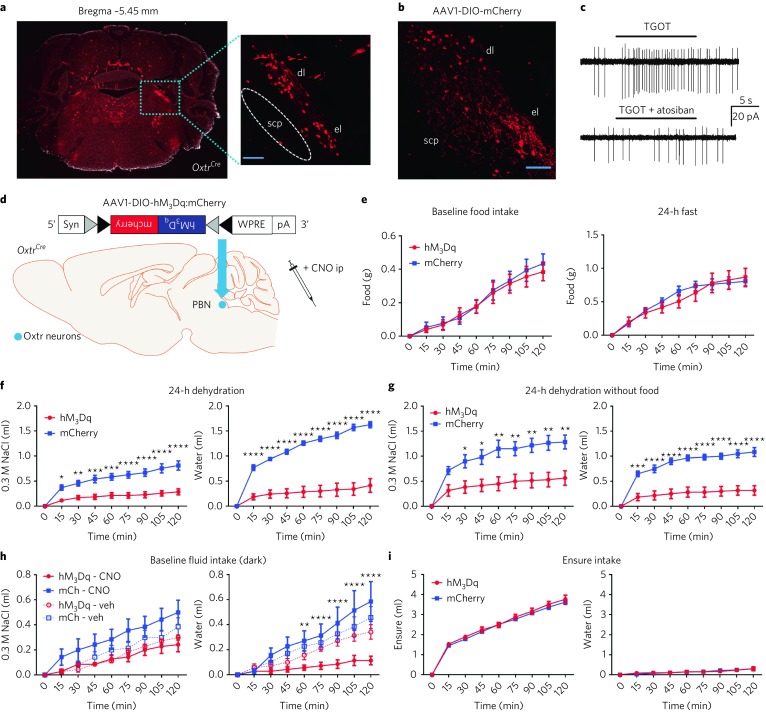
a,b, TdTomato expression in PBN of Oxtr Cre/+::Ai14 reporter mice (n = 3; a) and adult expression of mCherry fluorescence in OxtrPBN neurons (b) following injection of AAV-DIO-mCherry in a 9-week-old Oxtr Cre/+ male mouse (n = 7). dl, dorsolateral; el, external lateral; scp, superior cerebellar peduncle. Scale bar represents 100 µm. c, Representative example of electrophysiological activity in an OxtrPBN neuron using cell-attached configuration. We observed increased spiking after application of the Oxtr agonist TGOT (0.2 μM), which was inhibited by coadministration of the Oxtr antagonist atosiban (1 μM; the same neuron) (n = 4 of 4 OxtrPBN neurons). d, Injection of AAV-DIO-hM3Dq:mCherry in OxtrPBN neurons. Gray and black triangles denote loxP and lox2722 sites, respectively. e–i, Acute OxtrPBN activation with CNO revealed no significant change in food intake at baseline or after 24 h of fasting (n = 7 per group; two-way repeated measures (RM) ANOVA; baseline food: interaction F(8,96) = 0.2901, P = 0.9678; 24-h fast: interaction F(8,96) = 1.143, P = 0.3424) (e); decreased water and NaCl consumption following 24-h dehydration in the presence of food (n = 7 per group; two-way RM ANOVA; NaCl: interaction F(8,96) = 12.63, P < 0.0001; water: interaction F(8,96) = 39.75, P < 0.0001) (f) and in the absence of food (n = 6 per group; two-way RM ANOVA; NaCl: interaction F(8,80) = 8.173, P < 0.0001; water: interaction F(8,80) = 22.31, P < 0.0001) (g); decreased water consumption at baseline (n = 7 per group; three-way mixed design ANOVA; NaCl: interaction F(2.875,34.501) = 1.593, P = 0.210; water: interaction F(2.099,25.183) = 4.464, P = 0.021) (h); and no significant change in Ensure or water intake following 24 h of caloric deprivation (n = 6 hM3Dq, 7 mCherry; two-way RM ANOVA; Ensure: interaction F(8,88) = 0.3809, P = 0.9282; water: interaction F(8,88) = 0.5037, P = 0.8505). Data are expressed as mean ± s.e.m. mCh, mCherry; veh, vehicle. ****P < 0.0001; ***P < 0.001; **P < 0.01; *P < 0.05. See Supplementary Table 2 for statistical analyses.
Supplementary Figure 2. Oxytocin receptor expression in the parabrachial nucleus.

(a) Coronal sections 90 µm apart from Oxtr Cre/+ ::Ai14 mouse demonstrating oxytocin receptor (Oxtr) expression in the parabrachial nucleus (PBN) from bregma −5.1 to −5.5; scale bar, 500 µm. (b) Selection of brain images demonstrating robust Oxtr expression; AD, anterodorsal thalamic nucleus; CeA, central nucleus of amygdala; EPd, dorsal endopiriform nucleus; DMV, dorsal motor nucleus of the vagus; DR, dorsal raphé nucleus; GP, globus pallidus; XII, hypoglossal nucleus; MD, mediodorsal thalamic nucleus; NAc, nucleus accumbens; PBN, parabrachial nucleus; PVT, paraventricular thalamic nucleus; pVH, periventricular nucleus of the hypothalamus; SFO, subfornical organ; V, trigeminal motor nucleus; VMH, ventromedial hypothalamic nucleus; scale bar, 500 µm (n = 3). (c) Representative RNAscope® image of PBN demonstrating coexpression of Oxtr mRNA in 80 ± 3% Oxtr:TdTomato-expressing neurons (n = 3). Scale bar, 100 μm; scp, superior cerebellar peduncle. (d) Oxtr agonist, TGOT, increased spiking frequency in OxtrPBN neurons by 3.7 ± 0.55-fold, which was inhibited by Oxtr antagonist, atosiban to 1.6 ± 0.14 fold (n = 4/4 OxtrPBN neurons). Data were normalized to spiking frequency prior to TGOT application
OxtrPBN neuron activation suppresses noncaloric fluid intake
We initially asked whether activating OxtrPBN neurons modulated feeding behavior. We bilaterally injected AAV carrying a Cre-dependent hM3Dq:mCherry (AAV1-DIO-hM3Dq:mCherry)20 into the PBN of Oxtr Cre/+ mice (Fig. 1d) and chemogenetically activated the neurons by injecting the synthetic ligand clozapine-N-oxide (CNO, 1 mg kg−1, intraperitoneally, ip), 30 min before the dark cycle or following a 24-h fast. We observed no significant difference in food intake compared to controls injected with AAV1-DIO-mCherry (Fig. 1e).
We also investigated the effect of OxtrPBN activation on fluid homeostasis. To assess both ECF volume and osmolarity, we used a two-bottle choice task consisting of water and 0.3 M NaCl (saline)17,19 and fed mice a sodium-depleted diet21. The molarity of total fluid intake under control conditions was ~0.15 M NaCl (equivalent to normal saline). Chemogenetic activation of OxtrPBN neurons after 24-h fluid deprivation suppressed total fluid intake (both water and 0.3 M NaCl) at the start of the dark cycle (Fig. 1f). After ~4 h, there was a rebound such that the cumulative overnight NaCl intake was not significantly different between hM3Dq-expressing and control mice (P = 0.5821), and there was only a small difference in cumulative water intake (P = 0.0394; Supplementary Fig. 3a). To assess whether the presence of food affected fluid intake, we stimulated OxtrPBN neurons after 24 h of fluid deprivation and then denied them food. The mice expressing hM3Dq decreased both water and NaCl intake, similarly to when food was present; however, control (mCherry-expressing) mice drank less water but drank more NaCl when food was absent (Fig. 1g and Supplementary Fig. 3b). We also investigated the effects of OxtrPBN stimulation at the start of the dark cycle without prior fluid deprivation. We observed a significant decrease in water intake in hM3Dq-expressing mice compared with controls following CNO, but not vehicle, whereas NaCl intake was not significantly different, although intake was low (Fig. 1h). There was no significant difference in cumulative overnight intake of NaCl (P = 0.2038) or water (P = 0.6645) in hM3Dq- or mCherry-expressing mice (Supplementary Fig. 3c).
Supplementary Figure 3. Chemogenetic activation of OxtrPBN neurons decreases fluid intake acutely.

(a) Overnight NaCl was not significantly different, but overnight water intake remained slightly decreased following CNO injection in hM3Dq-injected vs control mCherry-injected mice after 24-h dehydration (n = 7/group; unpaired 2-tailed Student’s t-test; NaCl: t(12) = 0.5656; p = 0.5821; water: t(12) = 2.311; p = 0.0394). (b) Control mCherry-injected mice consumed more NaCl and less water when food was absent; but there was no significant difference in fluid intake after CNO injection in hM3Dq-injected mice (n = 7/group in food present; 6/group in food absent; 2-way ANOVA; NaCl: interaction F(1,22) = 0.7401; p = 0.3989; main effect of viral genotype F(1,22) = 32.44; p < 0.0001; main effect of food availability F(1,22) = 11.77; p = 0.0024; water: interaction F(1,22) = 4.946; p = 0.0367). (c) Overnight baseline fluid intake was not significantly different following vehicle or CNO injection (n = 7/group; 2-way RM ANOVA; NaCl: interaction F(1,12) = 1.806; p = 0.2038; water: interaction F(1,12) = 0.1977; p = 0.6645). d,e, Acute OxtrPBN activation demonstrated no significant difference in Ensure or water intake when Ensure was limited to (d) ~1.6 mL (n = 6/group; 2-way RM ANOVA; Ensure: interaction F(8,80) = 1.168; p = 0.3285; water: interaction F(8,80) = 1.027; p = 0.4228) or (e) ~0.7 mL (n = 6/group; 2-way RM ANOVA; Ensure: interaction F(8,80) = 1.182; p = 0.3202; water: interaction F(8,80) = 1.313; p = 0.2489). (f) Overnight fluid intake was not significantly different after hypertonic saline ip injection in hM3Dq- or vs mCherry-injected mice (n = 7/group; unpaired 2-tailed Student’s t-test; NaCl: t(12) = 0.2868; p = 0.7791; water: t(12) = 1.354; p = 0.2008). (g) Daily intake of NaCl and water was not significantly different between the start and end of experimentation (n = 7/group; 2-way RM ANOVA; NaCl: interaction F(1,12) = 0.1273; p = 0.7275; water: interaction: F(1,12) = 4.243; p = 0.0618). (h) Percentage Fos in OxtrPBN neurons in hM3Dq-injected vs mCherry-injected Oxtr Cre/+ mice (n = 7/group; unpaired 2-tailed Student’s t-test; t(12) = 19.28; p < 0.0001). Data expressed as mean ± s.e.m. ****p < 0.0001; **p < 0.01; *p < 0.05. See Supplementary Information for statistical analyses
Because OxtrPBN stimulation decreased fluid but not food intake, we stimulated OxtrPBN neurons during intake of a liquid diet of Ensure nutrition drink. After 24-h of caloric deprivation, intake of Ensure and water was unaffected (Fig. 1i), indicating that OxtrPBN stimulation does not decrease the intake of all liquids. Apparently, the highly palatable nature of Ensure overrode the ability of OxtrPBN stimulation to suppress fluid intake. Because mice drank only minimal water in this experiment, we repeated it, but returned fixed amounts of Ensure (1.6 or 0.7 ml); however, both hM3Dq- and mCherry-expressing mice still drank limited amounts of water (Supplementary Fig. 3d,e), suggesting that the presence of even small amounts of Ensure decreases concurrent water intake. We assessed the effects of activating OxtrPBN neurons on food intake during mild dehydration and observed decreased food intake (control diet) in hM3Dq-injected mice (Fig. 2a), suggesting that OxtrPBN neurons may be involved in mediating dehydration-induced anorexia22.
Fig. 2. OxtrPBN activation decreases food intake in dehydrated mice and suppresses water intake following 48-h salt depletion and thirst-inducing conditions.
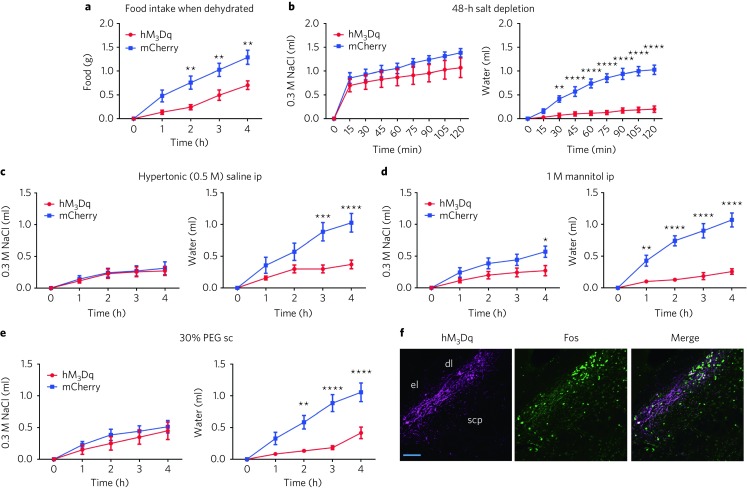
a, Acute OxtrPBN stimulation decreases food intake when mice are dehydrated (n = 6 hM3Dq, 7 mCherry; two-way RM ANOVA; interaction F(4,44) = 7.143, P = 0.0002). b–e, Acute OxtrPBN stimulation also decreases water, but not NaCl, consumption following 48-h salt depletion (n = 7/group; two-way RM ANOVA; NaCl: interaction F(8,96) = 1.408, P = 0.2028; water: interaction F(8,96) = 35.57, P < 0.0001) (b), 0.5 M saline ip injection (n = 7/group; two-way RM ANOVA; NaCl: interaction F(4,48) = 0.08955, P = 0.9853; water: interaction F(4,48) = 11.37, P < 0.0001) (c), 1 M mannitol ip injection (n = 7/group; two-way RM ANOVA; NaCl: interaction F(4,48) = 3.638, P = 0.0114; water: interaction F(4,48) = 24.56, P < 0.0001) (d) and 30% PEG sc injection (n = 6 hM3Dq, 7 mCherry; two-way RM ANOVA; NaCl: interaction F(4,44) = 0.4042, P = 0.8046; water: interaction F(4,44) = 11.54, P < 0.0001) (e). f, Following CNO administration, Fos was robustly expressed in OxtrPBN and adjacent neurons in hM3Dq-injected mice. Scale bar represents 100 µm. Data are expressed as mean ± s.e.m. ****P < 0.0001; ***P < 0.001; **P < 0.01; *P < 0.05. See Supplementary Table 2 for statistical analyses.
We also examined the effect of OxtrPBN stimulation after salt depletion by injecting mice on a sodium-depleted diet with the diuretic furosemide (40 mg kg–1 ip, twice, 1 d apart) and removing access to saline (0.3 M NaCl) for 48 h. OxtrPBN stimulation suppressed water, but not NaCl, intake (Fig. 2b), suggesting that it does not suppress salt appetite. We also assessed the effect of OxtrPBN stimulation after generating thirst by two different mechanisms: increasing osmolarity and inducing volume loss9,11. To increase osmolarity, we injected hypertonic 0.5 M NaCl or equiosmolar 1 M mannitol ip23; whereas we induced volume loss by injecting 30% polyethylene glycol (PEG) subcutaneously, which progressively draws out ECF without affecting osmolarity5. We observed that OxtrPBN stimulation suppressed water intake after hypertonic saline injection in hM3Dq- versus mCherry-injected mice (Fig. 2c); however, there was no significant difference in overnight water intake (P = 0.2008), suggesting a rebound effect in fluid intake (Supplementary Fig. 3f). OxtrPBN stimulation also decreased fluid intake after mannitol and PEG injections (Fig. 2d,e). Throughout the experiments, we observed that mice retained similar daily baseline NaCl and water intake (Supplementary Fig. 3g). Following experimentation, we confirmed the targeting and activation of OxtrPBN neurons by injecting CNO 2 h before perfusion, and we observed Fos expression in 72 ± 4% of hM3Dq-expressing neurons (and some adjacent neurons) in the PBN (Fig. 2f and Supplementary Fig. 3h).
OxtrPBN neurons are necessary for protection against hypernatremia
To ascertain whether OxtrPBN neurons are necessary for fluid regulation, we chronically inactivated them by bilaterally injecting AAV carrying a Cre-dependent tetanus toxin light chain (AAV1-DIO-GFP:TetTox)24 or control (AAV1-DIO-YFP) into the PBN of Oxtr Cre/+mice (Fig. 3a and Supplementary Fig. 4a,b). We found no significant difference in baseline NaCl preference at 0.075 M (P = 0.6292), 0.3 M (P = 0.3364) or 0.5 M (P = 0.9224) (Supplementary Fig. 4c), and no substantial difference in baseline fluid intake after vehicle injection, either acutely (2 h) or overnight (Supplementary Fig. 4d,e). Following 24-h fluid deprivation, however, we observed increased NaCl, but not water, intake in TetTox-injected mice (Fig. 3b), which remained increased overnight, suggesting a longer term effect on fluid intake than that for hM3Dq-injected mice (Supplementary Fig. 4f). We also observed increased 0.3 M NaCl intake after hypertonic (0.5 M) saline ip injection, but not after salt depletion or other tests of fluid intake (Fig. 3c,d and Supplementary Fig. 4g,h). Following experimentation, we observed no significant correlation between TetTox-GFP expression and fluid intake (for NaCl, P = 0.5408; for water, P = 0.3905; Supplementary Fig. 4i). Overall, these results suggest that OxtrPBN neuron activity prevents excessive NaCl ingestion following dehydration and hypertonic saline injection.
Fig. 3. OxtrPBN neuron inhibition increases NaCl intake after dehydration, after hypertonic saline injection and at baseline.
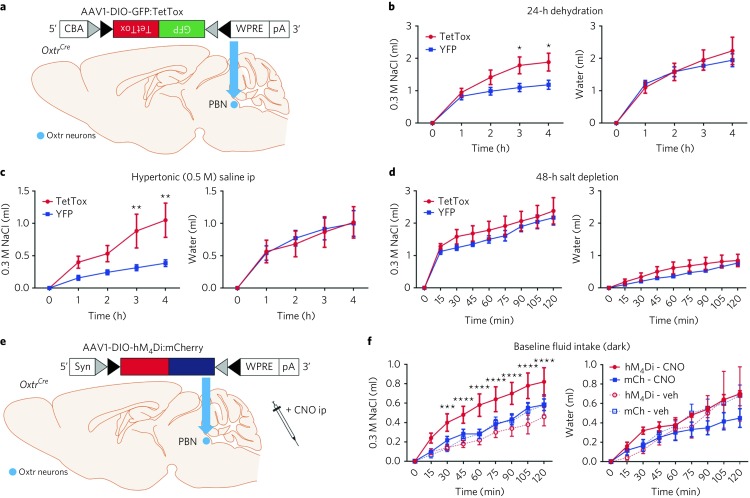
a, Injection of AAV-DIO-GFP:TetTox in OxtrPBN neurons. b–d, Chronic OxtrPBN inactivation increased NaCl consumption after 24-h fluid deprivation (n = 6 TetTox, 7 YFP; two-way RM ANOVA; NaCl: interaction F(4,44) = 5.704, P = 0.0009; water: interaction F(4,44) = 0.7961, P = 0.5342) (b) and after 0.5 M saline ip injection (n = 6 TetTox, 7 YFP; two-way RM ANOVA; NaCl: interaction F(4,44) = 5.497, P = 0.0011; water: interaction F(4,44) = 0.1334, P = 0.9693) (c), but not after 48-h salt depletion (n = 6 TetTox, 7 YFP; two-way RM ANOVA; NaCl: interaction F(8,88) = 0.4136, P = 0.9100; water: interaction F(8,88) = 0.8966, P = 0.5230) (d). e, Injection of AAV-DIO-hM4Di:mCherry in OxtrPBN neurons. f, Acute OxtrPBN inhibition increased baseline NaCl intake at the start of the dark cycle (n = 5 hM4Di, 6 mCherry; three-way mixed design ANOVA; NaCl: interaction F(2.644,23.797) = 4.305, P = 0.018; water: interaction F(1.451,13.062) = 0.790, P = 0.436). Data are expressed as mean ± s.e.m. ****P < 0.0001; ***P < 0.001; **P < 0.01; *P < 0.05. See Supplementary Table 2 for statistical analyses.
Supplementary Figure 4. Chronic OxtrPBN neuron inactivation does not affect fluid intake at baseline or following various homeostatic challenges.

(a) Injection of AAV-DIO-GFP:TetTox in OxtrPBN neurons. (b) Representative images of GFP expression in OxtrPBN neurons in GFP:TetTox- vs control YFP-injected mice; scp, superior cerebellar peduncle; dl, dorsolateral; el, external lateral; scale bar 100 µm. (c) Chronic OxtrPBN inactivation does not significantly alter baseline saline preference at different concentrations (0.075, 0.3, 0.5 M) (n = 6 TetTox, 7 YFP; unpaired 2-tailed Student’s t-test; 0.075 M NaCl: t(11) = 0.4967; p = 0.6292; 0.3 M NaCl: t(11) = 1.005; p = 0.3364; 0.5 M NaCl: t(11) = 0.09961; p = 0.9224), and does not significantly change fluid intake following normal saline ip, either (d) acutely (n = 6 TetTox, 7 YFP; 2-way RM ANOVA; NaCl: interaction F(8,88) = 0.7729; p = 0.6275; water: interaction F(8,88) = 0.4721; p = 0.8728) or (e) overnight (n = 6 TetTox, 7 YFP; unpaired 2-tailed Student’s t-test; NaCl: t(11) = 0.8014; p = 0.4398; water: t(11) = 0.6858; p = 0.5070). (f) Overnight NaCl intake remained significantly increased in TetTox-injected mice (n = 6 TetTox, 7 YFP; unpaired 2-tailed Student’s t-test; NaCl: t(11) = 2.760; p = 0.0186; water: t(11) = 0.8881; p = 0.3935). Chronic OxtrPBN inactivation does not significantly change fluid intake following (g) 1 M mannitol ip (n = 6 TetTox; 7 YFP; 2-way RM ANOVA; NaCl: interaction F(4,44) = 0.4638; p = 0.7619; water: interaction F(4,44) = 1.524; p = 0.2118) or (h) 30% PEG sc (n = 6 TetTox; 7 YFP; 2-way RM ANOVA; NaCl: interaction F(4,44) = 1.494; p = 0.2203; water: interaction F(4,44) = 0.3461; p = 0.8453). (i) There was no significant correlation between the level of GFP:TetTox expression and the amount of fluid intake after 24-h dehydration (n = 6; Pearson product-moment correlation; NaCl: r = 0.3167; p = 0.5408; water: r = 0.4335; p = 0.3905). Data are expressed as mean ± s.e.m. *p < 0.05. See Supplementary Information for statistical analyses
We also investigated acute inhibition of OxtrPBN neurons by injecting AAV carrying a Cre-dependent hM4Di:mCherry transgene (AAV1-DIO-hM4Di:mCherry)20 bilaterally into the PBN (Fig. 3e and Supplementary Fig. 5a,b), and observed increased NaCl intake after CNO injection in hM4Di-injected mice relative to controls at the start of the dark cycle (Fig. 3f). There was increased fluid intake (NaCl and water) after 24-h fluid deprivation, but the effect was less robust than that observed for TetTox-injected mice (Supplementary Fig. 5c). There was no difference in fluid intake during the light cycle, suggesting that acute OxtrPBN inhibition does not spontaneously induce drinking, and there was no difference in feeding (Supplementary Fig. 5d,e). Following experimentation, we examined the extent of hM4Di expression, but observed no significant correlation of expression with fluid intake (for NaCl, P = 0.2208; for water, P = 0.2013; Supplementary Fig. 5f).
Supplementary Figure 5. Acute OxtrPBN neuron inhibition increases fluid intake after dehydration, but does not affect baseline food or fluid intake.

(a) Injection of AAV-DIO-hM4Di:mCherry in OxtrPBN neurons. (b) Representative images of hM4Di and mCherry expression in OxtrPBN neurons; scp, superior cerebellar peduncle; dl, dorsolateral; el, external lateral; scale bar 100 µm. (c) Acute OxtrPBN inhibition increases NaCl and water intake following 24-h dehydration (n = 5 hM4Di, 6 mCherry; 2-way RM ANOVA; NaCl: interaction F(8,72) = 2.962; p = 0.0064; water: interaction F(8,72) = 2.289; p = 0.0304), but (d) does not significantly alter fluid intake at baseline during the light cycle (n = 5 hM4Di, 6 mCherry; 2-way RM ANOVA; NaCl: interaction F(8,72) = 0.1264; p = 0.9979; water: interaction F(8,72) = 0.6017; p = 0.7734). (e) OxtrPBN inhibition does not significantly alter food intake during the dark or light cycle (n = 5 hM4Di, 6 mCherry; 2-way RM ANOVA; baseline food: interaction F(8,72) = 0.2429; p = 0.9811; post 24-h fast: interaction F(8,72) = 1.040; p = 0.4510). (f) There was no significant correlation between the level of hM4Di:mCherry expression and the amount of fluid intake after 24-h dehydration (n = 5; Pearson product-moment correlation; NaCl: r = 0.6649; p = 0.2208; water: r = −0.6857; p = 0.2013). Data are expressed as mean ± s.e.m. **p < 0.01; *p < 0.05. See Supplementary Information for statistical analyses
OxtrPBN neurons are activated under physiological conditions following fluid satiation and hypertonic saline
To assess whether OxtrPBN neurons are involved in fluid and salt intake under physiological conditions, we examined Fos expression in OxtrPBN neurons of Oxtr Cre/+::Ai14 mice following 48-h salt depletion or 24-h fluid deprivation. We observed significantly increased Fos expression in caudal OxtrPBN neurons when NaCl and/or water were returned compared with control mice or mice that remained salt or water deprived, suggesting that OxtrPBN neurons are activated following fluid satiation (Fig. 4a–e). There were no substantial differences in Fos expression in mid- and rostral-PBN populations, revealing differential activation throughout the PBN (Supplementary Fig. 6a–d). We also examined Fos expression under hypernatremic conditions by injecting 1 M NaCl ip into Oxtr Cre/+::Ai14 mice. This treatment increased Fos expression in caudal OxtrPBN neurons compared with 0.15 M NaCl (normal saline) injection (Fig. 4a,f,g and Supplementary Fig. 6e,f).
Fig. 4. OxtrPBN neurons are activated physiologically by fluid and salt satiation and by hypertonic saline.
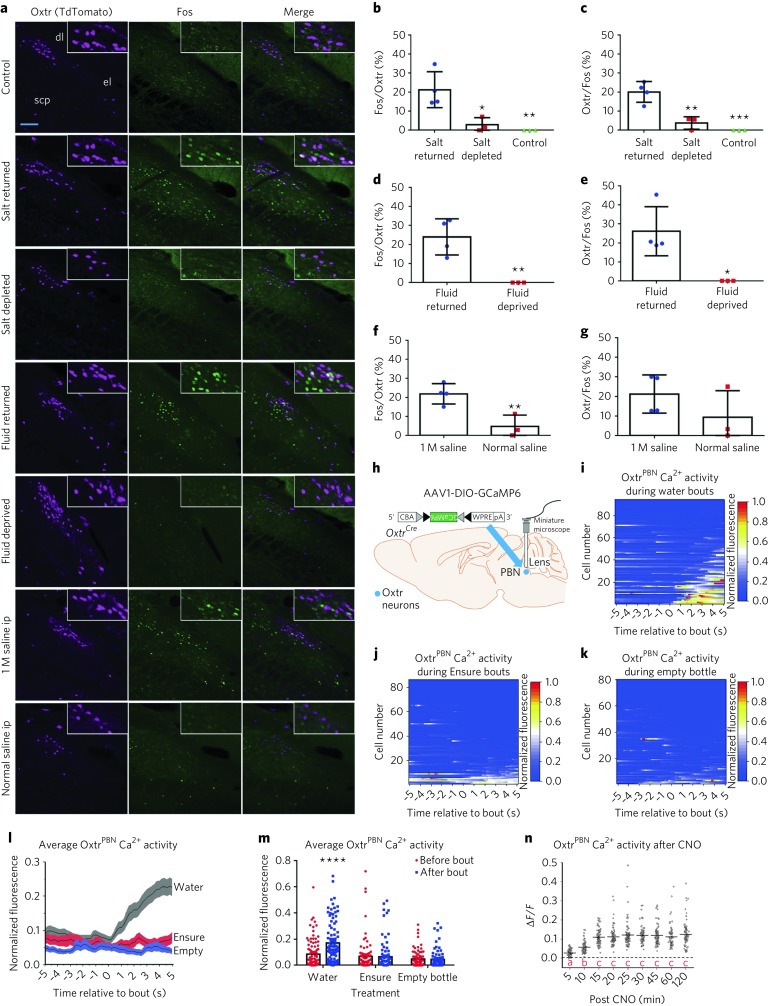
a, Representative histological sections of Fos expression in Oxtr Cre/+::Ai14 mice in caudal PBN from control, salt-returned, salt-depleted, fluid-returned, fluid-deprived, 1 M saline-injected and normal-saline-injected mice. Scale bar represents 100 µm. b–g Quantification of caudal OxtrPBN coexpression of Fos and Oxtr in salt-depletion experiments (n = 4 salt returned, 4 salt depleted, 3 control; one-way ANOVA; Fos/Oxtr: interaction F(2,7) = 11.41, P = 0.0063; Oxtr/Fos: interaction F(2,7) = 26.02, P = 0.0006) (b,c); fluid-deprivation experiments (n = 4 fluid returned, 3 fluid deprived; unpaired two-tailed Student’s t test; Fos/Oxtr: t(5) = 4.285, P = 0.0078; Oxtr/Fos: t(5) = 3.430, P = 0.0186) (d,e); and hypertonic saline injected experiments (n = 4 for 1 M saline, 3 normal saline; unpaired two-tailed Student’s t test; Fos/Oxtr: t(5) = 4.033, P = 0.0100; Oxtr/Fos: t(5) = 1.353, P = 0.2341) (f,g). h, Injection of AAV-DIO-GCaMP6 in OxtrPBN neurons. Gray and black triangles denote loxP and lox2722 sites, respectively. i, Raster plot of normalized fluorescent Ca2+ activity during water bouts for each OxtrPBN neuron (n = 94 neurons in 3 mice). j, Raster plot of normalized fluorescent Ca2+ activity during Ensure bouts for each OxtrPBN neuron (n = 85 neurons in 3 mice). k, Raster plot of normalized fluorescent Ca2+ activity during bouts with an empty bottle for each OxtrPBN neuron (n = 80 neurons in 3 mice). l, Average OxtrPBN fluorescent Ca2+ activity for water, Ensure and empty bottle. m, Average OxtrPBN fluorescent Ca2+ activity comparing before bout versus after bout (two-way RM ANOVA: interaction F(2, 257) = 17.01, P < 0.0001). n, OxtrPBN fluorescent Ca2+ activity following injection of CNO ip; ΔF/F = F – F 0/F 0 (n = 83 neurons in 2 mice; one-way RM ANOVA: interaction F(8,656) = 134.7, P < 0.0001; different letters denote significant difference from other columns). Data are expressed as mean ± s.e.m. ****P < 0.0001; ***P < 0.001; **P < 0.01; *P < 0.05. See Supplementary Table 2 for statistical analyses.
Supplementary Figure 6. OxtrPBN neurons in mid and rostral PBN show no significant difference in Fos expression.

a,c,e, Quantification of mid OxtrPBN co-expression of Fos and Oxtr in (a) salt depletion (n = 4 salt returned, 4 salt depleted, 3 control; 1-way ANOVA; Fos/Oxtr: interaction F(2,7) = 2.727; p = 0.1331; Oxtr/Fos: interaction F(2,7) = 0.3097; p = 0.7432), (c) fluid deprivation (n = 4 fluid returned, 3 fluid deprived; unpaired 2-tailed Student’s t-test; Fos/Oxtr: t(5) = 1.335; p = 0.2394; Oxtr/Fos: t(5) = 0.4049; p = 0.7023) and (e) and hypertonic saline experiments (n = 4 for 1 M saline, 3 normal saline; unpaired 2-tailed Student’s t-test; Fos/Oxtr: t(5) = 0.5084; p = 0.6328; Oxtr/Fos: t(5) = 1.319; p = 0.2444). b,d,f, Quantification of rostral OxtrPBN co-expression of Fos and Oxtr in (b) salt depletion (n = 4 salt returned, 4 salt depleted, 3 control; 1-way ANOVA; Fos/Oxtr: interaction F(2,7) = 2.008; p = 0.2046; Oxtr/Fos: interaction F(2,7) = 1.582; p = 0.2711), (d) fluid deprivation (n = 4 fluid returned, 3 fluid deprived; unpaired 2-tailed Student’s t-test; Fos/Oxtr: t(5) = 0.5977; p = 0.5761; Oxtr/Fos: t(5) = 0.3396; p = 0.7479) and (f) and hypertonic saline (n = 4 for 1 M saline, 3 normal saline; unpaired 2-tailed Student’s t-test; Fos/Oxtr: t(5) = 1.716; p = 0.1469; Oxtr/Fos: t(5) = 2.300; p = 0.0698). Data are expressed as mean ± s.e.m. See Supplementary Information for statistical analyses
We assessed real-time OxtrPBN neuron activity by injecting AAV1-DIO-GCaMP6m into the PBN of Oxtr Cre/+ mice and measured calcium fluorescence after returning water to water-deprived mice (Fig. 4h and Supplementary Videos 1 and 2). We observed low fluorescence in OxtrPBN neurons during dehydration, which remained low when the water spout was returned; however, we observed a rapid rise in Ca2+ fluorescence when mice began drinking, which decreased between bouts (Fig. 4i,l,m). This pattern was observed in ~52% of OxtrPBN neurons during water intake, but not during Ensure intake or when given an empty bottle, suggesting that OxtrPBN neurons respond to noncaloric fluid ingestion, but not liquid diet or motor movements associated with licking (Fig. 4i–m). We co-injected AAV-DIO-hM3Dq:mCherry into two mice and observed increased calcium fluorescence within 5 min that peaked at ~15 min and lasted at least 2 h, corresponding to the time at which we observed substantial fluid inhibition behaviorally (Fig. 4n and Supplementary Video 3).
CGRPPBN neurons have minimal overlap with OxtrPBN neurons and decrease both food and fluid intake
We compared the expression pattern of neurons expressing Oxtr or calcitonin-gene-related peptide (CGRP, which is encoded by Calca gene) in the PBN. CGRPPBN-neuron stimulation is known to decrease feeding and mediate many aversive responses15,24. We observed minimal coexpression of Oxtr and CGRP in PBN neurons (6 ± 2%; Fig. 5a).
Fig. 5. CGRPPBN neuron activation decreases fluid and salt intake.
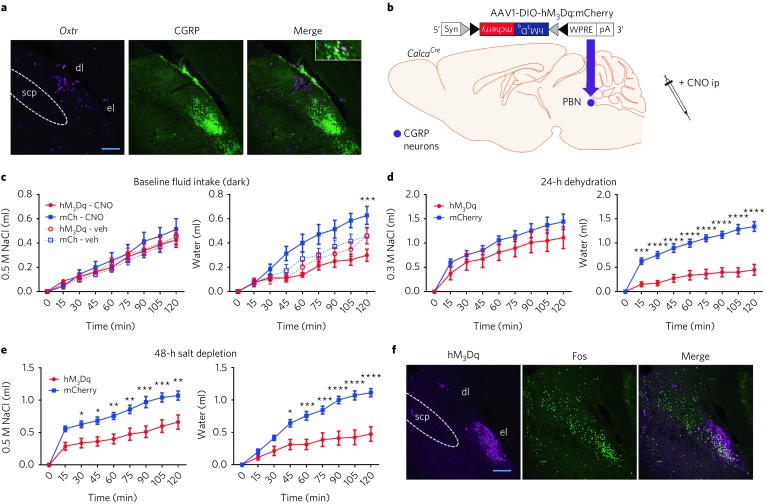
a, Minimal colocalization of Oxtr and CGRP in the PBN. Scale bar represents 200 µm (n = 3). b, Injection of AAV-DIO-hM3Dq:mCherry in CGRPPBN neurons. c–e Acute CGRPPBN activation with CNO produces a significant decrease in water consumption at baseline (n = 8 hM3Dq, 7 mCherry; three-way mixed design ANOVA; NaCl: interaction F(1.876,24.391) = 0.921, P = 0.406; water: interaction F(2.629,34.177) = 3.768, P = 0.023) (c) and after 24-h dehydration (n = 8 hM3Dq, 7 mCherry; two-way RM ANOVA; NaCl: interaction F(8,104) = 0.07589, P = 0.6395; water: interaction F(8,104) = 22.22, P < 0.0001) (d), and decreased NaCl and water consumption after 48-h salt depletion (n = 8 hM3Dq, 7 mCherry; two-way RM ANOVA; NaCl: interaction F(8,104) = 5.789, P < 0.0001; water: interaction F(8,104) = 14.01, P < 0.0001) (e). f, Following CNO, Fos is robustly expressed in external lateral CGRPPBN neurons and in dorsolateral PBN in hM3Dq-injected mice. Scale bar represents 200 µm. Data expressed as mean ± s.e.m. ****P < 0.0001; ***P < 0.001; **P < 0.01; *P < 0.05. See Supplementary Table 2 for statistical analyses.
We investigated the effect of CGRPPBN activation on fluid intake by injecting AAV1-DIO-hM3Dq:mCherry into the PBN of Calca Cre/+ mice (Fig. 5b). CGRPPBN activation with CNO decreased water, but not NaCl, intake at the start of the dark cycle (Fig. 5c) and after 24-h dehydration (Fig. 5d). Total fluid intake (combined water and NaCl) after 24-h dehydration was ~56% of that of control mice, whereas OxtrPBN stimulation resulted in a total fluid intake of ~29% of that of control mice (Fig. 1f and Supplementary Table 1). After 48-h salt depletion, CGRPPBN activation decreased both NaCl and water intake (Fig. 5e). Overall, these results suggest that CGRPPBN stimulation inhibits all ingestive behaviors (food, fluid and salt), but is less effective than OxtrPBN stimulation in decreasing fluid intake. We injected CNO 2 h before perfusion and observed Fos expression in 67 ± 7% of the hM3Dq-expressing neurons, as well as in non-hM3Dq expressing neurons in the dorsolateral PBN, suggesting that CGRPPBN neurons might activate dorsolateral PBN neurons (Fig. 5f).
OxtrPBN neurons project to brain regions involved in fluid regulation
To investigate downstream projections of OxtrPBN neurons, we injected AAV1-DIO-synaptophysin:mCherry into the PBN of Oxtr Cre/+ mice, which revealed prominent projections to the central nucleus of the amygdala, bed nucleus of the stria terminalis, organum vasculosum of the lamina terminalis (OVLT), anteroventral periventricular nucleus (AVPV) and median preoptic nucleus (MnPO) (Fig. 6a,b), and less prominent projections to other brain regions (Supplementary Fig. 7a,b). Many of these regions are activated following excessive fluid intake25,26. By comparison, CGRPPBN neurons do not project to the OVLT, AVPV or MnPO15, which are more selectively involved in regulating fluid intake9,27.
Fig. 6. Upstream and downstream projections of OxtrPBN neurons.
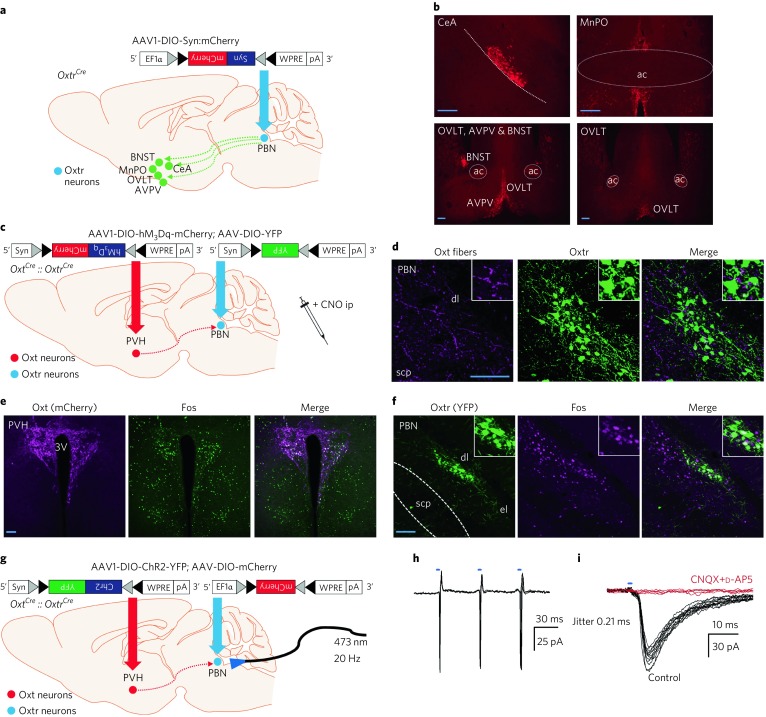
a,b, Injection of AAV-DIO-synaptophysin:mCherry in OxtrPBN neurons demonstrates downstream projections in central nucleus of amygdala (CeA), bed nucleus of stria terminalis (BNST), organum vasculosum of lamina terminalis (OVLT), anteroventral periventricular (AVPV) and median preoptic nuclei (MnPO) (n = 2) (b). ac, anterior commissure. Scale bars represent 200 µm. c, Injection of AAV-DIO-hM3Dq:mCherry in OxtPVH neurons and AAV-DIO-YFP into OxtrPBN neurons. d, Projections of OxtPVH fibers to OxtrPBN neurons. Scale bar represents 100 µm. e,f, Chemogenetic activation of OxtPVH neurons increases Fos in OxtPVH neurons (e) and OxtrPBN neurons (f). 3V, third ventricle. Scale bar represents 100 µm (n = 3). g, Injection of AAV-DIO-ChR2:YFP in OxtPVH neurons and AAV-DIO-mCherry into OxtrPBN neurons. h, Action potentials evoked by 5-ms blue LED pulses at 20 Hz in an OxtrPBN neurons in cell-attached configuration (three sweeps) (n = 5/23 OxtrPBN neurons). i, Synaptic currents evoked by 2-ms LED pulses in voltage-clamped OxtrPBN neuron at –70 mV. 12 consecutive sweeps are shown, and they reveal a brief synaptic delay and sub-millisecond jitter (control). These EPSCs were inhibited in the presence of 20 μM CNQX and 50 μM d-AP5, antagonists of AMPA and NMDA glutamate receptors (red, five sweeps). The currents were recorded in the presence of 100 μM picrotoxin (n = 4 of 13 OxtrPBN neurons).
Supplementary Figure 7. Downstream and upstream projections of OxtrPBN neurons.

(a) Injection of AAV-DIO-synaptophysin:mCherry in OxtrPBN neurons demonstrates less prominent downstream projections to (b) the nucleus of the solitary tract (NTS), lateral posterior thalamus, periventricular hypothalamus, tuberal nucleus, paraventricular nucleus of the hypothalamus (PVH) and supraoptic nucleus (SON); (n = 2) scale bar, 200 µm. (c) Percentage Fos in caudal, mid and rostral OxtrPBN neurons in Oxt Cre/+ ::Oxtr Cre/+ mice injected with hM3Dq or mCherry in PVH (n = 3/group; unpaired 2-tailed Student’s t-test; caudal: t(4) = 4.385; p = 0.0118; mid: t(4) = 1.807; p = 0.1451; rostral: t(4) = 2.278; p = 0.0850). (d) Injection of AAV1-DIO-synaptophysin:mCherry in PVH of Oxtr Cre/+ mice demonstrates no visible projections in PBN (n = 3); 3V, third ventricle; thal, thalamic nuclei; scp, superior cerebellar peduncle; dl, dorsolateral PBN; el, external lateral PBN; scale bar, 100 µm. (e) Injection of AAV-DIO-hM3Dq into the PVH and AAV-DIO-YFP into the PBN of Oxtr Cre/+ mice. (f) Following CNO, Fos is robustly expressed in the PVH and thalamus, but (g) there was minimal expression in the PBN (n = 3). (h) Representative live image of the lateral PBN prior to electrophysiological recordings demonstrating OxtPVH fibers and OxtrPBN neurons; scale bar, 200 μm. (i) Acute OxtPVH stimulation decreases water intake following 1 M mannitol ip (n = 7 hM3Dq, 8 mCherry; 2-way RM ANOVA; NaCl: interaction F(4,52) = 0.6187; p = 0.6512; water: interaction F(4,52) = 4.120; p = 0.0057), but (j) does not significantly alter fluid intake following 48-h salt appetite (n = 7 hM3Dq, 8 mCherry; 2-way RM ANOVA; NaCl: interaction F(8,104) = 1.056; p = 0.3999; water: interaction F(8,104) = 0.6962; p = 0.6941) or (k) 30% PEG sc (n = 7 hM3Dq, 8 mCherry; 2-way RM ANOVA; NaCl: interaction F(4,52) = 0.3265; p = 0.8589; water: interaction F(4,52) = 0.5231; p = 0.7191), or (l) food intake at baseline or after a 24-h fast (n = 7 hM3Dq, 8 mCherry; 2-way RM ANOVA; baseline food: interaction F(8,104) = 0.3734; p = 0.9325; post 24-h fast: interaction F(8,104) = 0.2928; p = 0.9670). (m) Percentage Fos in OxtPVH neurons in hM3Dq-injected vs mCherry-injected Oxt Cre/+ mice (n = 7 hM3Dq, 8 mCherry; unpaired 2-tailed Student’s t-test; t(13) = 12.50; p < 0.0001). Data are expressed as mean ± s.e.m. ****p < 0.0001; *p < 0.05. See Supplementary Information for statistical analyses
OxtrPBN neurons receive projections from OxtPVH neurons
Because OxtrPBN activation suppressed fluid intake, we investigated the effect of PVH oxytocin-expressing neurons (OxtPVH) on fluid intake1,28. We confirmed projections from OxtPVH to OxtrPBN neurons by injecting AAV1-DIO-hM3Dq:mCherry into the PVH and AAV-DIO-YFP into the PBN of Oxt Cre+/+ ::Oxtr Cre/+ mice, which revealed mCherry-positive axon fibers in the PBN (Fig. 6c,d). After CNO injection, Fos expression increased in both OxtPVH and OxtrPBN neurons, primarily in the caudal OxtrPBN neurons (20 ± 4%; Fig. 6e,f and Supplementary Fig. 7c). To ensure that the mCherry-positive axons were arising from OxtPVH and not OxtrPVH neurons, we injected AAV1-DIO-synaptophysin:mCherry into the PVH of Oxtr Cre/+ mice and observed no visible fibers in the PBN (Supplementary Fig. 7d). We also injected AAV-DIO-hM3Dq:mCherry into the PVH and AAV-DIO-YFP into the PBN of Oxtr Cre/+ mice and observed minimal Fos expression in OxtrPBN neurons after CNO (Supplementary Fig. 7e–g).
To ascertain whether OxtPVH neurons can directly activate OxtrPBN neurons, we injected AAV1-DIO-ChR2:YFP into the PVH and AAV-DIO-mCherry into the PBN of Oxt Cre+/+ ::Oxtr Cre/+ mice. Photoactivation (20 Hz) of OxtPVH axon terminals in the PBN resulted in spiking in 22% (5 of 23) of OxtrPBN neurons. In a separate experiment, 4 of 13 OxtrPBN neurons responded to photostimulation of OxtPVH fibers in PBN slices with evoked excitatory postsynaptic currents (EPSCs) of short synaptic latency (3.5–5 ms) and sub-millisecond jitter (0.26 ± 0.024 ms), which is indicative of monosynaptic innervation. EPSCs were suppressed by inhibitors of AMPA and NMDA receptors, implicating glutamate as a neurotransmitter (Fig. 6g–i and Supplementary Fig. 7h).
Activation of OxtPVH neurons attenuates fluid intake
To assess the effect of OxtPVH activation on fluid intake, we injected AAV1-DIO-hM3Dq:mCherry bilaterally into the PVH of Oxt Cre/+ mice (Fig. 7a). OxtPVH stimulation did not significantly attenuate baseline NaCl or water intake following CNO or vehicle injection in hM3Dq-injected or control mice (Fig. 7b); however, OxtPVH stimulation did attenuate water intake following 24-h fluid deprivation and osmolarity-induced thirst (hypertonic saline and mannitol) (Fig. 7c,d and Supplementary Fig. 7i), but not following salt depletion or volume depletion (PEG) (Supplementary Fig. 7j,k). These results suggest that OxtPVH stimulation attenuates fluid intake, but does so less robustly than OxtrPBN stimulation. As previously reported, there was no significant difference in feeding at baseline (P = 0.9325) or after fasting (P = 0.9670)29 (Supplementary Fig. 7l). Following CNO, we observed Fos expression in 64 ± 5% of hM3Dq-expressing OxtPVH neurons (Supplementary Fig. 7m).
Fig. 7. OxtPVH neuron activation attenuates water consumption.
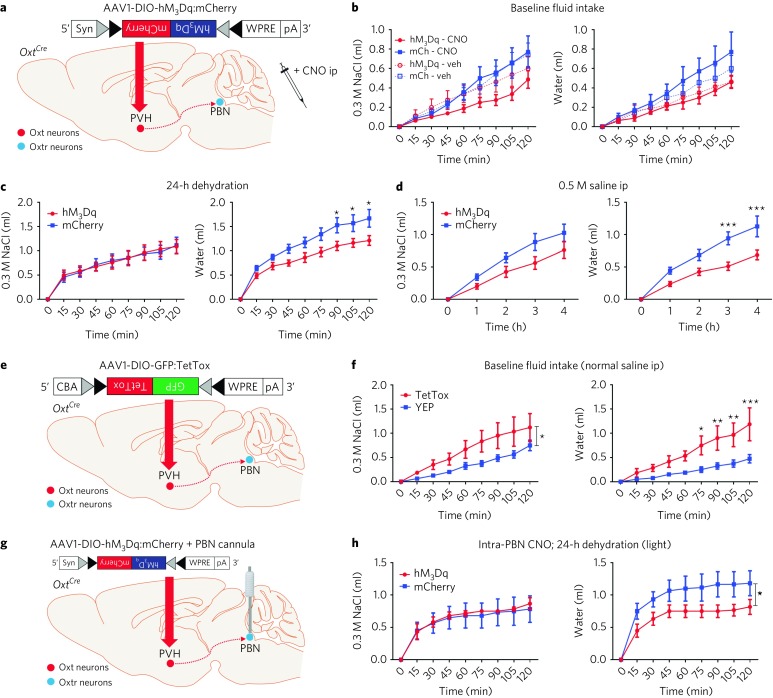
a, Injection of AAV-DIO-hM3Dq:mCherry in OxtPVH neurons. b–d, Acute OxtPVH activation revealed no significant change in NaCl or water consumption at baseline (n = 8 hM3Dq, 7 mCherry; three-way mixed design ANOVA; NaCl: interaction F(1.749,22.735) = 0.748, P = 0.468; water: interaction F(2.480,32.236) = 1.250, P = 0.305) (b), but water consumption was decreased after 24-h dehydration (n = 8 hM3Dq, 7 mCherry; two-way RM ANOVA; NaCl: interaction F(8,104) = 0.1871, P = 0.9922; water: interaction F(8,104) = 3.456, P = 0.0014) (c) and after 0.5 M saline ip (n = 8 hM3Dq, 7 mCherry; two-way RM ANOVA; NaCl: interaction F(4,52) = 2.052, P = 0.1007; water: interaction F(4,52) = 5.763, P = 0.0006) (d). e, Injection of AAV-DIO-GFP:TetTox in OxtPVH neurons. f, Chronic inactivation of OxtPVH neurons increased NaCl and water consumption after vehicle injection (n = 6 TetTox, 8 YFP; two-way RM ANOVA; NaCl: interaction F(8,96) = 2.046, P = 0.0489; water: interaction F(8,96) = 5.036, P < 0.0001). g, Injection of AAV-DIO-hM3Dq:mCherry in OxtPVH neurons and bilateral cannula implantation into PBN. h, Infusion of CNO into PBN decreased water consumption after 24-h dehydration (n = 6 per group; two-way RM ANOVA; NaCl: interaction F(8,80) = 0.1334, P = 0.9975; water: interaction F(8,80) = 2.108, P = 0.0444). Data are expressed as mean ± s.e.m. ***P < 0.001; **P < 0.01; *P < 0.05. See Supplementary Table 2 for statistical analyses.
We also inactivated OxtPVH neurons by injecting AAV1-DIO-GFP:TetTox bilaterally to test whether these neurons have a physiological role in fluid intake similar to that of OxtrPBN neurons (Fig. 7e and Supplementary Fig. 8a,b). OxtPVH inactivation revealed no substantial difference in 24-h baseline saline preference (Supplementary Fig. 8c); however, TetTox-injected mice increased fluid intake, particularly water intake, following vehicle injection at the start of the dark cycle and during several other tests of fluid intake (Fig. 7f and Supplementary Fig. 8d–h), suggesting that OxtPVH neurons have a role in reducing water intake under physiological conditions.
Supplementary Figure 8. Chronic OxtPVH inactivation increases water intake following dehydration, salt depletion, mannitol and PEG.

(a) Injection of AAV-DIO-GFP:TetTox in OxtPVH neurons. (b), Representative images of GFP expression in OxtPVH neurons in GFP:TetTox- vs control YFP-injected mice; 3V, third ventricle; (n = 6 TetTox, 8 YFP) scale bar 100 µm. (c) Chronic OxtPVH inactivation does not significantly alter baseline saline preference at different concentrations (0.075, 0.3, 0.5 M) (n = 6 TetTox, 8 YFP; unpaired 2-tailed Student’s t-test; 0.075 M NaCl: interaction t(12) = 0.2346; p = 0.8184; 0.3 M NaCl: interaction t(12) = 0.2509; p = 0.8061; 0.5 M NaCl: interaction t(12) = 0.6848; p = 0.5065), but (d) but significantly increases water following 24-h dehydration (n = 6 TetTox, 8 YFP; 2-way RM ANOVA; NaCl: interaction F(8,96) = 1.098; p = 0.3712; water: interaction F(8,96) = 4.073; p = 0.0003), (e) 48-h salt depletion (n = 6 TetTox, 8 YFP; 2-way RM ANOVA; NaCl: interaction F(8,96) = 0.7341; p = 0.6612; water: interaction F(8,96) = 6.866; p < 0.0001), (f) demonstrates a trend to increase water following 0.5 M saline ip (n = 6 TetTox, 8 YFP; 2-way RM ANOVA; NaCl: interaction F(4,48) = 0.1292; p = 0.9711; water: interaction F(4,48) = 2.183; p = 0.0850), and (g) increases water following 1 M mannitol ip (n = 6 TetTox, 8 YFP; 2-way RM ANOVA; NaCl: interaction F(4,48) = 0.8378; p = 0.5080; water: interaction F(4,48) = 3.628; p = 0.0116), and (h) and 30% PEG sc (n = 6 TetTox, 8 YFP; 2-way RM ANOVA; NaCl: interaction F(4,48) = 1.296; p = 0.2848; water: interaction F(4,48) = 3.617; p = 0.0118). Data are expressed as mean ± s.e.m. ****p < 0.0001; **p < 0.01; *p < 0.05; φ p = 0.085. See Supplementary Information for statistical analyses
To assess the role of PBN projections from OxtPVH neurons, we injected AAV1-DIO-hM3Dq:mCherry or AAV-DIO-mCherry bilaterally into the PVH of Oxt Cre/+ mice and implanted a bilateral cannula over the PBN (Fig. 7g and Supplementary Fig. 9a). Intra-PBN infusion of CNO (1 mM; 500 nl bilaterally) during the light cycle following 24-h fluid restriction decreased water intake in the hM3Dq-injected mice compared with controls (Fig. 7h). For comparison, intraperitoneal CNO also decreased water intake following 24-h dehydration in the light cycle (Supplementary Fig. 9b). As with previous cohorts, there was no significant difference in baseline NaCl intake (P = 0.3627) or water intake (P = 0.1763) following CNO or vehicle ip injections at the start of the dark cycle (Supplementary Fig. 9c).
Supplementary Figure 9. Characterization of upstream projections to OxtrPBN neurons.

(a) Injection of AAV-DIO-hM3Dq:mCherry in OxtPVH neurons of Oxt Cre/+ mice and bilateral cannula into PBN. (b) Acute OxtPVH activation by CNO ip decreases 2-h water consumption after 24-h dehydration during the light cycle (n = 6/group; unpaired 2-tailed Student’s t-test; NaCl: interaction t(10) = 0.3017; p = 0.7690; water: interaction t(10) = 2.484; p = 0.0323), but (c) demonstrates no significant change in 2-h NaCl or water consumption at baseline (n = 6/group; 2-way RM ANOVA; NaCl: interaction F(1,10) = 0.9098; p = 0.3627; water: interaction F(1,10) = 2.118; p = 0.1763). (d) Representative histological image demonstrating cannula placement in PBN (n = 6/group). (e) Injection of AAV-DIO-hM3Dq:mCherry in OxtPVH neurons and AAV-DIO-YFP in OxtrPBN neurons of Oxt Cre/+ ::Oxtr Cre/+ mice and bilateral cannula into PBN. (f) Following intra-PBN CNO, we saw some Fos expression in OxtPVH neurons, (g) in OxtrPBN neurons, and (h) some scattered Fos in the NTS (n = 3). (i) Injection of AAV-hM3Dq:mCherry in NTS and AAV-DIO-YFP in OxtrPBN neurons of Oxtr Cre/+ mice. (j) Following CNO ip, we observed robust Fos expression in hM3Dq-expressing NTS neurons (n = 6) and (k) minimal Fos expression in control DsRed-expressing NTS neurons (n = 5). (l) Injection of AAV-DIO-hM3Dq:mCherry in CCKNTS neurons of Cck Cre/+ mice. m,n, Following CNO ip, we observed Fos in the (m) NTS and (n) PBN of hM3Dq-injected mice (n = 5 hM3Dq, 4 mCherry). Data are expressed as mean ± s.e.m. dl, dorsolateral PBN; el, external lateral PBN; scp, superior cerebellar peduncle. *p < 0.05. Scale bars, 100 μm. See Supplementary Information for statistical analyses
Following experimentation, we confirmed targeting and cannula placement (Supplementary Fig. 9d). To validate that delivery of CNO to the PBN activates OxtrPBN neurons, we injected Oxt Cre/+ ::Oxtr Cre/+ mice with AAV1-DIO-hM3Dq:mCherry in the PVH, AAV1-DIO-YFP in the PBN and a bilateral cannula over the PBN (Supplementary Fig. 9e). When mice were infused with CNO 2 h before perfusion, Fos was induced in 22 ± 2% OxtrPBN neurons (Supplementary Fig. 9g), suggesting that the effect may be mediated either by projections of OxtPVH to OxtrPBN neurons or by antidromic activation to OxtPVH cell bodies, which then activate axon collaterals projecting to other brain regions30. We observed Fos expression in 26 ± 8% of OxtPVH neurons (Supplementary Fig. 9f), but only scattered, low-level Fos expression in the nucleus of the solitary tract (NTS) region, which receives projections from the PVH31 (Supplementary Fig. 9h). These data suggest that activation of OxtPVH projections to OxtrPBN neurons provides a small attenuation of fluid intake, indicating that other neuronal inputs to OxtrPBN neurons are required for more robust fluid suppression.
NTS neurons also suppress fluid intake and activate OxtrPBN neurons
Previous research has suggested that the NTS and the adjacent area postrema modulate fluid intake and provide substantial input to the PBN9,11. To investigate the effect of the medial NTS on fluid intake, we injected nonselective AAV-hM3Dq:mCherry or control nonselective AAV-DsRed into the NTS of Oxtr Cre/+ mice and AAV-DIO-YFP into the PBN to fluorescently label OxtrPBN neurons (Fig. 8a and Supplementary Fig. 9i). Following 24-h dehydration, we activated NTS neurons with CNO and observed a large decrease in fluid (water and NaCl) and food intake in hM3Dq-injected mice relative to controls (Fig. 8b,c). Mice did not display overt signs of distress or impaired movement. We injected CNO 2 h before perfusion and observed robust Fos expression in hM3Dq-expressing NTS neurons (Supplementary Fig. 9j,k) and in 33 ± 6% of OxtrPBN neurons and other neurons in the dorsolateral and external lateral rostral PBN (Fig. 8d).
Fig. 8. Activation of NTS or CCKNTS neurons decreases fluid intake and activates OxtrPBN neurons.
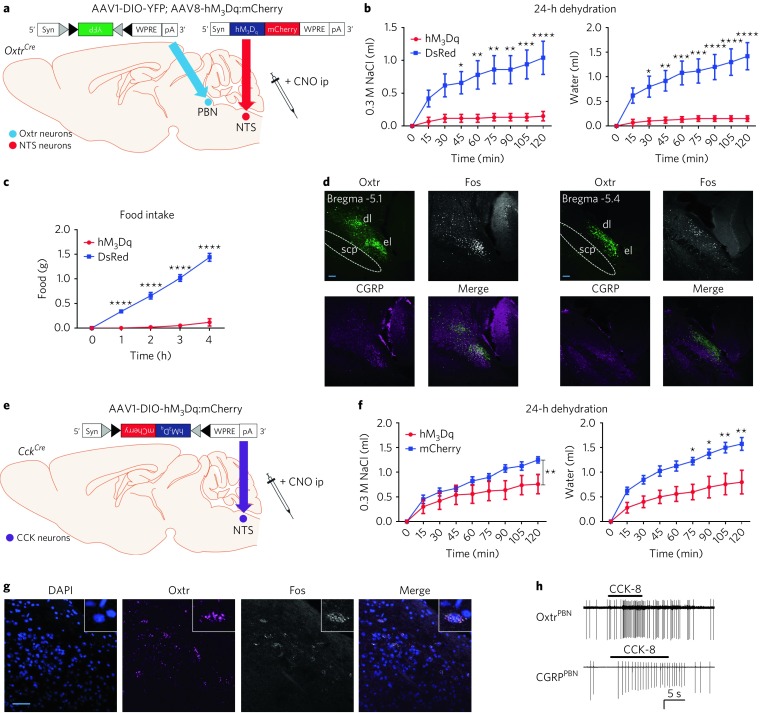
a, Injection of AAV-hM3Dq:mCherry in NTS and AAV-DIO-YFP in OxtrPBN neurons. b,c, After 24-h dehydration, NTS activation suppressed NaCl and water consumption (n = 6 hM3Dq, 5 DsRed; two-way RM ANOVA; NaCl: interaction F(8,72) = 11.88, P < 0.0001; water: interaction F(8,72) = 17.94, P < 0.0001) (b), as well as food intake (n = 6 hM3Dq, 5 DsRed; two-way RM ANOVA; interaction: F(4,36) = 91.69, P < 0.0001) (c). d, Following CNO administration, Fos was robustly expressed in external lateral and dorsolateral PBN in hM3Dq-injected mice in caudal and rostral PBN. Scale bar represents 100 µm. e, Injection of AAV-hM3Dq:mCherry in CCKNTS neurons. f, After 24-h dehydration, CCKNTS activation decreased NaCl and water consumption (n = 5 hM3Dq, 4 mCherry; two-way RM ANOVA; NaCl: interaction F(8,56) = 3.047, P = 0.0065; water: interaction F(8,56) = 5.693, P < 0.0001). g, RNAscope in situ hybridization image from Cck Cre/+ mice demonstrating coexpression of Oxtr mRNA and Fos mRNA in PBN (n = 3). Scale bar represents 200 µm. h, CCK-8 (30 nM, horizontal bars) increases firing rate in 40% (2 of 5) of OxtrPBN and 57% (4 of 7) of CGRPPBN neurons. Amplitude scale is 50 pA and 100 pA for top and bottom traces, respectively. Data are expressed as mean ± s.e.m. ****P < 0.0001; ***P < 0.001; **P < 0.01; *P < 0.05. See Supplementary Table 2 for statistical analyses.
Previous studies have identified cholecystokinin (CCK) as a neuropeptide that decreases fluid intake following infusion into the PBN32. CCK is expressed in NTS neurons (CCKNTS) that project to the PBN and decrease food intake by directly activating CGRPPBN neurons33. We investigated whether CCKNTS neurons also decrease fluid intake by bilaterally injecting AAV1-DIO-hM3Dq:mCherry into the NTS of Cck Cre/+ mice (Fig. 8e and Supplementary Fig. 9l). Following 24-h dehydration, hM3Dq-injected mice significantly decreased both NaCl and water intake (Fig. 8f). This decrease was not as robust as that evoked by OxtrPBN stimulation, but was larger than that evoked by CGRPPBN stimulation (Supplementary Table 1), suggesting that it is not merely mediated via CCKNTS projections to CGRPPBN neurons. We observed Fos expression in the NTS and in both the dorsolateral and external lateral PBN regions (Supplementary Fig. 9m,n). To investigate whether OxtrPBN neurons were specifically activated, we performed in situ hybridization for Fos and Oxtr mRNA in hM3Dq-injected mice and found that 19 ± 2% of OxtrPBN neurons expressed Fos (Fig. 8g). We also observed that bath application of a CCK agonist, CCK-8 (30 nM), increased the firing rate in both OxtrPBN and CGRPPBN neurons (Fig. 8h), which is indicative of functional CCK receptors in both PBN populations.
A comparison of 2-h and 4-h fluid intake after stimulating each of the neuronal populations following 24-h dehydration revealed a range of effects on fluid consumption. From largest to smallest, the effects on total fluid intake were nonspecific NTS > OxtrPBN > CCKNTS > CGRPPBN > OxtPVH (Supplementary Table 1). Of these, only OxtrPBN and OxtPVH stimulation selectively decreased noncaloric fluid intake.
Discussion
Our results identify a population of Oxtr-expressing neurons in the PBN that regulate noncaloric fluid intake. These neurons receive direct inputs from hypothalamic OxtPVH neurons, are activated by NTS neurons and project to several forebrain regions (Supplementary Fig. 10a). OxtrPBN neurons are predominantly separate from CGRPPBN neurons, which decrease both food15 and fluid intake (see Fig. 5), suggesting that distinct neuronal populations mediate different aspects of ingestive behaviors.
Supplementary Figure 10. Model of neural circuits that suppress fluid intake.

(a) Model of OxtrPBN neural circuitry illustrating OxtPVH projections to OxtrPBN neurons, likely projections from CCKNTS neurons to OxtrPBN neurons, and major OxtrPBN projections to CeA, BNST, OVLT, AVPV and MnPO. (b) OxtrPBN neurons are proposed to decrease or prevent hypernatremia ± hypervolemia by decreasing NaCl ± water intake. Inputs to OxtrPBN neurons arise from OxtPVH and NTS neurons. NTS neurons receive signals about volume and osmolarity status from peripheral baroceptors and visceral osmoreceptors (and likely from oropharyngeal and upper gastrointestinal receptors); while OxtPVH neurons receive signals from forebrain osmoreceptors and angiotensin II (ANG II). OxtPVH neurons project to PBN and can also release oxytocin peripherally to increase renal NaCl excretion. NTS neurons likely project to both OxtrPBN and CGRPPBN neurons, which can decrease NaCl, water and food intake
Under physiological conditions, we observed increased Fos expression in a subset of OxtrPBN neurons (~20%) after rehydration, suggesting that these neurons are engaged in fluid satiation. Using calcium fluorescence, we observed real-time activity in OxtrPBN neurons, which was low during dehydration and remained low before consumption, suggesting that OxtrPBN neurons do not respond to anticipatory cues, unlike neurons that express agouti-related protein or vasopressin34,35. Drinking water precipitated a rapid rise in OxtrPBN calcium activity, which decreased between bouts, suggesting that these neurons interact with thirst-related neural circuits to adjust the overall level of fluid intake. We observed no difference in calcium activity for Ensure or for an empty bottle. One limitation of our study was that photobleaching of OxtrPBN neurons occurred when the recording was extended, leaving us unable to quantitatively assess overall calcium activity changes over a prolonged period; however, qualitatively, calcium activity appeared to increase over the course of rehydration. We observed that ~52% of OxtrPBN neurons responded to water, as measured by GCaMP florescence, although this is likely to be an underestimate because some neurons with low levels of GCaMP6 expression became photobleached. These results also suggest that Fos reveals only the subset of OxtrPBN neurons with the greatest activity.
Chemogenetic activation of ~72% of OxtrPBN neurons suppressed both NaCl and water intake, but activation of ~20% of caudal OxtrPBN neurons following OxtPVH activation only mildly decreased water intake. Inactivating OxtPVH neurons predominantly increased NaCl intake. Taken together, these results suggest that OxtrPBN neurons provide an overall inhibitory effect on total fluid intake, with the amount of fluid intake and the type of fluid intake (NaCl and/or water) being dependent on the percentage of OxtrPBN neurons that are activated.
Results from inactivation studies suggest that OxtrPBN neurons are necessary for preventing excessive NaCl intake. In the case of dehydration, the body engages physiological mechanisms to reduce NaCl and retain water to prevent hypernatremia—for example, by inducing a dehydration-induced natriuresis36,37. Our results suggest that OxtrPBN neurons are activated following rehydration to prevent excessive NaCl ingestion. In addition, OxtrPBN activation decreased food intake during dehydration, but not after fasting, suggesting that the decrease may be a result of salt (0.25%) in the food rather than its caloric content38. In the case of hypertonic saline injection, hypernatremia is known to increase thirst and water intake9,12,39, as well as to stimulate renal NaCl excretion40. Our results suggest that OxtrPBN activation also decreases NaCl ingestion. Activation and inactivation studies revealed that OxtrPBN neurons did not alter NaCl intake after salt depletion and did not alter food intake except during dehydration, suggesting they are not involved in salt appetite or caloric-containing food consumption. Overall, our results suggest that activation of OxtrPBN neurons is essential for maintaining fluid homeostasis, as they decrease NaCl and/or water intake to prevent or attenuate hypervolemia and/or hypernatremia (Supplementary Fig. 10b).
The hypothalamus is an integrative center of the brain that coordinates responses to maintain homeostatic setpoints41. Whole-cell patch-clamp recordings have revealed increased firing of oxytocin-expressing neurons under hypertonic conditions and decreased firing in response to angiotensin II, which signals hypovolemic conditions42, suggesting that hypothalamic oxytocin-related neurons may be activated predominantly by hypervolemic hypertonic conditions. We expected that activating OxtPVH neurons would decrease NaCl intake; instead, we observed only a mild attenuation of water intake. A possible explanation is that OxtrPBN neurons are already engaged in preventing excessive NaCl intake, and further activation via OxtPVH stimulation provides only a small extra attenuation of total fluid intake. In addition, activating OxtPVH may release peripheral oxytocin and induce renal sodium excretion6–8, which, in conjunction with a mild attenuation of water intake, may decrease ECF volume.
The NTS receives peripheral signals, including baroceptor input, via inputs from cranial nerves IX and X, and is known to suppress fluid intake9,11. We observed that activating NTS neurons, including CCKNTS neurons, substantially reduced fluid intake, suggesting that NTS neurons may provide a large functional input to the PBN to reduce fluid intake. Although we did not demonstrate direct projections to OxtrPBN neurons, we observed Fos expression in ~33% of OxtrPBN neurons after nonspecific activation of the NTS and in ~19% of OxtrPBN neurons after activation of CCK neurons in the NTS, suggesting that OxtrPBN neurons are regulated by several distinct inputs from the NTS.
Overall, our results identify Oxtr as a marker for PBN neurons that are involved in regulating fluid intake. Studying the neural circuitry of fluid satiation may help to increase our understanding of body fluid homeostasis.
Methods
Mice
Experiments were approved by the University of Washington Animal Care and Use Committee and performed in accordance with the US National Institutes of Health Guide for the Care and Use of Laboratory Animals. Mouse lines were bred onto a C57Bl/6 J background and backcrossed >6 generations. The following mouse lines were used in these experiments: heterozygous Oxtr Cre/+ and Calca Cre/+ (developed in our laboratory15); heterozygous Cck Cre/+ and Oxt Cre/+ mice (Jackson Laboratory), and Oxt Cre/+ ::Oxtr Cre/+ mice. The Oxt Cre and Oxtr Cre mice lines were crossed to Cre-dependent Gt(ROSA)26Sor tm14(CAG-tdTomato)Hze/J mice (Allen Institute, Ai14) to reveal expression patterns.
Most behavioral experiments were performed on male mice (7–14 weeks old at start of experimentation). Combined cohorts of male and female mice were used in the following experiments: Fos study in Oxtr Cre/+ mice following fluid deprivation; Oxtr Cre/+ mice injected with non-specific hM3Dq or DsRed in the NTS; behavioral studies on Oxt Cre/+ mice, including Oxt Cre/+ mice implanted with cannulas; and Calca Cre/+ mice. In these experiments, female mice were distributed evenly between experimental and control groups and data were combined, as we found no significant difference in water or saline intake, as previously reported in the literature for rats43.
Animals in each litter were randomly assigned to either experimental or control groups. Before stereotaxic surgery, mice were group housed and maintained on a rodent diet (Picolab, number 5053) with water available ad libitum in a 12-h light:dark cycle at 22 °C. Mice were at least 7 weeks old before surgery. Following surgery, mice were single housed and allowed to recover for at least 1 week before experimentation. All fluid and food experiments were performed with at least two cohorts of mice and data were combined, unless otherwise stated.
During salt-related experiments, mice were fed on a sodium-deficient diet (<0.02% NaCl, Diet #99091603, Research Diet) and had access to saline and water in tubes, unless otherwise noted. At other times, such as during feeding experiments in BioDAQ chambers, mice were fed a control rodent diet (Diet D12450, Research Diets). Some mice were also tested on a liquid diet, Ensure (Abbott Laboratories).
Generation of OxtrCre:GFP mice
The 5′ arm (~5 kb with PacI and SalI sites at each end) and 3′ arm (~5 kb with PmeI and NotI sites at each end) of Oxtr gene were amplified from a C57Bl/6 BAC clone by PCR using Phusion Polymerase (New England Biolabs) and cloned into polylinkers of a targeting construct that contained ires-mnCre:GFP, a frt-flanked Sv40Neo gene for positive selection, and HSV thymidine kinase and Pgk-diphtheria toxin A chain genes for negative selection (see Supplementary Fig. 1). The ires-mnCre:GFP cassette has an internal ribosome entry sites followed by a myc-tag and nuclear localization signal at the N terminus of Cre recombinase fused to green fluorescent protein. The construct was electroporated into G4 ES cells (C57Bl/6 × 129 Sv hybrid) and correct targeting was determined by Southern blot of DNA digested with HindIII using a 32P-labeled probe downstream of the 3′ arm of the targeting construct. Thirteen of 84 clones analyzed were correctly targeted. One clone that was injected into blastocysts resulted in good chimeras that transmitted the targeted allele throughout the germline. Progeny were bred with Gt(Rosa)26Sor-FLP FLP recombinase mice to remove the SV-Neo gene. Mice were then continuously backcrossed to C57Bl/6 mice.
Virus production
AAV1-DIO-hM3Dq:mCherry and AAV1-DIO-hM4Di:mCherry (both driven by the human SYNAPSIN promotor) DNA plasmids were provided by B. Roth (University of North Carolina at Chapel Hill); AAV1-DIO-YFP, AAV1-DIO-ChR2:YFP (both driven by the human SYNAPSIN promoter) and AAV1-DIO-mCherry (driven by the Ef1a promoter) DNA plasmids were provided by K. Deisseroth (Stanford University) The AAV1-DIO-GFP:TetTox (driven by the CBA promoter), AAV1-DIO-synaptophysin:mCherry (driven by the Ef1a promoter) and AAV1-DIO-GCaMP6m (driven by the CBA promoter) were generated as described15,24,44. The non-selective AAV8-hM3Dq:mCherry (driven by the human SYNAPSIN promoter) was a gift from B. Roth (Addgene plasmid #50474). The non-selective AAV1-DsRed (driven by the CBA promoter) was developed in our laboratory. AAV vectors were prepared in human embryonic kidney (HEK293T) cells with AAV serotype 1 (AAV1), purified by multi-step sucrose- and CsCl-gradient centrifugation and resuspended in phosphate-buffered solution at a titer of ~2 × 10⁹ viral genomes/μl. Aliquots were stored at –80 °C before use.
Stereotaxic surgery
Mice were anesthetized with isoflurane, placed on a stereotaxic frame (David Kopf Instruments) and injected with ketoprofen (5 mg/kg, ip) for analgesia. Stereotaxic coordinates were normalized for the anterior-posterior plane by a correction factor (F = distance between bregma and lambda/4.21)45. Viruses were injected (500 nl bilaterally) via glass pipettes using the Nanoject II Auto-Nanoliter Injector (3-000-204; Drummond Scientific Company). The viruses were injected according to the following coordinates: PVH (AP: –0.2; ML: ± 0.25; DV: –5); PBN (AP: –5.2; ML: ± 1.35; DV: –3.1); NTS (AP: –7.4; ML: ± 0.35; DV: –5.2) or, in Cck Cre/+ mice, (AP: –6.8; ML ± 0.35; DV –5.2 at 10° holder angle). Mice were given >2 weeks to recover before experimentation to allow viral expression.
Infusion into the PBN was performed via bilateral cannulas (double cannula guide; 26 gauge, 2.7 mm apart, cut 5 mm below pedestal; PlasticsOne), which were inserted according to coordinates (AP: –5.2; ML: ± 1.35; DV: –3.1) and affixed to the skull with C&B Metabond (Parkell) and dental acrylic. Prior to and between infusions, cannulas were kept patent by inserting a dummy double cannula (0.2 mm width; 2.7 mm apart; fit 5 mm) and small round-top dust caps. Infusions were performed using an internal double injector (33 gauge; 2.7 mm apart; 0.2 mm width) for a cannula guide.
Tissue processing
Following experimentation, mice were anesthetized with Beuthanasia 0.2 ml ip (effective content 320 mg/kg pentobarbital; Schering-Plough) and perfused transcardially with phosphate-buffered saline (PBS), followed by 4% paraformaldehyde (Electron Microscopy Sciences) in PBS. Brains were removed and placed in paraformaldehyde at 4 °C overnight, and then cryoprotected in 30% sucrose in PBS overnight, then OCT (Fisher HealthCare) and kept at –80 °C before processing. Coronal sections of 30 μm thickness were cut from the brain on a cryostat. For all Fos studies, every third section was collected (90 μm apart) for quantification. For confirmation of viral targeting, every fifth brain section was mounted onto glass slides (Fisherbrand Superfrost Plus microscope slides, Fisher Scientific) and coverslipped with Dapi Fluoromount G (Southern Biotech), and remaining sections were collected in PBS for further processing as required.
Although Oxtr Cre/+ mice have GFP fused to Cre, we were unable to visualize GFP even after anti-GFP antibody staining; hence OxtrPBN neurons were visualized by genetic crosses with Ai14 mice, which allows expression of TdTomato in Oxtr neurons.
Slice optogenetics and electrophysiology
Acute 250-μm coronal slices that included the PBN were prepared from 2–6-month-old mice, which were deeply anesthetized in their housing room before decapitation. Slice procedure and recordings were performed essentially as previously described33. Neurons of interest were identified by GFP or mCherry expression (CGRPPBN and OxtrPBN neurons, respectively). To observe neuronal activity under minimally invasive conditions, endogenous spike activity and optogenetically evoked spikes were recorded in loose-patch cell-attached configuration with patch pipettes filled with the same artificial cerebrospinal fluid used for slice perfusion (ACSF, in mM: NaCl 115, KCl 3, CaCl2 2, MgCl2 1, NaH2PO4 1, NaHCO3 25 and d-glucose 11; mOsm 295, pH 7.4 when aerated with carbogen, 33 °C) and 0 holding current. Synaptic currents were recorded under voltage-clamp conditions and patch pipettes filled with intracellular solution (in mM: 100 cesium methanosulfonate, 25 CsCl, 2 MgCl2, 10 HEPES, 0.4 EGTA, 4 ATP, 0.4 GTP, 10 phosphocreatine, mOsm 295, pH 7.3). Light-evoked action potentials and synaptic currents were initiated by optical activation of ChR2 with 2–5-ms pulses of blue light (up to 3 mW optic power) either from a 473-nm laser (Laserglow) via an optic fiber positioned over the slice, or from a high power 460 nm LED (UHP-LED, Prizmatix) via a microscope objective. Synaptic latency was measured as the time between onset of the blue-light pulse and the onset of synaptic current. Synaptic jitter was calculated as the s.d. in variation of synaptic latency over multiple trials (25–50) in a particular neuron. Currents were elicited at 10-s interval between successive trials, recorded at 2–5-kHz bandwidth, digitized at 20 kHz and acquired by pCLAMP10 software (Molecular Devices). Drugs were dissolved in ACSF and delivered to slices by local perfusion via a three-barrel system positioned over the slice. The drug application was gravity driven and on-off timing was manually controlled. Where indicated, AMPA and NMDA glutamate receptors were inhibited by a cocktail of CNQX (20 μM, Tocris) and d-AP5 (50 μΜ, Tocris) added to ACSF, and GABAA receptors were inhibited by picrotoxin (100 μM, Tocris). Other drugs used include the following: Oxtr agonist, TGOT (200 nM; Bachem, H-7710)46; specific Oxtr antagonist, atosiban (1 μM; Sigma-Aldrich, A3480)47; and CCK-8 (30 nM; Bachem; H-2080)48. Overall, recordings were made from 45 OxtrPBN neurons from 47 PBN slices derived from 26 Oxtr Cre/+ mice (some crossed with Oxt Cre/+ mice), of which 11 were male and 15 were female; and from 7 CGRPPBN neurons from 7 PBN slices derived from 7 Calca Cre/+ mice (all male).
Immunohistochemistry
Fos studies
Immunohistochemistry was performed on free-floating sections. Sections underwent three 5-min washes in PBST (phosphate-buffered solution with 0.1% Triton X-114 (Sigma-Aldrich)) and were placed in a blocking solution (PBST with 3% normal donkey serum (NDS; Jackson ImmunoResearch)) for 1 h at room temperature (20–22 °C) to prevent nonspecific binding. For the primary antibody, sections were incubated with rabbit anti-Fos (1:2,000; Cell Signaling Technology, number PC38) in 3% NDS in PBST overnight at 4 °C. After three 5-min washes in PBST, the samples were incubated in the dark with a Cy5-conjugated (far red) donkey anti-rabbit IgG (1:500; Jackson Immunoresearch, number 711-175-152) in 3% NDS in PBST for 1 h at 20–22 °C. The samples were then washed three times (5 min each) in PBS, before being mounted onto glass slides in PBS and coverslipped using Dapi Fluoromount-G.
hM3Dq, hM4Di and synaptophysin studies
Oxtr Cre/+, Oxt Cre/+, Oxt Cre/+ ::Oxtr Cre/+ , Calca Cre/+ and Cck Cre/+ mice injected with AAV1-DIO-hM3Dq:mCherry, AAV1-DIO-hM4Di:mCherry, control AAV1-DIO-mCherry and AAV-DIO-synaptophysin:mCherry underwent anti-DsRed immunohistochemistry staining to amplify the fluorescent protein signal. To examine neuronal activation, we examined Fos expression in hM3Dq- and control mCherry-injected mice after injection with CNO 2 h before perfusion. The primary antibodies were rabbit anti Ds-Red (1:1,000; (Clontech) Takara Bio USA, number 632496) and goat anti-Fos (1:500, Santa Cruz Biotechnology); the secondary antibodies were Alexa Fluor 594-conjugated donkey anti-rabbit IgG (1:500; Jackson Immunoresearch, number 711-585-152) and Cy5-conjugated donkey anti-goat IgG (1:500; Jackson Immunoresearch, number 705-175-147).
TetTox studies
Oxtr Cre/+, Oxt Cre/+ and Oxt Cre/+ ::Oxtr Cre/+ mice injected with AAV1-DIO-GFP:TetTox and AAV1-DIO-YFP underwent anti-GFP immunohistochemistry staining using a similar histological procedure to amplify the fluorescent protein signal. The primary antibody was chicken anti-GFP (1:10,000; Abcam, number 13970); the secondary antibody was Alexa Fluor 488-conjugated donkey anti-chicken IgG (1:500; Jackson Immunoresearch, number 703-545-155).
CGRP antibody studies
To investigate coexpression of Oxtr and CGRP in PBN, we assessed PBN sections from Oxtr Cre/+::Ai14 mice. The primary antibody was mouse anti-CGRP (1:5,000; Abcam, ab81887); the secondary antibody was Cy5-conjugated anti-mouse IgG (1:400, Jackson Immunoresearch, number 715-175-150).
RNAscope
We performed in situ hybridization (ISH) using the RNAscope assay49 on brain tissue collected from Oxtr Cre/+::Ai14 and Cck Cre/+ mice. Mice were perfused as described above then embedded gradually through a series of 10%, 20% and 30% sucrose followed by OCT (Fisher HealthCare). Brains were cut coronally at 10 μm thickness, mounted and stored at –80 °C before processing. On the day of processing, sections were thawed at 20–22 °C for ~30 min before performing ISH according to the manufacturer’s protocol (Advanced Cell Diagnostics). We used probes for Oxtr (Mm-Oxtr-C3 probe, 1:50 dilution) and Fos (Mm-Fos-C2 probe, 1:50 dilution). Following ISH, slides were coverslipped and imaged as described. For Oxtr Cre/+::Ai14 mice, we imaged TdTomato fluorescence, then matched sections after ISH (n = 3). For Cck Cre/+ mice, we imaged staining for Oxtr and Fos mRNA after performing ISH (n = 3).
Microscopy
For Fos, in situ and coexpression studies, brain sections were imaged on an Olympus Fluoview FV1200 confocal microscope (Shijuku). To confirm targeted injections, brain sections were imaged using the Nikon upright epifluorescent Eclipse E600 microscope (Minato) or Keyence Fluorescence Microscope BZ-X700. ImageJ, a program for optimizing brightness and contrast, was used to color images—for example, Oxtr Cre::Ai14 cells red and AAV1-DIO-YFP-injected neurons green. Images were minimally processed to enhance brightness and contrast for optimal representation. Following imaging, any mouse whose targeted injection site was missed or demonstrated very sparse expression (≤6 fluorescent neurons/section), suggesting inadequate injection, was excluded from experimental analysis. In addition, any mouse that was unilaterally injected was included in experimental analyses for stimulatory (one unilateral injection in each group of hM3Dq-injected OxtrPBN and OxtPVH mice) and control groups, but was excluded from inhibitory (TetTox- and hM4Di-injected) groups. For infusion experiments, mice whose targeted injection was missed were excluded (two mice).
Fos experiments
For salt-depletion and fluid-deprivation experiments, Oxtr Cre::Ai14 mice were single-housed and placed on a sodium-deficient diet and given access to both 0.5 M NaCl and water for 5 d of habituation. For salt depletion, mice were divided into three groups: (1) salt returned, (2) salt depleted and (3) control (n = 3 or 4 per group). Mice in group 1 were injected with furosemide (5 mg ml−1) daily for 2 d and denied access to saline (but not water), to develop a salt appetite50. On day 3, saline was returned and mice were perfused 2 h later (during the light cycle). Mice in group 2 underwent a similar protocol; however, saline was not returned before perfusion. Mice in group 3 had no furosemide challenge and were perfused on day 3.
For fluid deprivation, mice were divided into two groups: (1) fluid returned and (2) fluid deprived (n = 3 or 4 per group). Mice in group 1 were deprived of saline and water for ~24 h, and were perfused 2 h after fluid was returned (during the light cycle). Mice in group 2 were also deprived of saline and water for ~24 h, which were not returned before perfusion.
For hypertonic saline injections, mice were single-housed for 5 d with ad libitum access to food and water, and divided into two groups: (1) 1 M saline (10 µl g−1 body weight) injection and (2) normal saline injection (n = 3 or 4 per group). Each mouse was injected with saline and perfused 2 h later (during the light cycle).
Quantification of Fos expression was performed on six 30-µm-thick coronal brain sections 90 µm apart, ranging from bregma –5.1 to –5.5 (encompassing the major portion of the PBN where Oxtr is expressed). The investigator who quantified Fos was blinded to the identity of the conditions. Given that there was differential activation throughout the PBN, the sections were evenly divided into caudal, middle and rostral regions. An estimate of total Oxtr-expressing neurons was made by multiplying by 3.
To examine Fos expression in OxtrPBN, CGRPPBN, OxtPVH, CCKNTS or NTS neurons following experimentation, mice were injected with CNO and perfused 2 h later.
Calcium imaging
Mice were prepared for calcium imaging as described51. Briefly, 3 weeks after AAV1-DIO-GCaMP6m and AAV1-DIO-hM3Dq:mCherry viral injection, mice were anesthetized (as described above) and implanted with a microendoscope lens (6.1 mm length, 0.5 mm diameter; Inscopix, catalog #100-000588) with assistance of a ProView implant kit (Inscopix, catalog #100-000754) that allowed visualization of the fluorescent activity during the lens implantation. Because basal fluorescence from Oxtr neurons was low, we treated the mice with CNO before lens implantation to facilitate visualization and lens placement. The lens was targeted to be ~200–300 µm above the neurons using the following coordinates: –4.80 mm posterior to bregma, –1.40 mm lateral from midline, and –3.00 mm ventral to skull surface. One week after lens implantation, mice were anesthetized and a baseplate (Inscopix, catalog #100-000279) was implanted above the lens. The baseplate provides an interface for attaching the miniature microscope during calcium imaging experiments, but at other times a baseplate cover (Inscopix, catalog #100-000241) was attached to prevent damage to the microendoscope lens. Calcium fluorescence was recorded at five frames per second, 200-ms exposure time, and 50% LED power using a miniature microscope from Inscopix (nVista). The recording parameters were based on pilot studies that demonstrated the least amount of photobleaching while allowing sufficient detection of fluorescent activity. We used Ethovision (XT 10, Noldus Technology) to trigger and synchronize calcium recordings with behavioral video recordings.
Water deprivation and rehydration
Mice were water-deprived for 24 h. On the experimental day, mice were briefly anesthetized with isoflurane to attach the microscope, and then allowed to acclimate in their home cage for 1 h. After the acclimation period, baseline fluorescence was recorded for 30 s, a water bottle was placed in the cage, and fluorescence was continuously recorded for 10 min. On separate test days, we placed an empty bottle or a bottle with Ensure in the cage. We adjusted the focus of the microscope between tests, accounting for slightly different total numbers of neurons between different test days. Calcium recording files were spatially downsampled (factor of 4), motion-corrected (Inscopix, Mosaic v1.2), and fluorescent traces from individual neurons were extracted using constrained non-negative matrix factorization for microendoscopic data (CNMF-E)52. The key parameters used for CNMF-E were: l, 7; l n, 14; P min, 10; L min, 0.85 (ref. 52). We then normalized (0 to 1) individual fluorescence traces taken from the entire 10-min recording period. Photobleaching was apparent during the recording session, so we were unable to adequately measure changes in activity over extended periods of time (for example, 10-min session); instead, we analyzed the change in fluorescence activity for 5 s before and 5 s during each bout. Bouts were defined as uninterrupted mouth contact with the water spout, and the beginning of an inter-bout interval was >10 s of not contacting the spout. The data from every bout were averaged for each neuron across the 10-min recording session. ‘Activated neurons’ were defined as neurons that had an average fluorescence (after time point 0) of >2 s.d. above baseline (baseline = average fluorescence from –5 to 0 s). Following the recording session, we injected mice with CNO, which aided in identifying all the neurons. These rehydration studies were conducted during the first hour of the dark cycle.
CNO-induced activation
Mice were briefly anesthetized with isoflurane to attach the microscope, then allowed to acclimate in their home cage for 1 h. After acclimation, we recorded baseline fluorescence activity for 30 s, followed by an ip injection of CNO (1 mg/kg). We non-continuously recorded (20 s for each time point) fluorescence at 5, 10, 15, 20, 25, 30, 45, 60 and 120 min after CNO injection. The calcium recording files were spatially downsampled (factor of 2), motion-corrected, and fluorescent traces were extracted using individual component analysis and principal component analysis (Inscopix, Mosaic v1.2). The change in fluorescence (ΔF/F) was calculated as (F – F 0)/F 0, where F 0 was the average fluorescence 30 s before injection and F was the average fluorescence during a particular time point. These studies were conducted during the light cycle.
Food, water and saline intake
For acute feeding assays, mice were placed in BioDAQ chambers (Research Diets) which measured food intake electronically. Mice were individually housed, and water and body weight were measured manually. Mice were supplied with a rodent diet (D12450B, Research Diets), habituated to cages for 5–7 d and habituated to saline injections for 2–3 d. To measure food intake during the dark cycle, mice were injected with CNO 30 min before lights out and had access to food removed until lights out. To measure refeeding after a fast, food was removed for 24 h, then mice were injected with CNO 30 min before the return of food (in the morning). To measure food intake during the light cycle, mice were injected with CNO in the morning, then denied access to food for 30 min to allow time for the CNO to take effect. The experimenter was not blinded to the identity of the experimental versus control groups.
For drinking and salt-related studies, mice had access to both water and saline, and were placed on a sodium-depleted diet (diet #99091603, Research Diets), unless otherwise stated, to allow accurate measurement of both fluid and salt intake. Tubes were placed into angled ports at the front of a cage and weighed manually (in grams; converted to milliliters), taking care to prevent dripping.
For TetTox-injected mice, baseline salt intake was monitored at three different concentrations (0.075, 0.3 and 0.5 M) for 3 d each (after 1 d of habituation); for subsequent experiments, a saline concentration of 0.3 M was used, unless otherwise stated. The order of experiments was baseline food and/or saline studies, 48-h salt depletion, 24-h fluid deprivation, hypertonic (0.5 M) saline ip, mannitol (1 M) ip and PEG 30% subcutaneous injections (these last three were randomly ordered). All these experiments were performed at the start of the dark cycle, unless otherwise noted. Recovery time was at least 7 d following salt depletion, and at least 3 d following other experiments.
For baseline fluid experiments in Oxtr Cre/+ and Oxt Cre/+ mice, we compared CNO versus vehicle injections in hM3Dq- and mCherry-injected mice, and found no significant difference in fluid intake following vehicle injection. Given that there were multiple fluid intake experiments, we limited the number of experiments performed on individual mice by injecting only CNO and comparing fluid intake in hM3Dq- versus mCherry-injected mice. We observed a difference in NaCl intake between Oxt Cre/+ and Oxtr Cre/+ mice, which is likely due to a difference in mouse strains obtained from difference sources, so we ensured matched littermates were used for controls in all experiments. In Oxtr Cre/+ mice, one hM3Dq-injected mouse appeared sick 2 d before PEG injection, so it was perfused and not included in that experiment.
Given that mice underwent a series of fluid intake experiments, we also compared daily water and 0.3 M NaCl intake from the start of experimentation (just before the first study) to the end of experimentation (in final week of fluid intake studies). Salt and fluid deprivation were performed as described in the "Fos experiments" section. For hM3Dq-, hM4Di- and mCherry-injected mice, CNO (1 mg kg−1) ip was injected 30 min before returning fluid. Fluid was returned ~15 min after the start of the dark cycle. For all deprivation experiments, we observed that mice would typically drink a large proportion in the first 15–30 min of the experiment, so we reported the first 2 h in 15-min intervals, unless otherwise stated. Baseline CNO and vehicle (normal saline) injections were also performed 30 min before returning fluid.
Hypertonic (0.5 M) saline and 1 M mannitol were injected ip ~10 min before CNO injection, whereas 30% PEG was injected subcutaneously ~30 min before CNO injection to allow extra time to diffuse. In general, these experiments showed increased differentiation of fluid intake over a longer time period, so we reported 4 h in 1-h intervals, unless otherwise stated. For liquid diet (Ensure) experiments, mice were habituated to Ensure and water for 2 d and then deprived of Ensure for 24 h before experimentation.
A separate cohort of mice was used to test limited Ensure intake and fluid intake in the absence of food. For the limited Ensure intake protocol, we initially returned a small quantity of Ensure (1.6 ml or 0.7 ml) after 24-h deprivation; at the end of experimentation, we returned ad libitum Ensure. For fluid intake in the absence of food, we repeated the protocol for 24-h dehydration, but removed food during the experimental period.
A separate cohort of mice was also used to test dehydration-induced food intake. Mice were habituated to BioDAQ chambers and supplied with a rodent diet (D12450B). On the day of experimentation, water and food were removed 7 h before lights out, then food (but not water) was returned at the start of the dark cycle. CNO was injected 30 min before experiments.
Intra-PBN infusions were performed during the light cycle. Infusions were performed using CMA-100 microinjection pump (Bioanalytical Systems) over 5 min. Fluid was returned 5 min after infusion and intake measured for 2 h.
For Calca Cre/+ mice, we performed baseline fluid, rehydration and salt depletion studies, as described above. Rehydration was performed with 0.3 M NaCl and water; baseline fluid and salt depletion experiments were performed with 0.5 M NaCl and water. For Cck Cre/+ mice and nonspecific hM3Dq-injected mice, we performed rehydration experiments with 0.3 M NaCl and water in hM3Dq versus control mice.
Pharmacological injections
The following agents were prepared in sterile 0.9% saline: CNO (Sigma-Aldrich; C0832), polyethylene glycol (30% v/v; 20000 MW; Sigma-Aldrich; P2263). The following agents were prepared in sterile water: hypertonic NaCl (0.5 M; Fisher Scientific), mannitol (1 M; Sigma-Aldrich; M9647) and furosemide (5 mg ml−1; Hospira). Polyethylene glycol was injected subcutaneously at 0.5 ml per mouse; all other compounds were injected intraperitoneally, including CNO, hypertonic NaCl and mannitol (10 µl g−1 body weight), and furosemide (8 µl g−1 body weight). CNO (1 mM) was also infused intra-PBN.
Statistics and figure preparation
Data analysis and generation of histograms were performed using GraphPad Prism Version 6.01 for Windows (GraphPad Software). Results are expressed as mean ± s.e.m. Statistical significance was determined by different tests appropriate for each dataset: for comparing the means of two groups, unpaired two-tailed Student’s t test; for comparing the means of three or more groups, a one-way ANOVA with Tukey’s post hoc tests; for correlation studies, a Pearson product-moment correlation; for comparing food or fluid intake over time, a repeated measures two-way ANOVA with Sidak’s post hoc tests, unless otherwise noted. Three-way mixed design ANOVAs were performed using IBM SPSS Statistics for Windows v.20 (IBM). If Mauchly’s test of sphericity was violated, a Greenhouse-Geisser correction was applied; if significant interaction was determined, a simple two-way interaction was performed with statistical significance accepted at a Bonferroni-adjusted α level of 0.025. We also tested for equality of variance (Brown-Forsythe test for one-way ANOVAs; or Levene’s test of equality of variances). Data distribution was assumed to be normal, but this was not formally tested. ****P < 0.0001; ***P < 0.001; **P < 0.01; *P < 0.05. Calcium fluorescence data were analyzed using OriginPro v.2016 (OriginLab).
A power analysis was performed for an effective sample size using http://powerandsamplesize.com. Based on a pilot study for fluid deprivation, we used a mean of 1.8 and s.d. of 0.4. Assuming a significance level of 0.05 and power of 0.8, we calculated a sample size of 7 per group if means were 1.5-fold different with a two-tailed Student’s t test. Data and figures were exported into Adobe Illustrator CS6 (Adobe Systems) to prepare figures. Images of sagittal mouse brain were taken from the Motifolio toolkit.
Supplementary statistical analyses and methods checklist are provided in Supplementary Table 2 and the Life Sciences Reporting Summary.
Life Sciences Reporting Summary
Further information on experimental design and reagents is available in the Life Sciences Reporting Summary.
Code availability
No code was written by authors.
Data availability
The data that support the findings of this study are available from the corresponding author upon reasonable request.
Methods
Methods, including statements of data availability and any associated accession codes and references, are available at 10.1038/s41593-017-0014-z.
Acknowledgements
We thank B. Roth and K. Deisseroth for AAV plasmid constructs. M. Chiang assisted with animal husbandry. S. Tsang and K. Kafer helped to generate the Oxtr Cre mice. We thank J. Chen for help with surgery for Calca Cre/+ experiments and C. Roman for help with surgery for Cck Cre/+ experiments. M. McKinley, B. Jarvie, C. Roman and members of the Palmiter lab provided helpful discussion and feedback. P.J.R. was supported by an Australian American Fellowship and a National Health and Medical Council of Australia CJ Martin Fellowship. C.A.C. was supported by a fellowship from Hope Funds for Cancer Research. R.D.P. was supported by a US National Institutes of Health grant (R01-DA24908). Inscopix provided the calcium-imaging equipment and supplies via their DECODE grant program.
Integrated supplementary information
Supplementary information
Supplementary Figures 1–10 and Supplementary Tables 1 and 2
Supplementary Video 1.
Calcium fluorescence in OxtrPBN neurons during rehydration (2× speed). Upper panel: video of mouse behavior during water rehydration following 24-h dehydration; lower panel: corresponding calcium fluorescence activity in OxtrPBN neurons demonstrating low activity during dehydration and initial presentation of water, followed by increasing activity during drinking bouts, with decreasing activity between bouts (n = 94 neurons from 3 mice)
Supplementary Video 2.
Calcium fluorescence in OxtrPBN neurons during a prolonged drinking bout (2× speed). Upper panel: video of mouse behavior during drinking bout; lower panel: corresponding calcium fluorescence activity in OxtrPBN neurons demonstrating activity during drinking bout
Supplementary Video 3.
Calcium fluorescence in hM3Dq-injected OxtrPBN neurons following intraperitoneal CNO (10× speed).Calcium fluorescence in OxtrPBN neurons following injection of CNO ip, demonstrating increasing activity over ~15 min, which lasted at least 2 h (n = 83 neurons from 2 mice)
Author contributions
P.J.R. and R.D.P. conceived and designed the study. P.J.R. performed and analyzed the experiments. S.I.R and P.J.R. performed the immunohistochemistry and counting of cells. V.A.D. performed electrophysiological experiments. C.A.C. performed GCaMP6 studies. R.D.P. generated Oxtr Cre mice and provided equipment and reagents. P.J.R. wrote the manuscript with input from R.D.P and other authors.
Competing interests
The authors declare no competing financial interests.
Footnotes
Publisher’s note: Springer Nature remains neutral with regard to jurisdictional claims in published maps and institutional affiliations.
Electronic supplementary material
Supplementary information is available for this paper at 10.1038/s41593-017-0014-z.
Contributor Information
Philip J. Ryan, Email: philip.ryan@florey.edu.au
Richard D. Palmiter, Email: palmiter@uw.edu
References
- 1.Lee HJ, Macbeth AH, Pagani JH, Young WS., III Oxytocin: the great facilitator of life. Prog. Neurobiol. 2009;88:127–151. doi: 10.1016/j.pneurobio.2009.04.001. [DOI] [PMC free article] [PubMed] [Google Scholar]
- 2.Arletti R, Benelli A, Bertolini A. Oxytocin inhibits food and fluid intake in rats. Physiol. Behav. 1990;48:825–830. doi: 10.1016/0031-9384(90)90234-U. [DOI] [PubMed] [Google Scholar]
- 3.Blevins JE, Eakin TJ, Murphy JA, Schwartz MW, Baskin DG. Oxytocin innervation of caudal brainstem nuclei activated by cholecystokinin. Brain Res. 2003;993:30–41. doi: 10.1016/j.brainres.2003.08.036. [DOI] [PubMed] [Google Scholar]
- 4.Stricker EM, Verbalis JG. Central inhibition of salt appetite by oxytocin in rats. Regul. Pept. 1996;66:83–85. doi: 10.1016/0167-0115(96)00058-4. [DOI] [PubMed] [Google Scholar]
- 5.Rigatto K, Puryear R, Bernatova I, Morris M. Salt appetite and the renin-angiotensin system: effect of oxytocin deficiency. Hypertension. 2003;42:793–797. doi: 10.1161/01.HYP.0000090321.81218.7B. [DOI] [PubMed] [Google Scholar]
- 6.Balment RJ, Brimble MJ, Forsling ML. Release of oxytocin induced by salt loading and its influence on renal excretion in the male rat. J. Physiol. (Lond.) 1980;308:439–449. doi: 10.1113/jphysiol.1980.sp013481. [DOI] [PMC free article] [PubMed] [Google Scholar]
- 7.Conrad KP, Gellai M, North WG, Valtin H. Influence of oxytocin on renal hemodynamics and sodium excretion. Ann. NY Acad. Sci. 1993;689:346–362. doi: 10.1111/j.1749-6632.1993.tb55559.x. [DOI] [PubMed] [Google Scholar]
- 8.Verbalis JG, Mangione MP, Stricker EM. Oxytocin produces natriuresis in rats at physiological plasma concentrations. Endocrinology. 1991;128:1317–1322. doi: 10.1210/endo-128-3-1317. [DOI] [PubMed] [Google Scholar]
- 9.McKinley MJ, Johnson AK. The physiological regulation of thirst and fluid intake. News Physiol. Sci. 2004;19:1–6. doi: 10.1152/nips.01470.2003. [DOI] [PubMed] [Google Scholar]
- 10.Geerling JC, Loewy AD. Central regulation of sodium appetite. Exp. Physiol. 2008;93:177–209. doi: 10.1113/expphysiol.2007.039891. [DOI] [PubMed] [Google Scholar]
- 11.Johnson AK, Thunhorst RL. The neuroendocrinology of thirst and salt appetite: visceral sensory signals and mechanisms of central integration. Front. Neuroendocrinol. 1997;18:292–353. doi: 10.1006/frne.1997.0153. [DOI] [PubMed] [Google Scholar]
- 12.Verbalis JG. Disorders of body water homeostasis. Best Pract. Res. Clin. Endocrinol. Metab. 2003;17:471–503. doi: 10.1016/S1521-690X(03)00049-6. [DOI] [PubMed] [Google Scholar]
- 13.Gimpl G, Fahrenholz F. The oxytocin receptor system: structure, function, and regulation. Physiol. Rev. 2001;81:629–683. doi: 10.1152/physrev.2001.81.2.629. [DOI] [PubMed] [Google Scholar]
- 14.Fenselau H, et al. A rapidly acting glutamatergic ARCxxx >PVH satiety circuit postsynaptically regulated by α-MSH. Nat. Neurosci. 2017;20:42–51. doi: 10.1038/nn.4442. [DOI] [PMC free article] [PubMed] [Google Scholar]
- 15.Carter ME, Soden ME, Zweifel LS, Palmiter RD. Genetic identification of a neural circuit that suppresses appetite. Nature. 2013;503:111–114. doi: 10.1038/nature12596. [DOI] [PMC free article] [PubMed] [Google Scholar]
- 16.Ohman LE, Johnson AK. Lesions in lateral parabrachial nucleus enhance drinking to angiotensin II and isoproterenol. Am. J. Physiol. 1986;251:R504–R509. doi: 10.1152/ajpregu.1986.251.3.R504. [DOI] [PubMed] [Google Scholar]
- 17.Callera JC, et al. GABAA receptor activation in the lateral parabrachial nucleus induces water and hypertonic NaCl intake. Neuroscience. 2005;134:725–735. doi: 10.1016/j.neuroscience.2005.05.009. [DOI] [PubMed] [Google Scholar]
- 18.Edwards GL, Johnson AK. Enhanced drinking after excitotoxic lesions of the parabrachial nucleus in the rat. Am. J. Physiol. 1991;261:R1039–R1044. doi: 10.1152/ajpregu.1991.261.4.R1039. [DOI] [PubMed] [Google Scholar]
- 19.Menani JV, De Luca LA, Jr, Johnson AK. Role of the lateral parabrachial nucleus in the control of sodium appetite. Am. J. Physiol. Regul. Integr. Comp. Physiol. 2014;306:R201–R210. doi: 10.1152/ajpregu.00251.2012. [DOI] [PMC free article] [PubMed] [Google Scholar]
- 20.Armbruster BN, Li X, Pausch MH, Herlitze S, Roth BL. Evolving the lock to fit the key to create a family of G protein-coupled receptors potently activated by an inert ligand. Proc. Natl. Acad. Sci. USA. 2007;104:5163–5168. doi: 10.1073/pnas.0700293104. [DOI] [PMC free article] [PubMed] [Google Scholar]
- 21.Jarvie BC, Palmiter RD. HSD2 neurons in the hindbrain drive sodium appetite. Nat. Neurosci. 2017;20:167–169. doi: 10.1038/nn.4451. [DOI] [PubMed] [Google Scholar]
- 22.Rinaman L, et al. Dehydration anorexia is attenuated in oxytocin-deficient mice. Am. J. Physiol. Regul. Integr. Comp. Physiol. 2005;288:R1791–R1799. doi: 10.1152/ajpregu.00860.2004. [DOI] [PubMed] [Google Scholar]
- 23.Kinsman B, et al. Osmoregulatory thirst in mice lacking the transient receptor potential vanilloid type 1 (TRPV1) and/or type 4 (TRPV4)receptor. Am. J. Physiol. Regul. Integr. Comp. Physiol. 2014;307:R1092–R1100. doi: 10.1152/ajpregu.00102.2014. [DOI] [PMC free article] [PubMed] [Google Scholar]
- 24.Han S, Soleiman MT, Soden ME, Zweifel LS, Palmiter RD. Elucidating an affective pain circuit that creates a threat memory. Cell. 2015;162:363–374. doi: 10.1016/j.cell.2015.05.057. [DOI] [PMC free article] [PubMed] [Google Scholar]
- 25.Davern PJ, McKinley MJ. Brain regions influenced by the lateral parabrachial nucleus in angiotensin II-induced water intake. Neuroscience. 2013;252:410–419. doi: 10.1016/j.neuroscience.2013.08.027. [DOI] [PubMed] [Google Scholar]
- 26.Matsuda T, et al. Distinct neural mechanisms for the control of thirst and salt appetite in the subfornical organ. Nat. Neurosci. 2017;20:230–241. doi: 10.1038/nn.4463. [DOI] [PubMed] [Google Scholar]
- 27.Johnson AK, Cunningham JT, Thunhorst RL. Integrative role of the lamina terminalis in the regulation of cardiovascular and body fluid homeostasis. Clin. Exp. Pharmacol. Physiol. 1996;23:183–191. doi: 10.1111/j.1440-1681.1996.tb02594.x. [DOI] [PubMed] [Google Scholar]
- 28.Swanson LW, Sawchenko PE. Hypothalamic integration: organization of the paraventricular and supraoptic nuclei. Annu. Rev. Neurosci. 1983;6:269–324. doi: 10.1146/annurev.ne.06.030183.001413. [DOI] [PubMed] [Google Scholar]
- 29.Sutton AK, et al. Control of food intake and energy expenditure by Nos1 neurons of the paraventricular hypothalamus. J. Neurosci. 2014;34:15306–15318. doi: 10.1523/JNEUROSCI.0226-14.2014. [DOI] [PMC free article] [PubMed] [Google Scholar]
- 30.Smith KS, Bucci DJ, Luikart BW, Mahler SV. DREADDS: use and application in behavioral neuroscience. Behav. Neurosci. 2016;130:137–155. doi: 10.1037/bne0000135. [DOI] [PMC free article] [PubMed] [Google Scholar]
- 31.Swanson LW, Kuypers HG. The paraventricular nucleus of the hypothalamus: cytoarchitectonic subdivisions and organization of projections to the pituitary, dorsal vagal complex, and spinal cord as demonstrated by retrograde fluorescence double-labeling methods. J. Comp. Neurol. 1980;194:555–570. doi: 10.1002/cne.901940306. [DOI] [PubMed] [Google Scholar]
- 32.Menani JV, Johnson AK. Cholecystokinin actions in the parabrachial nucleus: effects on thirst and salt appetite. Am. J. Physiol. 1998;275:R1431–R1437. doi: 10.1152/ajpregu.1998.275.5.r1431. [DOI] [PubMed] [Google Scholar]
- 33.Roman CW, Derkach VA, Palmiter RD. Genetically and functionally defined NTS to PBN brain circuits mediating anorexia. Nat. Commun. 2016;7:11905. doi: 10.1038/ncomms11905. [DOI] [PMC free article] [PubMed] [Google Scholar]
- 34.Chen Y, Lin YC, Kuo TW, Knight ZA. Sensory detection of food rapidly modulates arcuate feeding circuits. Cell. 2015;160:829–841. doi: 10.1016/j.cell.2015.01.033. [DOI] [PMC free article] [PubMed] [Google Scholar]
- 35.Mandelblat-Cerf Y, et al. Bidirectional anticipation of future osmotic challenges by vasopressin neurons. Neuron. 2017;93:57–65. doi: 10.1016/j.neuron.2016.11.021. [DOI] [PMC free article] [PubMed] [Google Scholar]
- 36.McKinley MJ, Denton DA, Nelson JF, Weisinger RS. Dehydration induces sodium depletion in rats, rabbits, and sheep. Am. J. Physiol. 1983;245:R287–R292. doi: 10.1152/ajpregu.1983.245.2.R287. [DOI] [PubMed] [Google Scholar]
- 37.Huang W, Lee SL, Arnason SS, Sjöquist M. Dehydration natriuresis in male rats is mediated by oxytocin. Am. J. Physiol. 1996;270:R427–R433. doi: 10.1152/ajpregu.1996.270.2.R427. [DOI] [PubMed] [Google Scholar]
- 38.McKinley MJ. Adaptive appetites for salted and unsalted food in rats: differential effects of sodium depletion, DOCA and dehydration. Am. J. Physiol. Regul. Integr. Comp. Physiol. 2013;304:R1149–R1160. doi: 10.1152/ajpregu.00481.2012. [DOI] [PubMed] [Google Scholar]
- 39.Kutscher C. Effect of hypertonic saline injections and water deprivation on drinking, serum osmolality and gut water. Physiol. Behav. 1966;1:259–268. doi: 10.1016/0031-9384(66)90015-1. [DOI] [Google Scholar]
- 40.Huang W, Lee SL, Sjöquist M. Natriuretic role of endogenous oxytocin in male rats infused with hypertonic NaCl. Am. J. Physiol. 1995;268:R634–R640. doi: 10.1152/ajpregu.1995.268.3.R634. [DOI] [PubMed] [Google Scholar]
- 41.Saper CB, Lowell BB. The hypothalamus. Curr. Biol. 2014;24:R1111–R1116. doi: 10.1016/j.cub.2014.10.023. [DOI] [PubMed] [Google Scholar]
- 42.Stachniak TJ, Trudel E, Bourque CW. Cell-specific retrograde signals mediate antiparallel effects of angiotensin II on osmoreceptor afferents to vasopressin and oxytocin neurons. Cell Reports. 2014;8:355–362. doi: 10.1016/j.celrep.2014.06.029. [DOI] [PubMed] [Google Scholar]
- 43.Benelli A, Bertolini A, Arletti R. Oxytocin-induced inhibition of feeding and drinking: no sexual dimorphism in rats. Neuropeptides. 1991;20:57–62. doi: 10.1016/0143-4179(91)90040-P. [DOI] [PubMed] [Google Scholar]
- 44.Sanford CA, et al. A Central Amygdala CRF Circuit Facilitates Learning about Weak Threats. Neuron. 2017;93:164–178. doi: 10.1016/j.neuron.2016.11.034. [DOI] [PMC free article] [PubMed] [Google Scholar]
- 45.Paxinos G, Franklin KBJ. The Mouse Brain Atlas in Stereotaxic Coordinates. Waltham, MA, USA: Elsevier Academic Press; 2013. [Google Scholar]
- 46.Owen SF, et al. Oxytocin enhances hippocampal spike transmission by modulating fast-spiking interneurons. Nature. 2013;500:458–462. doi: 10.1038/nature12330. [DOI] [PMC free article] [PubMed] [Google Scholar]
- 47.Tang Y, et al. Oxytocin activation of neurons in ventral tegmental area and interfascicular nucleus of mouse midbrain. Neuropharmacology. 2014;77:277–284. doi: 10.1016/j.neuropharm.2013.10.004. [DOI] [PubMed] [Google Scholar]
- 48.Mohammad S, et al. Functional compensation between cholecystokinin-1 and -2 receptors in murine paraventricular nucleus neurons. J. Biol. Chem. 2012;287:39391–39401. doi: 10.1074/jbc.M112.416214. [DOI] [PMC free article] [PubMed] [Google Scholar]
- 49.Wang F, et al. RNAscope: a novel in situ RNA analysis platform for formalin-fixed, paraffin-embedded tissues. J. Mol. Diagn. 2012;14:22–29. doi: 10.1016/j.jmoldx.2011.08.002. [DOI] [PMC free article] [PubMed] [Google Scholar]
- 50.Liedtke WB, et al. Relation of addiction genes to hypothalamic gene changes subserving genesis and gratification of a classic instinct, sodium appetite. Proc. Natl. Acad. Sci. USA. 2011;108:12509–12514. doi: 10.1073/pnas.1109199108. [DOI] [PMC free article] [PubMed] [Google Scholar]
- 51.Resendez SL, et al. Visualization of cortical, subcortical and deep brain neural circuit dynamics during naturalistic mammalian behavior with head-mounted microscopes and chronically implanted lenses. Nat. Protoc. 2016;11:566–597. doi: 10.1038/nprot.2016.021. [DOI] [PMC free article] [PubMed] [Google Scholar]
- 52.Zhou, P. et al. Efficient and accurate extraction of in vivo calcium signals from microendoscopic video data. Preprint at https://arxiv.org/abs/1605.07266 (2016). [DOI] [PMC free article] [PubMed]
Associated Data
This section collects any data citations, data availability statements, or supplementary materials included in this article.
Data Availability Statement
The data that support the findings of this study are available from the corresponding author upon reasonable request.