

Abstract
Introduction
HIV infection is known to be associated with brain volume loss, even in optimally treated patients. In this study, we assessed whether dynamic brain volume changes over time are predictive of neurobehavorial performance in the HIV-1 transgenic (Tg) rat, a model of treated HIV-positive patients.
Materials and methods
Cross-sectional brain MRI imaging was first performed comparing Tg and wild type (WT) rats at 3 and 19 months of age. Longitudinal MRI and neurobehavioral testing of another group of Tg and WT rats was then performed from 5 to 23 weeks of age. Whole brain and subregional image segmentation was used to assess the rate of brain growth over time. We used repeated-measures mixed models to assess differences in brain volumes and to establish how predictive the volume differences are of specific neurobehavioral deficits.
Results
Cross-sectional imaging showed smaller whole brain volumes in Tg compared to WT rats at 3 and at 19 months of age. Longitudinally, Tg brain volumes were smaller than age-matched WT rats at all time points, starting as early as 5 weeks of age. The Tg striatal growth rate delay between 5 and 9 weeks of age was greater than that of the whole brain. Striatal volume in combination with genotype was the most predictive of rota-rod scores and in combination with genotype and age was the most predictive of total exploratory activity scores in the Tg rats.
Conclusion
The disproportionately delayed striatal growth compared to whole brain between 5 and 9 weeks of age and the role of striatal volume in predicting neurobehavioral deficits suggest an important role of the dopaminergic system in HIV associated neuropathology. This might explain problems with motor coordination and executive decisions in this animal model. Smaller brain and subregional volumes and neurobehavioral deficits were seen as early as 5 weeks of age, suggesting an early brain insult in the Tg rat. Neuroprotective therapy testing in this model should thus target this early stage of development, before brain damage becomes irreversible.
Keywords: HIV-1 transgenic rat, Brain volume, MRI, Neurobehavioral testing
Graphical abstract

Highlights
-
•
HIV infection is known to be associated with brain volume loss.
-
•
HIV transgenic rats showed smaller brain volumes than wild type rats.
-
•
Tg rats showed disproportionate loss of volume in the striatum compared to brain.
-
•
Tg striatal volume loss along with genotype/age predict neurobehavioral deficits.
1. Introduction
The central nervous system is an early target of HIV infection (An et al., 1999). Along those lines, a multitude of studies have used MR volumetry in the assessment of HIV-positive (HIV +) patients, showing various levels of volume loss (Aylward et al., 1993, Cardenas et al., 2009, Hua et al., 2013, Kallianpur et al., 2013), reflective of HIV-associated neurodegeneration. Even in the post-antiretroviral therapy (ART) era, brain volume loss remains prevalent and progressive, suggesting ongoing brain injury (Cardenas et al., 2009, Becker et al., 2012).
As in humans, brain morphology is often an important biomarker of neuropathology in animal models of neurodegeneration (Zhang et al., 2010). The HIV-1 transgenic (Tg) rat model is a popular small animal model in NeuroHIV studies, is known to develop neurological abnormalities with age and has been proposed as a model of chronic HIV infection in the post-ART era (Vigorito et al., 2015, Vigorito et al., 2013, Moran et al., 2013a, Webb et al., 2010, Reid et al., 2001a). In this model, the transgene expresses 7 of the 9 HIV genes (including gp120, nef, and tat) and neurologic damage is assumed to result from chronic exposure to neurotoxic effects of viral proteins (Vigorito et al., 2015, Peng et al., 2010, Reid et al., 2001b). We have previously described structural and functional abnormalities in the Tg rat in comparison to age-matched wild type (WT) rats (Lee et al., 2014, Lee et al., 2015, Lentz et al., 2014) as well as defective exploratory and motor behavior (Reid et al., 2016a). The latter (neurobehavioral deficits) were assessed using a combination of open field box (measuring total exploratory activity, distances traveled in the internal and external zones, number of line crossings, rearing time and rearing time in the external zone) reflective of general locomotor activity, unconditioned motivated behavior, and behavioral plasticity (Walsh & Cummins, 1976) and accelerating rotarod apparatus (measuring the latency to fall detected by a photo-beam under the rotating shaft) reflective of motor learning/planning and locomotor activity (Shiotsuki et al., 2010).
Besides cross-sectional detection of brain volume discrepancies in the young and old Tg rats compared to WT rats, a main aim in this study was to longitudinally evaluate brain growth rates in both groups to better understand the dynamics of brain injury in the Tg rat and to document the earliest time point at which brain injury starts. Towards this goal, we used volumetric MR as a biomarker of neuropathology. We then correlated with concurrently obtained neurobehavioral testing measures that were previously used and reported in correlation with FDG PET imaging (Reid et al., 2016a). We also wanted to assess the growth rates of various brain subregions compared to the whole brain, since we suspected differential regional vulnerabilities to viral protein toxicity.
2. Materials and methods
2.1. Animals
Male HIV-1 Tg rats (F344/Hsd) and age-matched WT rats (F344) were purchased from Envigo (Indianapolis, IN) and used in various experiments. All rats were housed in a temperature-controlled environment with a 12-h light/dark cycle and free access to food and water. All procedures were conducted during the light cycle and all neurobehavioral tests were performed between 10 AM and 2 PM. All studies were approved by the Animal Care and Use Committee of the National Institutes of Health, Clinical Center.
2.2. In vivo MRI acquisition
MR images were acquired using a PharmaScan 7T/16 Scanner (Bruker, Germany). Rats were anesthetized with 1–2.5% isoflurane using a vaporizer and a facial mask. A heating pad was wrapped around the rat cradle for maintenance of physiological body temperature. For the cross-sectional study (n = 20), rats were divided into four cohorts: young Tg (n = 6, age = 3.6 ± 0.13 months), young WT (n = 4, age = 3.6 ± 0.12 months), old Tg (n = 5, age = 19.2 ± 0.10 months), and old WT (n = 5, age = 18.4 ± 0.05 months). A cross-coil setup was used which included a 72 mm transmission coil and a 20 mm surface coil placed on the animal's head. A series of sagittal T2-weighted images (rapid acquisition with refocused echoes, RARE) were initially obtained at the midline to allow for consistent positioning of the coronal images with respect to the corpus callosum. Parameters included echo time (TE) = 49 ms, repetition time (TR) = 1000 ms, slice thickness = 0.5 mm, matrix size = 256 × 256, field of view (FOV) = 35 × 35 mm (spatial resolution = 0.14 × 0.14 mm/pixel) and 8 averages. T2-weighted images for the segmentation portion of this study were acquired in the coronal plane. Parameters included: TE/TR = 12.3/3379 ms, slice thickness = 1 mm and RARE factor of 8 (image acquisition time ~ 15 min).
For the longitudinal study, MRI scans were obtained on 5 male Tg and 4 age-matched WT rats. The first MR acquisition was performed at 5 weeks of age, then every 4 weeks with the last time point acquired at 23 weeks of age. A 9 cm RF birdcage volumetric coil was used for image acquisition. Parameters for 3-dimensional (3D) T2-weighted fast spin echo included: TE/TR = 84/1000 ms, slice thickness = 0.312 mm, FOV = 40 × 40 × 40 mm, and matrix size: 128 × 128 × 128 (spatial resolution = 0.312 × 0.312 × 0.312 mm/pixel), flip angle = 180°, echo train length = 16 and 4 averages with image acquisition time of ~ 68 min. Images were post processed to matrix of 256 × 256 × 256 resulting in isotropic resolution of 0.156 mm. The animals' weights were recorded at each time point.
2.3. Image analysis
For the cross-sectional images, we used manual segmentation of whole brain volumes using the “Levelset VOI” and “Paint brush” tools in MIPAV (Medical Image Processing, Analysis, and Visualization), a free software developed at NIH.
For the longitudinal images, MIPAV was used for rigid alignment of all images (9 animals × 5 timepoints = 45 scans) to the same target space. Each image was segmented by registration of multiple atlases followed by manual refinement. An image template and atlas were created for each time point (5, 9, 13, 17, 23 weeks) and for each genotype (WT/Tg) (total of ten templates). Templates were created by averaging the MRI images for each subgroup. Nine volumes of interest were then delineated to create an atlas using ITK-Snap: whole brain, which includes CSF and parenchyma, striatum, corpus callosum, hippocampus, cortex, cerebellum, olfactory bulbs, brainstem, and ventricles. Segmentations were based on Paxinos and Watson rat brain atlas (Paxinos & Watson, 2007). Whole brain label propagation was used for skull stripping before subregional segmentation.
The multi-atlas image segmentation method was performed using affine registration of multiple atlases to each individual target (Artaechevarria et al., 2009, Cabezas et al., 2011). Afterwards, higher probability rules/majority voting and manual input determined pixel classification for each subregion (Lorenzo-Valdés et al., 2004). For ventricular segmentation, we used a combination of multi-atlas based segmentation and intensity thresholding.
2.4. Neurobehavioral testing
The neurobehavioral data included in this paper has been previously reported in correlation with FDG PET imaging in the same group of rats (Reid et al., 2016a). As previously described, neurobehavioral testing was performed longitudinally. Data on changes in motor function from Tg and WT rats was collected using a Rota-rod apparatus, operated in an accelerated mode (Med Associates, Inc., St. Albans, VT). Rats were tested starting at 5 weeks of age, with each time point consisting of 2 trials (total of thirteen time points, over a period of 16 weeks). The rota-rod has a default speed of 4 rpm and accelerates to 40 rpm over the 5 min testing period. Once a rat was removed from its cage, it was placed on the rod in the direction of rotation. A photo-beam under the rotating shaft detected when the animal had fallen and data was collected on the latency to fall.
Exploratory activity in the same group of animals was assessed using open field testing. The apparatus (ANY-maze, Stoelting Co., Wood Dale, IL) has a square floor with side lengths of 40 cm, surrounded by 35 cm high opaque Plexiglas walls, an overhead recording camera, photo-beam array (to detect rearing behavior) and tracking software (used for tracking and analyzing data in pre-defined zones). All trials were conducted at the same time of the day (10 AM–2 PM) at 30 min intervals. Under low illumination, tracking was initiated once the animal was placed in the center of the field. Tests were started when the animals were 11 week-old and seven time points were collected over 14 weeks. Total exploratory activity scores were collected for analysis and correlation with brain volumetry. We chose the total exploratory activity score since it mirrors the 6 min walk test, a clinical outcome measure to assess locomotive activity and coordination in small animals (Gould et al., 2009, Tatem et al., 2014).
2.5. Statistical analysis
2.5.1. Brain volume differences
For cross-sectional images, differences between Tg and WT animals and between young and old rats were assessed by analysis of variance (ANOVA). If the ANOVA was deemed significant, Student's t-tests were then performed.
In the longitudinal study, statistical analysis of brain volumes (total and subregional) was performed using mixed models with repeated measures (SAS/STAT Software 9.4, SAS Institute, Inc., Cary, NC). For modeling separate subregions as well as the whole brain, two predictor variables, genotype and age, were included, as well as their interaction.
Based on these models, we compared whole brain and subregional volume in Tg and WT rats at each time point and assessed the percent decrease in Tg brain volumes using the WT volumes as reference. Additionally, whole brain and subregional growth rates (μl/week) were calculated for Tg and WT rats separately (slopes of growth rates between 5 and 9 weeks, between 9 and 13 weeks, between 13 and 17 weeks and between 17 and 23 weeks) and were compared using least squares means estimate model for assessment of differences in slopes.
2.5.2. Body weight differences
Using the same approach as with brain volumes, mixed models with repeated measures were used to compare WT and Tg rat weights at each time point. Group, age and group by age interaction were assessed. Additionally, body weight growth rates (g/week) between the imaging time points were compared between the two genotypes.
2.5.3. Predictive models of neurobehavioral performance
Brain volume measurements were interpolated for weeks where imaging and behavioral studies did not overlap. Using the segmented data as sample points, data interpolation was performed using a shape-preserving piecewise cubic interpolation. The interpolated value is based on neighborhood grid points. Data was interpolated for a range of 4 to 25 weeks.
We then explored the association between rota-rod performance and several factors: whole-brain volume, genotype (Tg versus WT), age (as well as squared and cubed) and weight (as well as squared and cubed). A repeated-measures mixed model was applied with the rota-rod performance score as the dependent variable (Y-variable) and the factors listed above as potential predictors (X-variables). The “best” model was selected based on the Bayesian Information Criterion (BIC), a criterion for model selection among a finite set of models. Predictors from the best model are reported with their corresponding significant p-value. This analysis was repeated 8 times, with the whole-brain volume replaced with the volume of each of the 8 brain subregions. The same approach was used to evaluate the association between total exploratory activity and the factors listed above by replacing rota-rod performance score with total exploratory behavior score as the dependent variable and repeating the analysis. The statistical significance of each predictor variable in the “best” model was then examined for significance (p < 0.05). P-values < 0.05 were considered statistically significant, although because of multiplicity, p-values between 0.01 and 0.05 should be viewed as borderline significant.
3. Results
3.1. Cross sectional and longitudinal brain volume differences
In the cross-sectional analysis, the HIV-1 Tg rats were found to have smaller WB volumes when compared to age-matched WT rats in both age groups (Table 1). In the young cohorts, Tg whole brain volumes were 9.6% smaller than WT on average, while in the old cohort, the Tg brain volumes were 10.3% smaller. Those differences were highly significant. Larger WB volumes were also seen in the older cohorts compared to younger cohorts in both animal groups (Tg and WT).
Table 1.
Cross-sectional comparison of whole brain volumes (μl) in the Tg and WT rats.
| Group | Age (months) | Volume (μl) | ANOVA⁎ | Group comparisons | P values⁎⁎ |
|---|---|---|---|---|---|
| Young Tg (n = 6) | 3.6 ± 0.13 | 1855 ± 75.4 | p < 0.0001 | Young Tg vs young WT | 0.001 |
| Young WT (n = 4) | 3.6 ± 0.12 | 2051 ± 36.5 | Old Tg vs old WT | 0.0001 | |
| Old Tg (n = 5) | 19.2 ± 0.10 | 2046 ± 42.1 | Young Tg vs old Tg | 0.0001 | |
| Old WT (n = 5) | 18.4 ± 0.05 | 2282 ± 51.6 | Young WT vs old WT | 0.001 |
a. Whole brain values include CSF in the ventricles and subarachnoid spaces.
b. Age and volumes are listed as mean ± standard deviation and units are μl.
Overall p-value from ANOVA model with whole brain volume as response variable (y-variable) and genotype and age category as explanatory variables (x-variables).
P-values from specific-group contrasts based on the ANOVA model.
For the longitudinal analysis, whole brain volumes of Tg rats were significantly decreased compared to age-matched WT rats at all ages (Fig. 2) with Table 2 showing the statistical significance of the Genotype and Age effects: [Genotype: F (1, 9) = 142.71, p < 0.0001; Age: F (4, 27) = 249.04, p < 0.0001]. The subregional volume differences however did not exactly match those in the whole brain. This was most noticeable in the striatum which showed 25–28% decreased volume compared to only 9–12% decreased whole brain volume (Table 2). When we compared the growth rate slopes of the Tg and WT rats between the different imaging time points, we found that growth rates between the two groups differed significantly for whole brain and all subregions (except ventricles) between 5 and 9 weeks. Growth rates were not significantly different beyond 9 weeks of age (Table 3). When assessing the various regions, the delay in striatal growth was more appreciable (48% lower in Tg compared to WT) than that of whole brain (27% lower in Tg compared to WT) and all other regions (Table 3). It also was disproportionate to the rate of change of body weight (15% delay in body growth in Tg compared to WT) (Table 3).
Fig. 2.

Longitudinal whole brain and regional volume changes of Tg and WT rats over time.
Table 2.
Longitudinal whole brain and regional volume and body weight differences between WT and Tg rats (WT > Tg).
| Imaging time points |
Genotype effects |
Age effects |
|||||
|---|---|---|---|---|---|---|---|
| 5 weeks | 9 weeks | 13 weeks | 17 weeks | 23 weeks | Pr > F (DF) | Pr > F (DF) | |
| Whole brain | 9% | 12% | 12% | 11% | 11% | < 0.0001 (9) | < 0.0001 (27) |
| Striatum | 25% | 28% | 27% | 28% | 27% | < 0.0001 (7) | < 0.0001 (28) |
| Corpus callosum | 19% | 21% | 22% | 23% | 22% | < 0.0001 (9) | < 0.0001 (28) |
| Hippocampus | 15% | 17% | 17% | 18% | 16% | < 0.0001(7) | < 0.0001(28) |
| Cortex | 12% | 15% | 15% | 15% | 15% | < 0.0001 (9) | < 0.0001 (28) |
| Cerebellum | 6% | 9% | 9% | 9% | 9% | < 0.0001 (10) | < 0.0001 (28) |
| Olfactory bulb | 6% | 8% | 7% | 8% | 8% | < 0.0001 (7) | < 0.0001 (28) |
| Brainstem | 7% | 11% | 10% | 10% | 10% | 0.0003 (7) | < 0.0001 (25) |
| Ventricles | − 14% | − 15% | − 14% | − 13% | − 11% | < 0.0001 (7) | < 0.0001 (28) |
| Body weight | − 3% | 7% | 10% | 13% | 14% | 0.0153 (11) | < 0.0001 (28) |
a. (Pr > F) is the p value based on F-test from the statistical repeated-measures model with two factors (genotype and age) and their interaction term.
b. DF represents the denominator degrees of freedom.
Table 3.
Whole brain and regional volume growth rates (μl/week) and rates of change in body weight (g/week) for WT and Tg rats (WT > Tg) across various time points.
| From 5 to 9 weeks |
From 9 to 13 weeks |
From 13 to 17 weeks |
From 17 to 23 weeks |
|||||||||||
|---|---|---|---|---|---|---|---|---|---|---|---|---|---|---|
| Tg | WT | Diff. (DF) | P-value | % difference | Tg | WT | Diff. (DF) | Tg | WT | Diff. (DF) | Tg | WT | Diff. (DF) | |
| Whole brain | 62.42 | 85.56 | 23.14 (27) | 0.0016 | 27% | 24.68 | 26.9 | 2.22 (27) | 20.59 | 21.4 | 0.81 (27) | 15.6 | 15.12 | − 0.47 (27) |
| Striatum | 1.16 | 2.24 | 1.08 (28) | < 0.0001 | 48% | 0.57 | 0.49 | − 0.08 (28) | 0.39 | 0.75 | 0.36 (28) | 0.2 | 0.14 | − 0.06 (28) |
| Corpus callosum | 1.64 | 2.42 | 0.78 (27) | 0.0005 | 32% | 0.5 | 0.78 | 0.28 (27) | 0.52 | 0.79 | 0.27 (27) | 0.31 | 0.28 | − 0.03 (27) |
| Hippocampus | 1.48 | 2.12 | 0.64 (28) | 0.0023 | 30% | 0.52 | 0.63 | 0.11 (28) | 0.49 | 0.68 | 0.20 (28) | 0.18 | 0.03 | − 0.15 (28) |
| Cortex | 12.23 | 18.6 | 6.37 (27) | 0.0015 | 34% | 4.82 | 4.74 | − 0.08 (27) | 4.15 | 5.83 | 1.68 (27) | 1.61 | 1.65 | 0.04 (27) |
| Cerebellum | 9.95 | 13 | 3.05 (27) | 0.002 | 23% | 3.28 | 3.81 | 0.53 (27) | 2.53 | 2.73 | 0.20 (27) | 1.24 | 0.96 | − 0.29 (27) |
| Olfactory bulb | 6.69 | 8.11 | 1.42 (28) | 0.046 | 18% | 2.39 | 2.18 | − 0.21 (28) | 2.07 | 2.42 | 0.36 (28) | 0.43 | 0.69 | 0.26 (28) |
| Brainstem | 4.63 | 6.61 | 1.99 (25) | 0.015 | 30% | 2.17 | 1.71 | − 0.46 (25) | 1.3 | 1.79 | 0.48 (25) | 0.66 | 0.79 | 0.12 (25) |
| Ventricles | 1.35 | 1.16 | − 0.18 (28) | > 0.05 | − 16% | 0.46 | 0.45 | − 0.01 (28) | 0.15 | 0.24 | 0.09 (28) | 0.27 | 0.35 | 0.07 (28) |
| Body weight | 24.65 | 29 | 4.35 (28) | 0.013 | 15% | 11.07 | 13.92 | 2.85 (28) | 9.22 | 12.46 | 3.24 (28) | 5.52 | 7.44 | 1.92 (28) |
a. (DF) represents the denominator degrees of freedom.
b. % difference is calculated with respect to WT rats
c. P-values and % differences are only included for the 5–9 weeks age range. For the other age ranges, the differences in growth and body weight change rates were not significant.
3.2. Weight differences
We started our imaging and behavioral studies at the age of 5 weeks at which point the body weights of Tg and WT rats were similar [WT mean weight: 86.9 ± 6.94 g, Tg mean weight: 89.4 ± 10.42 g] (Fig. 1). The Tg rat weights however started diverging from WT weights (Tg < WT) and the differences became significantly different at and after 13 weeks of age [F (1, 10.6) = 5.36, p < 0.05]. Overall, Tg rats weighed significantly less compared to age-matched WT rats with significant group and age effects as well as group by age effect [Transgene: F (1, 11.1) = 8.19, p < 0.02; Age: F (4, 28) = 1614.19, p < 0.0001; Interaction: F (4, 28) = 20.15, p < 0.0001]. While the rate of change in body weight was higher in the WT compared to Tg rats across the various time points, the difference between the slopes was statistically significant only between 5 and 9 weeks (Table 3).
Fig. 1.
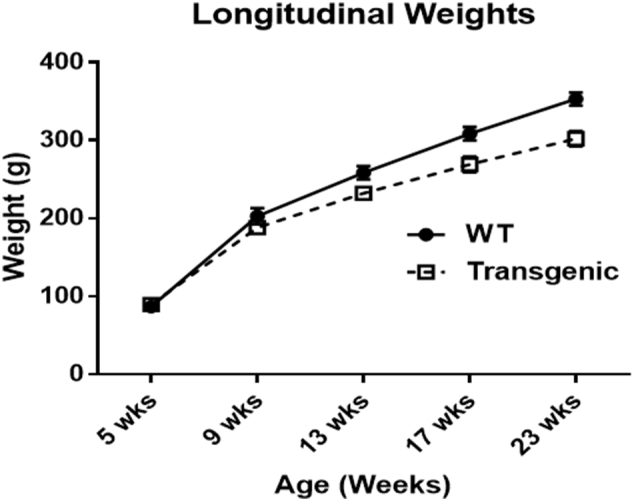
Longitudinal weight changes of Tg and WT rats over time.
3.3. Analysis of neurobehavioral performance and brain volumes
3.3.1. Rota-rod performance
As previously reported, the WT rats significantly outperformed the Tg rats on the rota-rod (Reid et al., 2016a). Of the multiple explanatory variables considered (whole brain/subregional volumes (analyzed separately), genotype, weight, and age), genotype and weight were generally found to be the “best” set of predictors of rota-rod performance based on BIC (Table 4), with p-values of 0.016 and < 0.0001, respectively, except for the striatum. For the latter, the combination of striatal volume (p < 0.0001) and genotype (p < 0.0001) was instead found to be the “best” set of predictors rather than genotype and weight as for the other subregions.
Table 4.
Predictive models of neurobehavioral performance/rota-rod score.
| Y-variable = rotarod score | ||
|---|---|---|
| Volumetric X-variable considered | Best model includes (X-variables selected) | P values (DF)⁎ |
| Whole brain volume | Genotype & weight | 0.016 (8), < 0.0001 (98) |
| Striatum volume | Genotype & striatum volume | < 0.0001 (26), < 0.0001 (98) |
| Corpus callosum volume | Genotype & weight | 0.016 (8), < 0.0001 (98) |
| Hippocampus volume | Genotype & weight | 0.016 (8), < 0.0001 (98) |
| Cortex volume | Genotype & weight | 0.016 (8), < 0.0001 (98) |
| Cerebellum volume | Genotype & weight | 0.016(8), < 0.0001 (98) |
| Olfactory bulb volume | Genotype & weight | 0.016 (8), < 0.0001 (98) |
| Brainstem volume | Genotype & weight | 0.016 (8), < 0.0001 (98) |
| Ventricles volume | Genotype & weight | 0.016(8), < 0.0001 (98) |
P-values are based on F-test from ANCOVA models. DF represents the denominator degrees of freedom.
It's worth noting that for the whole brain measurements, the next best model after genotype and weight (based on BIC) was the combination of whole brain volume (p = 0.023) and weight (p < 0.0001).
3.3.2. Total exploratory activity score
Similarly, in the open field test, the WT rats significantly outperformed the Tg rats (Reid et al., 2016a). When considering the total exploratory activity score, the combination of genotype and weight again best predicted performance [Genotype: p = 0.007, Weight: p < 0.0001] based on the mixed linear models with the lowest BIC, when whole brain volume was included among the explanatory variables. For the striatum, the combination of striatal volume (p = 0.038), genotype (p = 0.011) and age (p = 0.015), was found to be the most predictive based on the mixed linear models with lowest BIC (Table 5). For the rest of the subregions, various results were seen. When the cerebellum volume was considered, the best set of predictors were the cerebellum volume (p = 0.034), genotype (p = 0.003) and age (p = 0.027). When the olfactory bulbs volume was considered, the best set of predictors included all 4 factors: olfactory bulbs volume (p < 0.0001), genotype (p < 0.0001), age (p < 0.0001) and weight (p = 0.003). For the rest of the subregions (hippocampus, brainstem, cortex, corpus callosum, and ventricles) considered individually, the same combination of factors as for the whole brain volume (genotype and weight with same p-values) was found to be best predictor of the total exploratory activity score.
Table 5.
Predictive models of neurobehavioral performance/total exploratory activity score.
| Y-variable = open field score (total exploratory activity score) | ||
|---|---|---|
| Volumetric X-variable considered | Best model includes (X-variables included) | P values (DF)⁎ |
| Whole brain volume | Genotype & weight | 0.007 (9), < 0.0001(56) |
| Striatum volume | Genotype, age & striatum volume | 0.011(58), 0.015(63), 0.038(61) |
| Corpus callosum volume | Genotype & weight | 0.007 (9), < 0.0001 (56) |
| Hippocampus volume | Genotype & weight | 0.007 (9), < 0.0001 (56) |
| Cortex volume | Genotype & weight | 0.007 (9), < 0.0001 (56) |
| Cerebellum volume | Genotype, age & cerebellum volume | 0.003 (34), 0.027 (63), 0.034 (62) |
| Olfactory bulb volume | Genotype, age, weight & olfactory bulb volume | < 0.0001 (63), < 0.0001 (63), 0.003 (63), < 0.0001 (63) |
| Brainstem volume | Genotype & weight | 0.007 (9), < 0.0001 (56) |
| Ventricles volume | Genotype & weight | 0.007 (9), < 0.0001 (56) |
P-values are based on F-test from ANCOVA models. DF represents the denominator degrees of freedom.
4. Discussion
The neurologic manifestations of HIV infection include impairment of neurocognitive function (Alfahad and Nath, 2013, Ances and Ellis, 2007), abnormal cerebral blood flow (Szeto et al., 1998, Towgood et al., 2013) and accelerated signs of aging (Pfefferbaum et al., 2014). While the introduction of combination anti-retroviral therapy (cART) has significantly halted and controlled the infection itself, the neuropathology at the root of persistent and apparently progressive neurological damage in HIV remains incompletely understood (Kaul & Lipton, 2006). Using MR volumetric measurements, brain atrophy suggestive of neuronal injury has been repeatedly documented in HIV + patients, both in the pre and post-ART eras (Aylward et al., 1993, Cardenas et al., 2009, Kallianpur et al., 2013, Becker et al., 2012, Becker et al., 2011). Along those lines, we were interested in using MR volumetry to evaluate volume loss in the HIV-1 Tg rat, a model of viral protein induced neurotoxicity and of treated HIV + patients (Vigorito et al., 2015, Peng et al., 2010).
Our preliminary cross-sectional MR volumetric measurements of the whole brain showed significantly smaller brain volumes in Tg rats compared to WT rats both at 3 and at 19 months of age (Table 1). Based on those findings, we further evaluated brain and subregional volume differences in Tg and WT rats, using 3D MR imaging, longitudinally, in order to better understand the dynamics of Tg brain injury and to document the earliest time point at which damage starts. Interestingly, we were able to document smaller whole brain and subregional brain volumes in the Tg compared to age-matched WT rats, as early as 5 weeks of age (the youngest animals we could obtain commercially) despite the animals having similar weights at that time point (Fig. 1 and Table 2). Considering there are known correlations between brain volume and corresponding rat body weights (Valdes Hernandez et al., 2011), smaller brain volumes in the young Tg rat with comparable body weights suggested to us a neuropathology that is independent from weight/body growth. This neuropathology could be associated with the transgene expression of various viral proteins in the brain of the rats, which we have shown previously (Reid et al., 2016b). The findings also demonstrate a rather early nature of brain injury in this animal model. This injury continued as the animals grew older, with worsening of volumetric discrepancies until 9 weeks of age, but not thereafter. The delays in brain and body growth rates in Tg compared to WT rats were also significantly different between 5 and 9 weeks but not beyond 9 weeks of age. Those findings suggest that the bulk of injury happens early on in those animals, and that by around 2.5 months of age, the pathology becomes stable and possibly irreversible.
Interestingly, many individual brain subregions showed larger volume discrepancies and growth rate delays when compared to whole brain volume between 5 and 9 weeks of age (Table 3). Even though this would seem odd since the subregions we evaluated encompassed most of the brain parenchyma, it is however explainable by concomitant increased size of the ventricles accounting for apparently less impressive whole brain volume loss (Fig. 3). For example, at 9 weeks of age, while the Tg whole brain volume was 12% smaller than WT brain, the striatal volume was 28% smaller, the corpus callosum was 21% smaller and the ventricles were 13% larger (Table 2). Among the various subregions, the one showing the biggest volume discrepancy and greatest growth rate difference between 5 and 9 weeks of age was the striatum.
Fig. 3.

A, MRI scans of one WT rat and one Tg rat at 5 and 23 weeks of age. The third column shows the overlap between the scans. Note slight prominence of the ventricles in the Tg rat at 23 weeks of age (white arrows). B, 3-Dimensional rendering (lateral view) of mean WT and Tg rat brain volumes (in blue and red respectively) at 5 weeks and 23 weeks. (For interpretation of the references to color in this figure legend, the reader is referred to the web version of this article.)
In order to establish how predictive our volumetric measures were of previously reported neurobehavioral performance of the rats [rota-rod and open field testing (total exploratory behavior)] (Reid et al., 2016a), we used repeated-measures mixed models, with the explanatory variables (x-variables) including genotype, age and weight in addition to the individual brain volumes (whole brain and each subregion were evaluated individually, not in combination). Even though the most predictive combination for whole brain and most subregions were genotype and age, the striatum stood out: striatal volume combined with genotype was the most predictive of rota-rod performance and the combination of striatal volume with genotype and age was the most predictive of total exploratory activity scores (Table 4, Table 5). Those findings are consistent with our previous findings of dopaminergic dysfunction/loss in this animal model, using PET imaging (Lee et al., 2014) and with previous reports of poor learning of HIV Tg rats in the water maze task (Vigorito et al., 2007), which were typically thought to be dependent on the hippocampus but then proven to rather depend on the dorsal striatum and medial prefrontal cortex (Woolley et al., 2013). This is also in line with previous reports of dopaminergic dysfunction in the Tg rats (Webb et al., 2010, Moran et al., 2013b, Moran et al., 2012, Silvers et al., 2007) which probably parallels known susceptibility of the dopaminergic system to HIV in infected patients (Kumar et al., 2011, Kumar et al., 2009, Chang et al., 2008, Gelman et al., 2006). It again draws attention to the compounding effects of addiction drugs on a system that is already compromised, with worse damage seen in the Tg rats compared to WT rats under the effect of nicotine (Yang et al., 2017, Yang et al., 2016, Song et al., 2016, Cao et al., 2016, Nesil et al., 2015), ethanol (Wingo et al., 2016, Sarkar et al., 2013), methamphetamine (Moran et al., 2012, Pang et al., 2013, Henry et al., 2013, Kass et al., 2010, Liu et al., 2009) or cocaine administration (Moran et al., 2013b, McIntosh et al., 2015).
Interestingly, despite the volumetric discrepancies between our Tg and WT rats, we failed previously to detect any significant differences in glucose metabolism by FDG-PET imaging in the same group of animals (Reid et al., 2016a). This could potentially reflect relatively preserved neuronal metabolic activity in this animal model while other cells with lower glucose metabolic rates undergo degeneration with secondary brain volume loss. This is consistent with our findings of severe astrocytic loss worsening with age (Reid et al., 2016b). The exact cause of astrocytic vulnerability is still unclear although exposure to toxic viral proteins seems to be the most likely culprit. In fact we have previously shown expression of gp120 in the CSF of the Tg rats, which sometimes was higher than gp120 levels in the serum, as well as mRNA expression of gp120, nef and tat in the brain tissues, suggesting local production of viral proteins through transgene expression (Reid et al., 2016b). This is presumably similar to the neuropathology observed in optimally-treated HIV + patients, in whom integrated HIV provirus within latently infected cells is believed to produce neurotoxic HIV viral proteins with detectable levels of tat in the CSF (Johnson et al., 2013). Premature aging in the HIV + subjects (Pfefferbaum et al., 2014) can thus be simulated by the premature aging of the Tg rats (Vigorito et al., 2015).
One limitation to our cross-sectional study is the use of 2D rather than 3D imaging sequences which made segmentation of the subregions difficult and inaccurate. This is why for the longitudinal scans we acquired 3D images (despite longer imaging times), allowing for individual regional segmentation in a more accurate manner. Another limitation is the fact that imaging and neurobehavioral testing were not performed on the same days, which eventually required interpolation of certain data points. This however was necessitated by the logistics of scanner availability, the need to perform all the neurobehavioral testing procedures at the same time of the day (10 AM–2 PM), and to allow the rats to rest and recover after undergoing anesthesia during MR scanning.
The use of dedicated small animal MRI scanners for depiction of volumetric abnormalities in animal models of neurodegeneration is a powerful modality that provides noninvasive imaging biomarkers of diseases such as Alzheimer's dementia, Rett syndrome and Schizophrenia (Bertrand et al., 2010, Lau et al., 2008, Ward et al., 2008, Maheswaran et al., 2009, Rattray et al., 2013). In many of those studies, behavioral deficits are often assessed concurrently and then correlated with brain volumes (Zhang et al., 2010, Rattray et al., 2013). With the current increased availability of sophisticated segmentation techniques (Cabezas et al., 2011, Valdes Hernandez et al., 2011, Oguz et al., 2014, Lancelot et al., 2014, Li et al., 2013, Chakravarty et al., 2013) and the expansion of the use of structural high resolution MR imaging, brain volumetric biomarkers will allow better understanding of the mechanisms of disease and more importantly the effect of therapeutic and preventative approaches in neurodegenerative disorders. Whether MR brain volumetry can eventually be used as a biomarker of drug effects and therapeutic interventions in the HIV Tg rat remains to be seen.
In conclusion, using noninvasive MR imaging, we have shown brain volume discrepancies and neurobehavioral deficits in the Tg rat as early as 5 weeks of age, suggesting an early injury, which kept progressing until the age of 9 weeks, stabilizing afterwards. Based on those findings, if neuroprotective therapies are to be used in this model, we believe they should be applied at this early stage in order to halt the injury before longstanding structural changes become more entrenched and difficult to reverse. Therapies that manage to halt brain growth delay and volume discrepancies could then be further tested in translational human applications. We have also shown that striatal volumes along with different combinations of genotype and weight best predicted neurobehavioral deficits in this model, again pointing towards the special vulnerability of the dopaminergic system to viral protein toxicity. This is consistent with striatal volume being the most affected and striatal growth rate between 5 and 9 weeks of age being the most delayed among the subregions in the Tg compared to age-matched WT rats. Further evaluation of this animal model should concentrate on the striatum and the dopaminergic system to better understand the neuropathology and eventually extrapolate to human studies.
Acknowledgments
Acknowledgments
We would like to thank the staff at the Mouse Imaging Facility/NIH for help provided to conduct this study. We also appreciate the help provided by the MIPAV application development group at NIH.
Financial support
This research was supported by the Center for Infectious Disease Imaging (CIDI), an intramural research program at NIH (grant number CL090037-02).
References
- Alfahad T.B., Nath A. Update on HIV-associated neurocognitive disorders. Curr. Neurol. Neurosci. Rep. 2013;13(10):387. doi: 10.1007/s11910-013-0387-7. [DOI] [PMC free article] [PubMed] [Google Scholar]
- An S.F. Early entry and widespread cellular involvement of HIV-1 DNA in brains of HIV-1 positive asymptomatic individuals HIV-1 infection accelerates age according to the epigenetic clock. J. Neuropathol. Exp. Neurol. 1999;58(11):1156–1162. doi: 10.1097/00005072-199911000-00005. [DOI] [PubMed] [Google Scholar]
- Ances B.M., Ellis R.J. Dementia and neurocognitive disorders due to HIV-1 infection. Semin. Neurol. 2007;27(1):86–92. doi: 10.1055/s-2006-956759. [DOI] [PubMed] [Google Scholar]
- Artaechevarria X., Munoz-Barrutia A., Ortiz-de-Solórzano C. Combination strategies in multi-atlas image segmentation: application to brain MR data. IEEE Trans. Med. Imaging. 2009;28(8):1266–1277. doi: 10.1109/TMI.2009.2014372. [DOI] [PubMed] [Google Scholar]
- Aylward E.H. Reduced basal ganglia volume in HIV-1-associated dementia: results from quantitative neuroimaging. Neurology. 1993;43(10):2099–2104. doi: 10.1212/wnl.43.10.2099. [DOI] [PubMed] [Google Scholar]
- Becker J.T. Subcortical brain atrophy persists even in HAART-regulated HIV disease. Brain Imaging Behav. 2011;5(2):77–85. doi: 10.1007/s11682-011-9113-8. [DOI] [PMC free article] [PubMed] [Google Scholar]
- Becker J.T. Factors affecting brain structure in men with HIV disease in the post-HAART era. Neuroradiology. 2012;54(2):113–121. doi: 10.1007/s00234-011-0854-2. [DOI] [PMC free article] [PubMed] [Google Scholar]
- Bertrand J.B. Longitudinal MRI monitoring of brain damage in the neonatal ventral hippocampal lesion rat model of schizophrenia. Hippocampus. 2010;20(2):264–278. doi: 10.1002/hipo.20628. [DOI] [PubMed] [Google Scholar]
- Cabezas M. A review of atlas-based segmentation for magnetic resonance brain images. Comput. Methods Prog. Biomed. 2011;104(3):e158–e177. doi: 10.1016/j.cmpb.2011.07.015. [DOI] [PubMed] [Google Scholar]
- Cao J. Expression profile of nicotinic acetylcholine receptor subunits in the brain of HIV-1 transgenic rats given chronic nicotine treatment. J. Neurovirol. 2016;22(5):626–633. doi: 10.1007/s13365-016-0438-3. [DOI] [PMC free article] [PubMed] [Google Scholar]
- Cardenas V.A. Evidence for ongoing brain injury in human immunodeficiency virus-positive patients treated with antiretroviral therapy. J. Neurovirol. 2009;15(4):324–333. doi: 10.1080/13550280902973960. [DOI] [PMC free article] [PubMed] [Google Scholar]
- Chakravarty M.M. Performing label-fusion-based segmentation using multiple automatically generated templates. Hum. Brain Mapp. 2013;34(10):2635–2654. doi: 10.1002/hbm.22092. [DOI] [PMC free article] [PubMed] [Google Scholar]
- Chang L. Decreased brain dopamine transporters are related to cognitive deficits in HIV patients with or without cocaine abuse. NeuroImage. 2008;42(2):869–878. doi: 10.1016/j.neuroimage.2008.05.011. [DOI] [PMC free article] [PubMed] [Google Scholar]
- Gelman B.B. Abnormal striatal dopaminergic synapses in national NeuroAIDS tissue consortium subjects with HIV encephalitis. J. NeuroImmune Pharmacol. 2006;1(4):410–420. doi: 10.1007/s11481-006-9030-6. [DOI] [PubMed] [Google Scholar]
- Gould T.D., Dao D.T., Kovacsics C.E. Mood and Anxiety Related Phenotypes in Mice: Characterization Using Behavioral Tests. 2009. The open field test; pp. 1–20. [Google Scholar]
- Henry B.L. Behavioral effects of chronic methamphetamine treatment in HIV-1 gp120 transgenic mice. Behav. Brain Res. 2013;236(1):210–220. doi: 10.1016/j.bbr.2012.08.037. [DOI] [PMC free article] [PubMed] [Google Scholar]
- Hua X. Disrupted cerebral metabolite levels and lower nadir CD4 + counts are linked to brain volume deficits in 210 HIV-infected patients on stable treatment. Neuroimage Clin. 2013;3:132–142. doi: 10.1016/j.nicl.2013.07.009. [DOI] [PMC free article] [PubMed] [Google Scholar]
- Johnson T.P. Induction of IL-17 and nonclassical T-cell activation by HIV-Tat protein. Proc. Natl. Acad. Sci. U. S. A. 2013;110(33):13588–13593. doi: 10.1073/pnas.1308673110. [DOI] [PMC free article] [PubMed] [Google Scholar]
- Kallianpur K.J. Peripheral blood HIV DNA is associated with atrophy of cerebellar and subcortical gray matter. Neurology. 2013;80(19):1792–1799. doi: 10.1212/WNL.0b013e318291903f. [DOI] [PMC free article] [PubMed] [Google Scholar]
- Kass M.D. Methamphetamine-induced behavioral and physiological effects in adolescent and adult HIV-1 transgenic rats. J. NeuroImmune Pharmacol. 2010;5(4):566–573. doi: 10.1007/s11481-010-9221-z. [DOI] [PMC free article] [PubMed] [Google Scholar]
- Kaul M., Lipton S.A. Mechanisms of neuronal injury and death in HIV-1 associated dementia. Curr. HIV Res. 2006;4(3):307–318. doi: 10.2174/157016206777709384. [DOI] [PubMed] [Google Scholar]
- Kumar A.M. Human immunodeficiency virus type 1 in the central nervous system leads to decreased dopamine in different regions of postmortem human brains. J. Neurovirol. 2009;15(3):257–274. doi: 10.1080/13550280902973952. [DOI] [PMC free article] [PubMed] [Google Scholar]
- Kumar A.M. Human immunodeficiency virus infection in the CNS and decreased dopamine availability: relationship with neuropsychological performance. J. Neurovirol. 2011;17(1):26–40. doi: 10.1007/s13365-010-0003-4. [DOI] [PubMed] [Google Scholar]
- Lancelot S. A multi-atlas based method for automated anatomical rat brain MRI segmentation and extraction of PET activity. PLoS One. 2014;9(10) doi: 10.1371/journal.pone.0109113. [DOI] [PMC free article] [PubMed] [Google Scholar]
- Lau J.C. Longitudinal neuroanatomical changes determined by deformation-based morphometry in a mouse model of Alzheimer's disease. NeuroImage. 2008;42(1):19–27. doi: 10.1016/j.neuroimage.2008.04.252. [DOI] [PubMed] [Google Scholar]
- Lee D.E. Imaging dopaminergic dysfunction as a surrogate marker of neuropathology in a small-animal model of HIV. Mol. Imaging. 2014;13:1–10. doi: 10.2310/7290.2014.00031. [DOI] [PMC free article] [PubMed] [Google Scholar]
- Lee D.E. Lack of neuroinflammation in the HIV-1 transgenic rat: an [(18)F]-DPA714 PET imaging study. J. Neuroinflammation. 2015;12(1):171. doi: 10.1186/s12974-015-0390-9. [DOI] [PMC free article] [PubMed] [Google Scholar]
- Lentz M.R. Diffusion tensor and volumetric magnetic resonance measures as biomarkers of brain damage in a small animal model of HIV. PLoS One. 2014;9(8) doi: 10.1371/journal.pone.0105752. [DOI] [PMC free article] [PubMed] [Google Scholar]
- Li J. An automatic rat brain extraction method based on a deformable surface model. J. Neurosci. Methods. 2013;218(1):72–82. doi: 10.1016/j.jneumeth.2013.04.011. [DOI] [PubMed] [Google Scholar]
- Liu X. Methamphetamine-induced behavioral sensitization is enhanced in the HIV-1 transgenic rat. J. NeuroImmune Pharmacol. 2009;4(3):309–316. doi: 10.1007/s11481-009-9160-8. [DOI] [PubMed] [Google Scholar]
- Lorenzo-Valdés M. Segmentation of 4D cardiac MR images using a probabilistic atlas and the EM algorithm. Med. Image Anal. 2004;8(3):255–265. doi: 10.1016/j.media.2004.06.005. [DOI] [PubMed] [Google Scholar]
- Maheswaran S. Longitudinal regional brain volume changes quantified in normal aging and Alzheimer's APP × PS1 mice using MRI. Brain Res. 2009;1270:19–32. doi: 10.1016/j.brainres.2009.02.045. [DOI] [PubMed] [Google Scholar]
- McIntosh S. Increased sensitivity to cocaine self-administration in HIV-1 transgenic rats is associated with changes in striatal dopamine transporter binding. J. NeuroImmune Pharmacol. 2015;10(3):493–505. doi: 10.1007/s11481-015-9594-0. [DOI] [PMC free article] [PubMed] [Google Scholar]
- Moran L.M. Adolescent HIV-1 transgenic rats: evidence for dopaminergic alterations in behavior and neurochemistry revealed by methamphetamine challenge. Curr. HIV Res. 2012;10(5):415–424. doi: 10.2174/157016212802138788. [DOI] [PMC free article] [PubMed] [Google Scholar]
- Moran L.M., Booze R.M., Mactutus C.F. Time and time again: temporal processing demands implicate perceptual and gating deficits in the HIV-1 transgenic rat. J. NeuroImmune Pharmacol. 2013;8(4):988–997. doi: 10.1007/s11481-013-9472-6. [DOI] [PMC free article] [PubMed] [Google Scholar]
- Moran L.M. Neurobehavioral alterations in HIV-1 transgenic rats: evidence for dopaminergic dysfunction. Exp. Neurol. 2013;239:139–147. doi: 10.1016/j.expneurol.2012.10.008. [DOI] [PMC free article] [PubMed] [Google Scholar]
- Nesil T. Nicotine attenuates the effect of HIV-1 proteins on the neural circuits of working and contextual memories. Mol. Brain. 2015;8:43. doi: 10.1186/s13041-015-0134-x. [DOI] [PMC free article] [PubMed] [Google Scholar]
- Oguz I. RATS: Rapid Automatic Tissue Segmentation in rodent brain MRI. J. Neurosci. Methods. 2014;221:175–182. doi: 10.1016/j.jneumeth.2013.09.021. [DOI] [PMC free article] [PubMed] [Google Scholar]
- Pang X. Regional variations of antioxidant capacity and oxidative stress responses in HIV-1 transgenic rats with and without methamphetamine administration. J. NeuroImmune Pharmacol. 2013;8(3):691–704. doi: 10.1007/s11481-013-9454-8. [DOI] [PMC free article] [PubMed] [Google Scholar]
- Paxinos G., Watson C. Academic Press; London: 2007. The Rat Brain in Stereotaxic Coordinates. [Google Scholar]
- Peng J. The HIV-1 transgenic rat as a model for HIV-1 infected individuals on HAART. J. Neuroimmunol. 2010;218(1–2):94–101. doi: 10.1016/j.jneuroim.2009.09.014. [DOI] [PubMed] [Google Scholar]
- Pfefferbaum A. Accelerated aging of selective brain structures in human immunodeficiency virus infection: a controlled, longitudinal magnetic resonance imaging study. Neurobiol. Aging. 2014;35(7):1755–1768. doi: 10.1016/j.neurobiolaging.2014.01.008. [DOI] [PMC free article] [PubMed] [Google Scholar]
- Rattray I. Correlations of behavioral deficits with brain pathology assessed through longitudinal MRI and histopathology in the R6/2 mouse model of HD. PLoS One. 2013;8(4) doi: 10.1371/journal.pone.0060012. [DOI] [PMC free article] [PubMed] [Google Scholar]
- Reid W. An HIV-1 transgenic rat that develops HIV-related pathology and immunologic dysfunction. Proc. Natl. Acad. Sci. 2001;98(16):9271–9276. doi: 10.1073/pnas.161290298. [DOI] [PMC free article] [PubMed] [Google Scholar]
- Reid W. An HIV-1 transgenic rat that develops HIV-related pathology and immunologic dysfunction. Proc. Natl. Acad. Sci. U. S. A. 2001;98(16):9271–9276. doi: 10.1073/pnas.161290298. [DOI] [PMC free article] [PubMed] [Google Scholar]
- Reid W.C. Neurobehavioral abnormalities in the HIV-1 transgenic rat do not correspond to neuronal hypometabolism on 18F-FDG-PET. PLoS One. 2016;11(3) doi: 10.1371/journal.pone.0152265. [DOI] [PMC free article] [PubMed] [Google Scholar]
- Reid W.C. Characterization of neuropathology in the HIV-1 transgenic rat at different ages. J. Neuroimmunol. 2016;292:116–125. doi: 10.1016/j.jneuroim.2016.01.022. [DOI] [PMC free article] [PubMed] [Google Scholar]
- Sarkar S. Age- and ethanol concentration-dependent effects of acute binge drinking in the HIV-1 transgenic rat. Alcohol. Clin. Exp. Res. 2013;37(Suppl. 1):E70–8. doi: 10.1111/j.1530-0277.2012.01860.x. [DOI] [PMC free article] [PubMed] [Google Scholar]
- Shiotsuki H. A rotarod test for evaluation of motor skill learning. J. Neurosci. Methods. 2010;189(2):180–185. doi: 10.1016/j.jneumeth.2010.03.026. [DOI] [PubMed] [Google Scholar]
- Silvers J.M. Neurotoxicity of HIV-1 Tat protein: involvement of D1 dopamine receptor. Neurotoxicology. 2007;28(6):1184–1190. doi: 10.1016/j.neuro.2007.07.005. [DOI] [PMC free article] [PubMed] [Google Scholar]
- Song G. Nicotine mediates expression of genes related to antioxidant capacity and oxidative stress response in HIV-1 transgenic rat brain. J. Neurovirol. 2016;22(1):114–124. doi: 10.1007/s13365-015-0375-6. [DOI] [PMC free article] [PubMed] [Google Scholar]
- Szeto E.R. Cerebral perfusion scanning in treating AIDS dementia: a pilot study. J. Nucl. Med. 1998;39(2):298–302. [PubMed] [Google Scholar]
- Tatem K.S. Behavioral and locomotor measurements using an open field activity monitoring system for skeletal muscle diseases. J. Vis. Exp. 2014;91:51785. doi: 10.3791/51785. [DOI] [PMC free article] [PubMed] [Google Scholar]
- Towgood K.J. Regional cerebral blood flow and FDG uptake in asymptomatic HIV-1 men. Hum. Brain Mapp. 2013;34(10):2484–2493. doi: 10.1002/hbm.22078. [DOI] [PMC free article] [PubMed] [Google Scholar]
- Valdes Hernandez P.A. An in vivo MRI template set for morphometry, tissue segmentation, and fMRI localization in rats. Front. neuroinform. 2011;5:26. doi: 10.3389/fninf.2011.00026. [DOI] [PMC free article] [PubMed] [Google Scholar]
- Vigorito M., LaShomb A.L., Chang S.L. Spatial learning and memory in HIV-1 transgenic rats. J. NeuroImmune Pharmacol. 2007;2(4):319–328. doi: 10.1007/s11481-007-9078-y. [DOI] [PubMed] [Google Scholar]
- Vigorito M. Acquisition and long-term retention of spatial learning in the human immunodeficiency virus-1 transgenic rat: effects of repeated nicotine treatment. J. Neurovirol. 2013;19(2):157–165. doi: 10.1007/s13365-013-0154-1. [DOI] [PMC free article] [PubMed] [Google Scholar]
- Vigorito M., Connaghan K.P., Chang S.L. The HIV-1 transgenic rat model of neuroHIV. Brain Behav. Immun. 2015:336–349. doi: 10.1016/j.bbi.2015.02.020. [DOI] [PMC free article] [PubMed] [Google Scholar]
- Walsh R.N., Cummins R.A. The open-field test: a critical review. Psychol. Bull. 1976;83(3):482. [PubMed] [Google Scholar]
- Ward B. Longitudinal brain MRI study in a mouse model of Rett syndrome and the effects of choline. Neurobiol. Dis. 2008;31(1):110–119. doi: 10.1016/j.nbd.2008.03.009. [DOI] [PubMed] [Google Scholar]
- Webb K.M. Evidence for developmental dopaminergic alterations in the human immunodeficiency virus-1 transgenic rat. J. Neurovirol. 2010;16(2):168–173. doi: 10.3109/13550281003690177. [DOI] [PMC free article] [PubMed] [Google Scholar]
- Wingo T. Interactive effects of ethanol and HIV-1 proteins on novelty-seeking behaviors and addiction-related gene expression. Alcohol. Clin. Exp. Res. 2016;40(10):2102–2113. doi: 10.1111/acer.13206. [DOI] [PMC free article] [PubMed] [Google Scholar]
- Woolley D.G. Homologous involvement of striatum and prefrontal cortex in rodent and human water maze learning. Proc. Natl. Acad. Sci. U. S. A. 2013;110(8):3131–3136. doi: 10.1073/pnas.1217832110. [DOI] [PMC free article] [PubMed] [Google Scholar]
- Yang Z. Modulation effect of HIV-1 viral proteins and nicotine on expression of the immune-related genes in brain of the HIV-1 transgenic rats. J. NeuroImmune Pharmacol. 2016;11(3):562–571. doi: 10.1007/s11481-016-9679-4. [DOI] [PMC free article] [PubMed] [Google Scholar]
- Yang Z. HIV-1 proteins influence novelty-seeking behavior and alter region-specific transcriptional responses to chronic nicotine treatment in HIV-1Tg rats. Nicotine Tob. Res. 2017;19(9):1024–1032. doi: 10.1093/ntr/ntx047. [DOI] [PMC free article] [PubMed] [Google Scholar]
- Zhang J. Longitudinal characterization of brain atrophy of a Huntington's disease mouse model by automated morphological analyses of magnetic resonance images. NeuroImage. 2010;49(3):2340–2351. doi: 10.1016/j.neuroimage.2009.10.027. [DOI] [PMC free article] [PubMed] [Google Scholar]