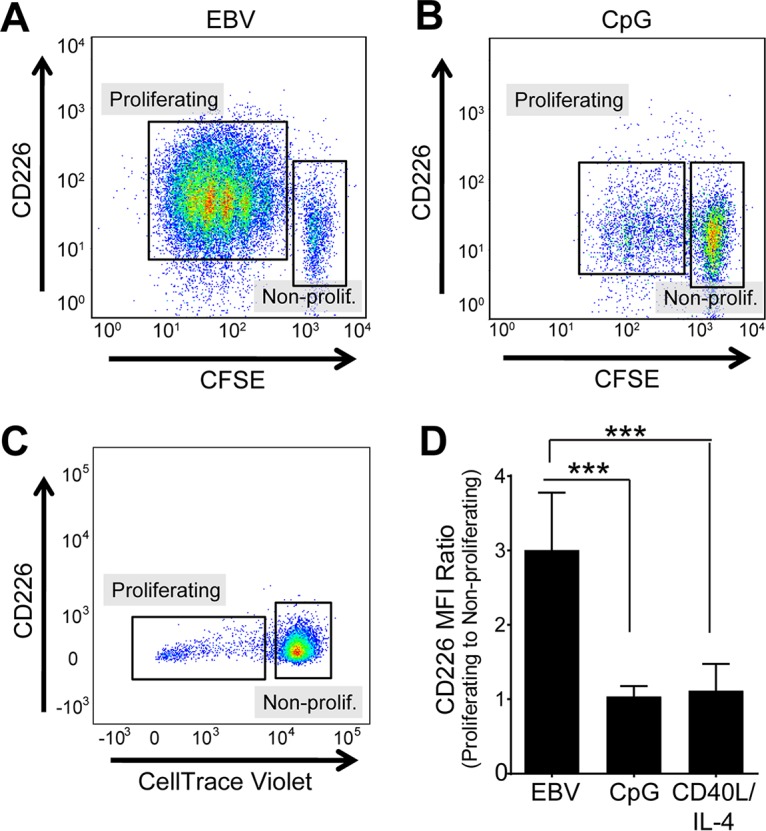
FIG 2 .

EBV, but not CpG DNA, upregulates CD226 upon cell proliferation. Representative flow cytometry plots of EBV-infected (A), CpG-activated (B), or CD40L/IL-4-activated B cells (C) at day 6 posttreatment/infection. Lower CFSE or CellTrace violet staining indicates proliferating cells. (D) CD226 mean fluorescence intensity (MFI) of proliferating population normalized to that of the nonproliferating population in EBV-infected (10 donors), CpG-activated (4 donors), and CD40L/IL-4-activated (4 donors) B cells. ***, P < 0.001 by one-way analysis of variance (ANOVA).
