Abstract
Background: Tumor vessels can potentially serve as diagnostic, prognostic and therapeutic targets for solid tumors. Fluorescent dyes are commonly used as biological indicators, while photobleaching seriously hinders their application. In this study, we aim to generate a fluorescent silica nanoparticles (FSiNPs) theranostic system marked by the mouse endgolin (mEND) aptamer, YQ26.
Methods: A highly specific YQ26 was selected by using gene-modified cell line-based SELEX technique. FSiNPs were prepared via the reverse microemulsion method. The YQ26-FSiNPs theranostic system was developed by combining YQ26 with the FSiNPs for in vivo tumor imaging, treatment and monitoring.
Results: Both in vitro experiments (i.e. cellular and tumor tissue targeting assays) and in vivo animal studies (i.e. in vivo imaging and antitumor efficacy of YQ26-FSiNPs) clearly demonstrated that YQ26-FSiNPs could achieve prominently high targeting efficiency and therapeutic effects via aptamer YQ26-mediated binding to endoglin (END) molecule.
Conclusion: This simple, sensitive, and specific YQ26-FSiNPs theranostic system has a great potential for clinical tumor targeting imaging and treatment.
Keywords: Endoglin, tumor neovasculature, aptamer, fluorescent silica nanoparticles.
Introduction
Tumor vessels provide oxygen, nutrients, and growth factors indispensable for continuing tumor growth, cancer progression, and survival 1. Without adequate blood vessels, tumor cells experience necrosis and/or programmed cell death and cannot exceed a critical size or metastasize to other organs 2. More importantly, anti-tumor drugs in effective quantities cannot be delivered to all areas of a tumor without ample supply of blood vessels. Tumor vessels mainly consist of endothelial cells and are distinct from their normal vessel counterparts with respect to morphology, organization, physiologic function, and the presence of distinct membranous epitopes 3. Hence, specific molecular features of tumor vessels can potentially serve as diagnostic and prognostic markers and therapeutic targets for solid tumors 4.
A homodimeric transmembrane glycoprotein, endoglin (END) or CD105, is a co-receptor of transforming growth factor-β (TGF-β) and plays an important role in the TGF-β signaling pathway 5. END has been shown to be highly expressed on the endothelial cells of tumor neovasculature but not on normal blood vessels 6. Previous studies have shown that END expression occurs in multiple solid tumor types and is closely associated with various clinicopathologic features, such as decreased survival, poor prognosis, and the presence of metastases 7, 8. Targeting END has been demonstrated to be efficacious in tumor-bearing mice 9. Several studies have reported that anti-CD105 monoclonal antibodies have therapeutic effects and inhibit the growth of tumor vasculature endothelial cells by promoting apoptosis, antibody-dependent cellular cytotoxicity, and activation of cytotoxic lymphocytes 10-12. However, antibody therapy has inherent limitations due to the complexity of preparation, its large size, immunogenicity, and high cost 13, 14 .
Aptamers are single-stranded DNA (ssDNA) or RNA sequences that are isolated by systematic evolution of ligands by exponential enrichment (SELEX) 15. The resulting sequences show binding specificity and high affinity for their respective targets, including peptides, ions, phospholipids, viruses, bacteria and even whole cells 16-19. Aptamers have several advantages including a richness in molecular targets, facile synthesis, good repeatability, flexibility, and convenience for long-term storage and transportation at room temperature 20. In particular, their small molecular weight, negative charge, and non-immunogenicity enable faster tissue penetration and uptake, high efficiency for target accumulation, as well as shorter retention time in blood and non-targeting tissues 21. These advantages make aptamers potential tools to be used for in vivo imaging of cancer 22. In recent years, Cell-SELEX, a modified SELEX procedure, has been used for selecting aptamers against whole living cells by obtaining target molecules from unknown complex species 23. This method has been used to select aptamers for specific cancers 24-28.
Fluorescent dyes are commonly used as biological indicators, although photobleaching seriously hinders their application 29. In recent years, fluorescent nanomaterials have played an increasingly important role in many fields such as separation, bioanalysis, and diagnosis and treatment of diseases 30. Many studies have shown that dye molecules entrapped in nanometer material shells could not only prevent the dyes from photobleaching, but also play a role in signal amplification 31. Core-shell fluorescent nanoparticles, like fluorescent silica nanoparticles (FSiNPs), have attracted much attention due to their advantages of a unique core-shell structure, tunable size, easy separation, facile surface modification, excellent biocompatibility, good hydrophilic property, signal amplification, and preventing nuclease degradation of DNA, which make them quite suitable for an ideal diagnostic imaging agent 32-35.
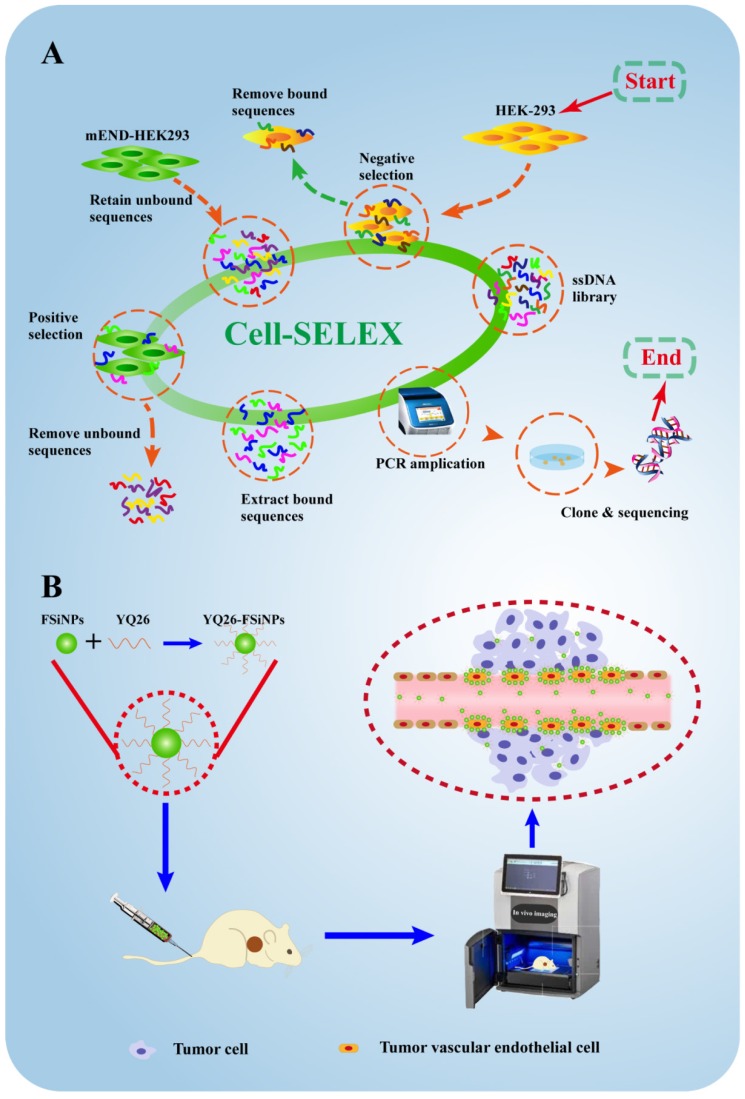
Motivated by the excellent properties of aptamers and FSiNPs, this study was designed to first identify a DNA aptamer against mouse END (mEND) and subsequently develop the aptamer-modified FSiNPs for targeting tumor vessels both in vitro and in vivo. First, as shown in Figure 1A, we used an engineered gene-modified cell line, mEND-HEK293, harboring the eukaryotic expression vector with the cDNA sequence of targeting molecule mEND for Cell-SELEX. Thus, the positive and negative screening cells only differed in the expression of one target molecule mEND making the aptamer screening highly specific and accurate, simplifying the subsequent screening steps. After 8 cycles of selection, the aptamer YQ26 was obtained that is capable of differentiating mEND-HEK293 from HEK293 cells. Next, aptamer YQ26 was conjugated to FSiNPs to form YQ26-FSiNPs for imaging tumor vessels (Figure 1B). The ability of YQ26-FSiNPs to specifically target tumor vessels was assessed using fluorescence imaging. To demonstrate YQ26-FSiNPs' therapeutic effect on tumors, antitumor experiments in vivo were carried out.
Figure 1.
Schematic illustration for selection and application of mouse endoglin aptamer. (A) The systematic evolution of DNA aptamers against mEND-HEK293 cells by Cell-SELEX. (B) The resulting aptamer YQ26 conjugated to near-infrared fluorescent silica nanoparticles for imaging tumor vessels.
Materials and Methods
Reagents
Cy5.5 NHS ester was bought from GE Healthcare (Piscataway, USA). 3-aminopropylmethyldimethoxysilane (APTMS), N-[(3-trimethoxysilyl) propyl] ethylenediamine triacetic acid trisodium salt (TMS-EDTA), n-hexanol, cyclohexane, Triton X-100, 1-ethyl-3-(3-dimethylaminopropyl) carbodiimide hydrochloride (EDC), ammonium hydroxide (NH4OH), tetraethyl orthosilicate (TEOS), and N-hydroxysulfosuccinimide sodium salt (NHS) were purchased from Sigma Chemical (St. Louis, USA). Yeast tRNA and BSA were provided by Fisher Scientific (Thermo Fisher Scientific Inc., USA). The DNA Sequences used in this work were bought from Sangon Biotech (Shanghai, China), and listed in Supplementary Table S1.
Cell lines and animal model
The human embryonic kidney cells HEK293, mouse melanoma cell line B16, mouse hepatoma cell line H22, and embryonic murine hepatocyte cell line BNL.CL2 were bought from American Type Culture Collection. The gene-modified mEND-HEK293 cell line was constructed through transfecting HEK293 cell line with the eukaryotic expression vector carrying the cloned sequence of mEND (Invitrogen Corporation, Carlsbad, CA, USA). Mouse tumor vascular endothelial cells (mTEC) were isolated as previously described 36. Briefly, mTEC was isolated from H22 tumor-bearing mice by magnetic mouse cell sorting kit with CD105 antibody (Miltenyi, Biotec, Tokyo, Japan). All cell lines were grown in a 5% CO2 atmosphere at 37℃. The growth medium for HEK293, mEND-HEK293, B16, BNL.CL2, and H22 was composed of DMEM enriched with 100 U/mL penicillin-streptomycin and 10% FBS. The culture medium of mEND-HEK293 was supplemented with 1 μg/mL puromycin for single cell-derived colony formation. mTEC were grown in Endothelial growth medium-2.
Four-week-old BALB/c mice were obtained from the Guangxi Laboratory Animal Center (Guangxi, China). All experiments were performed following the guidelines of European Federation of Laboratory Animal Science Association. The tumor model was established by subcutaneous injection of H22 cell line in the right flank of BALB/c mice. When the tumor volume reached 100 mm3, H22 tumor-bearing mice were used for in vitro and in vivo experiments. The protocols were approved by the Animal Ethics Committee of Guangxi Medical University (Guangxi, China).
SELEX library, primers, and buffers
The initial library was a 60-nucleotide randomized region (N60) flanked by 18 fixed nucleotide sequences used to hybridize PCR primers for subsequent rounds of amplification (5′-sense primer-N60-antisense primer-3′). These sense and antisense sequences are listed in Supplementary Table S1. The washing buffer contained Dulbecco`s PBS with 4.5 g/L of glucose and 5 mM of MgCl2. The binding buffer contained washing buffer with 0.1 mg/mL yeast tRNA and 1 mg/mL of BSA.
Cell-SELEX procedures
After being denatured for 5 min at 95°C and immediately cooled for 10 min on ice, the initial DNA library was added to 5 × 10⁶ mEND-HEK293 cells for incubation on ice for 60 min in a culture dish (100 mm × 20 mm). After removal of the supernatant, cells were harvested and resuspended in 500 μL of water. The mixture was heated at 95 °C for 5 min to collect cell-binding DNA sequences which were used as templates for PCR amplification. Then, the double-stranded DNA products were separated from the PCR solution using sepharose beads (GE Healthcare, USA), and followed by alkaline denaturation with 0.2 M of NaOH for the next round.
Starting from the 3rd round, the evolved DNA library was incubated with 1 × 10⁷ HEK293 cells in a culture dish for 60 min on ice as a negative selection. The unbound DNA library was incubated with mEND-HEK293 cells. To increase stringency during the selection process, the time of positive incubation was reduced (from 2 h to 1 h), while the negative incubation time was increased (from 1 h to 2 h). After 8 rounds, the enrichment pool was amplified, and then cloned into Escherichia coli by TA cloning kit (Invitrogen, USA). The cloned DNA fragments were sequenced by Sangon Biotech Co. Ltd (Shanghai, China).
Flow cytometric analysis
To measure the mouse CD105 expression, six different cell lines, including HEK293 cells, mEND-HEK293 cells, BNL.CL2 cells, H22 cells, B16 cells, and mTEC cells, were incubated with anti-mouse CD105-PE (eBioscience San Diego, CA, USA) in 1 mL PBS for 30 min, respectively. After incubation, each cell sample was resuspended in PBS for flow cytometric analysis (Beckman/Coulter Epic Elite flow cytometry, USA).
For monitoring the CD105 enrichment, 3 × 10⁵ mEND-HEK293 or HEK293 cells were incubated with selected library pools (250 nM) or aptamer candidates (250 nM) in binding buffer for 30 min at 4℃. To investigate the specificity of the aptamer, 3 × 10⁵ cells of each cell line were incubated with aptamer (250 nM) in binding buffer for 30 min at 4℃. The initial library sequences were used as the negative control. To determine the dissociation constant (Kd) of aptamers, mEND-HEK293 cells (3 × 10⁵) were incubated with aptamer of various concentrations in binding buffer for 30 min at 4℃.
After incubation, each cell sample was resuspended in washing buffer for flow cytometry. The Kd was determined by fluorescence intensity of binding vs the aptamer concentration using the saturation equation Y = B max X / (Kd + X) by SigmaPlot software. The binding assay for each cell sample was repeated three times.
Fluorescence microscopy imaging with aptamer YQ26
After 2 × 10⁵ mEND-HEK293 and HEK293 cells were seeded in a dish for 12 h, cells were incubated with 250 nM of Cy5.5-labeled aptamer YQ26 (Cy5.5-YQ26) or Cy5.5-labeled library sequence (Cy5.5-Lib) in binding buffer (1 mL) for 30 min on ice. After washing twice, the cells were immersed in polyoxymethylene (Sigma, USA) for 10 min, and then stained with DAPI (Life Co., USA) for 5 min. After washing twice, the cells were imaged by fluorescence microscopy (Nikon, Japan).
Frozen tumor tissue sections of 6 μm thickness were incubated with 250 nM of Cy5.5-YQ26 or Cy5.5-Lib for 30 min. Subsequently, tumor sections were stained with CD31 as described by using rat anti-mouse CD31 antibody (BD Biosciences, USA) and FITC-labeled donkey anti-rat IgG secondary antibody (Life Technologies, USA). After staining the nuclei with DAPI for 5 min, the cells were visually inspected by fluorescence microscopy.
Target type analysis
After washing three times, 3 × 10⁵ mEND-HEK293 cells were incubated with 0.05% trypsin-EDTA in PBS for 2 or 5 min. After another washing, the treated cells were incubated with 250 nM of aptamers for 30 min on ice and used for the aptamer-binding ability test by flow cytometry.
Effect of temperature on aptamers
To investigate the effect of temperature on aptamers, 3 × 10⁵ mEND-HEK293 cells were incubated with aptamers (250 nM) for 30 min at 4℃ or 37℃. The unselected initial library sequence was a control. All samples were analyzed by flow cytometry after washing twice.
Preparation of YQ26-FSiNPs
FSiNPs were prepared via the reverse microemulsion method reported by Arriagada 37. Briefly, a mixture of Cy5.5-NHS ester (5 mg) and APTMS (50 µL) in DMSO (1 mL) was stirred for 4 h to form Cy5.5-APTMS. FSiNPs were synthesized by mixing 150 µL of Cy5.5-APTMS, 1.77 mL of Triton X-100, 1.6 mL of n-hexanol, 7.5 mL of cyclohexane, and 500 µL of distilled water. After stirring for 30 min, 60 µL of NH4OH and 100 µL of TEOS were added with stirring for 24 h. Then, 30 µL of TMS-EDTA was added for 24 h while stirring to prepare carboxyl-functional FSiNPs (FSiNPs-COOH).
YQ26-NH2 was conjugated to FSiNPs-COOH as follows: FSiNPs-COOH (ca. 0.1 mg) was added to 950 µL of PBS, and then 1.8 mg of EDC, 3.5 mg of NHS, and 50 µL of 10 μM YQ26-NH2 were added to this solution. After shaking gently for 2 h, the solution was incubated with 0.05% BSA for blocking free carboxyl groups. After three rounds of centrifugation, YQ26-FSiNPs were collected and resuspended in PBS. Library sequence modified FSiNPs (Lib-FSiNPs) as a negative control was synthesized by the same method of preparation as YQ26- FSiNPs.
Characterization of YQ26-FSiNPs
The average size, zeta potential, and polydispersity index (PDI) of YQ26-FSiNPs were analyzed by a Zetasizer Nano instrument (Malvern, UK), while uniformity was determined using transmission electron microscopy (TEM, H-7650, Japan). The fluorescence emission spectrum (F-4600, HITACHI, Japan) was obtained, as well as UV-vis absorbance spectrum (Shimadzu, Japan). The functional groups of YQ26-FSiNPs were confirmed by FT-IR spectroscopy (Nicolet-5700, USA). The concentration of YQ26-FSiNPs was 0.1 mg/mL in all these measurements.
The aptamers conjugated on the FSiNPs surface were quantified by measurement of UV-vis absorbance of DNA at 260 nm 38. Briefly, initial absorbance (A1) was obtained immediately after mixing FSiNPs-COOH with YQ26-NH2. After completion of amide coupling of YQ26-NH2 to FSiNPs-COOH through the amino and carboxyl groups and centrifugation for 5 min at 10000 rpm, the absorbance (A2) of the supernatant was measured. After vacuum drying and dehydration, the precipitate particles were measured by net weight. The number of aptamers conjugated on FSiNPs (i.e. precipitate particles) can be determined by one minus the ratio A2/A1. The method of Pang et al can be used to calculate total moles of FSiNPs. Hence, the amount of aptamer YQ26 on a single FSNP was indirectly obtained from the actual number of aptamer YQ26 divided by the number of FSiNPs.
To investigate the effect of temperature on YQ26-FSiNPs, 3 × 10⁵ mEND-HEK293 cells were incubated with YQ26-FSiNPs (0.1 mg/mL) for 30 min at 4℃ or 37℃. Lib- FSiNPs was a control. All samples were analyzed by flow cytometry after washing twice.
To investigate different concentrations of Mg2+ on YQ26-FSiNPs, 3 × 10⁵ mEND-HEK293 cells were incubated with YQ26-FSiNPs (0.1 mg/mL) for 30 min at different concentrations of Mg2+ (1 mM, 2.5 mM, 5 mM, or 10 mM). Lib- FSiNPs was use as a control. All samples were analyzed by flow cytometry after washing twice.
Fluorescence microscopy imaging with YQ26-FSiNPs
After 2 × 10⁵ HEK293, mEND-HEK293 and mTEC cells seeded in a dish for 12 h, cells were incubated with 20 µL of Lib-FSiNPs or YQ26-FSiNPs (0.1 mg/mL) in binding buffer (1 mL) for 30 min on ice, and then stained with DAPI for 5 min. After washing twice, the cells were imaged by fluorescence microscopy.
Staining of tumor tissues with YQ26-FSiNPs (targeted group) or Lib-FSiNPs (non-targeted group) was evaluated based on fluorescence signal measurement as follows. 200 µL of YQ26-FSiNPs or Lib-FSiNPs (0.1 mg/mL) was intratumorally injected in H22 tumor-bearing mice 0.5 h before sample collection. Frozen tumor tissue sections of 6 μm thickness were also stained for endothelial marker CD31 as described in the fluorescence imaging of aptamer YQ26 section above. Cell nuclei were stained with DAPI for 5 min, and then visually inspected by fluorescence microscopy. Another group of tumor tissues was injected with 1 mg of unlabeled anti-mEND at 1 h before YQ26-FSiNPs administration to evaluate the mEND targeting specificity of YQ26-FSiNPs in vitro (i.e. blocking experiment).
In vivo imaging and biodistribution analysis
After the tumor volume reached about 100 mm3, the mice were randomly divided into three groups (n = 3/group), i.e. YQ26-FSiNPs (targeted group), Lib-FSiNPs (non-targeted group), and YQ26-FSiNPs after injection with 1 mg of unlabeled anti-mEND (blocking group). In vivo fluorescent images were acquired by multispectral fluorescence and X-ray (Ex/Em of 620 nm/700 nm, exposure time of 20 s, 4 × 4 binning and a field of 180 × 180 mm) using the Bruker imaging system (FXPro, Carestream Health, Inc., USA) at 0.5, 6, 24 and 48 h post-injection respectively. Mice were anesthetized with 3% isoflurane. 200 µL of YQ26-FSiNPs or Lib-FSiNPs (1 mg/mL) were injected into the tail vein. Mice were sacrificed by cervical dislocation at 24 h post-injection. After anatomization, tumor tissue and major organs were imaged using the in vivo imaging system. The fluorescence intensity of tumor and major organs was analyzed by the Bruker imaging system. Frozen tissue sections of dissected tumor and major organs were also imaged by fluorescence microscopy.
Treatment protocol, immunohistochemistry, and monitoring of antitumor efficacy
Female BALB/c mice were injected subcutaneously with 2 × 10⁶ H22 cells (day 0) into their right flank and were randomly divided into 4 groups (n = 6/group). On day 6 to day 10, 200 µL of PBS, or Lib-FSiNPs (1 mg), or aptamer YQ26 (5 nmol), or YQ26-FSiNPs (1 mg) were injected daily into the four groups by tail vein. The growth of implanted tumors was monitored every 5 days with a caliper and the tumor volume was calculated as 0.5 × length × width2. The growth of tumors and survival of tumor-bearing mice were measured.
At 20 days post inoculation, mice were sacrificed and tumors were removed for immunohistochemical assay. The tumor tissue sections were stained with rat anti-CD31 antibody (1:50; Abcam, Cambridge, MA, USA), or anti-Ki67 (1:200 dilution) and visualized after 3,3'-Diaminobenzidine (DAB) staining. Tumor apoptosis was determined by TUNEL analysis using in situ cell death detection kit-fluorescein (Roche Diagnostics; Hoffman-La Roche, Basel, Switzerland) according to the manufacturer's instruction. At least five different fields of the tumor were recorded, and image analysis was performed with Image-Pro Plus 5.0 software (Media Cybernetics, Bethesda, USA).
Three weeks after receiving different treatments (PBS, Lib-FSiNPs, YQ26, or YQ26-FSiNPs), mice were injected intravenously with 200 µL of YQ26-FSiNPs (1 mg/mL) for monitoring tumor efficacy. In vivo fluorescent images were acquired by multispectral fluorescence and X-ray at 0.5, 6, 24 and 48 h post-injection respectively.
Toxicity of YQ26-FSiNPs
CCK-8 assay was used to assess the cytotoxicity of the treatments 39. Four types of cell lines (HEK293, BNL-CL2, H22, and B16) were grown in 96-well plates (1.0 × 10⁴ cells/well) for 24 h. The cells were incubated with YQ26-FSiNPs for 24 or 48 h at a concentration of 0.1, 0.2, 0.5 or 1.0 mg/mL, respectively. After removal of the medium and washing cells three times with PBS, 10 µL of the CCK-8 was added to each well. After 4 h incubation, the absorbance at 450 nm of each well was recorded by DTX880 microplate reader (Beckman Coulter, USA).
Histology for major tissues, such as heart, lung, liver, spleen, and kidney, was obtained to assess in vivo toxicity of YQ26-FSiNPs. Nude mice received intravenous injection of 200 µL of YQ26-FSiNPs (10 mg/mL), Lib-FSiNPs (10 mg/mL) or PBS (control group). One week after the injection, sections of major organs were immersed in paraffin, sectioned at 4 µm, and stained with hematoxylin-eosin.
Statistical analyses
Data is expressed as mean ± SD. Differences among groups were compared by two-tailed Student's t-test and analysis of variance (ANOVA). GraphPad Prism 5 (San Diego, CA, USA) was used to carry out all statistical analyses, and P < 0.05 was considered the threshold of significance in all analyses.
Results
Selection of aptamers to recognize mEND
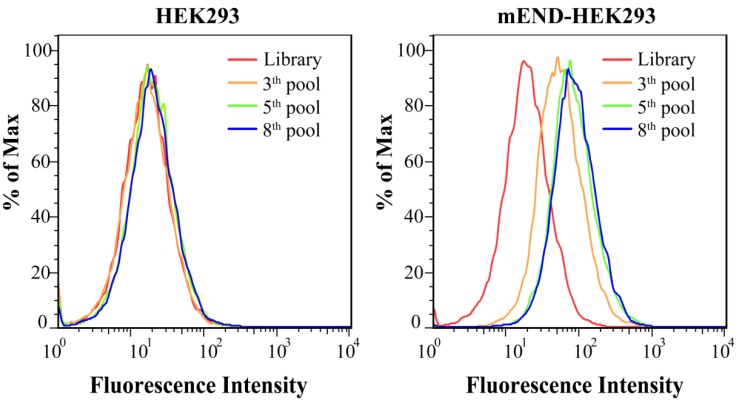
Figure S1 shows the expression of mEND of HEK293 cells, mEND-HEK293 cells, BNL.CL2 cells, H22 cells, B16 cells, and mTEC cells. Flow cytometric analysis of the normal HEK293 and gene-modified mEND-HEK293 cell lines revealed negative and positive expression, respectively, of mEND indicating that this pair of cell lines could be used for the selection of a mEND specific aptamer. Schematic illustration of the Cell-SELEX procedure is displayed in Figure 1A. After the 3rd round of selection, the ssDNA library pool was incubated with HEK293 cells. The unbound DNA sequences were collected and then incubated with mEND-HEK293 cells. The fluorescence intensity monitored by the flow cytometric analysis indicated cell-binding ability of the ssDNA sequences pool. As the number of selection cycles increased, a significant enhancement in fluorescence intensity was observed for mEND-HEK293 cells, but almost no change in fluorescence signal from HEK293 cells was observed (Figure 2), suggesting that DNA sequences were successfully enriched and bound to mEND-HEK293 cells. Therefore, the enriched DNA pool from the 8th selection cycle was sequenced with Illumina MiSeq (Sangon Biotech Co., Ltd. Shanghai, China).
Figure 2.
Binding assay of enriched ssDNA library and unselected library to HEK293 and mEND-HEK293 cells. The concentration of DNA sequences was 250 nM in all assays.
Binding ability of DNA aptamer
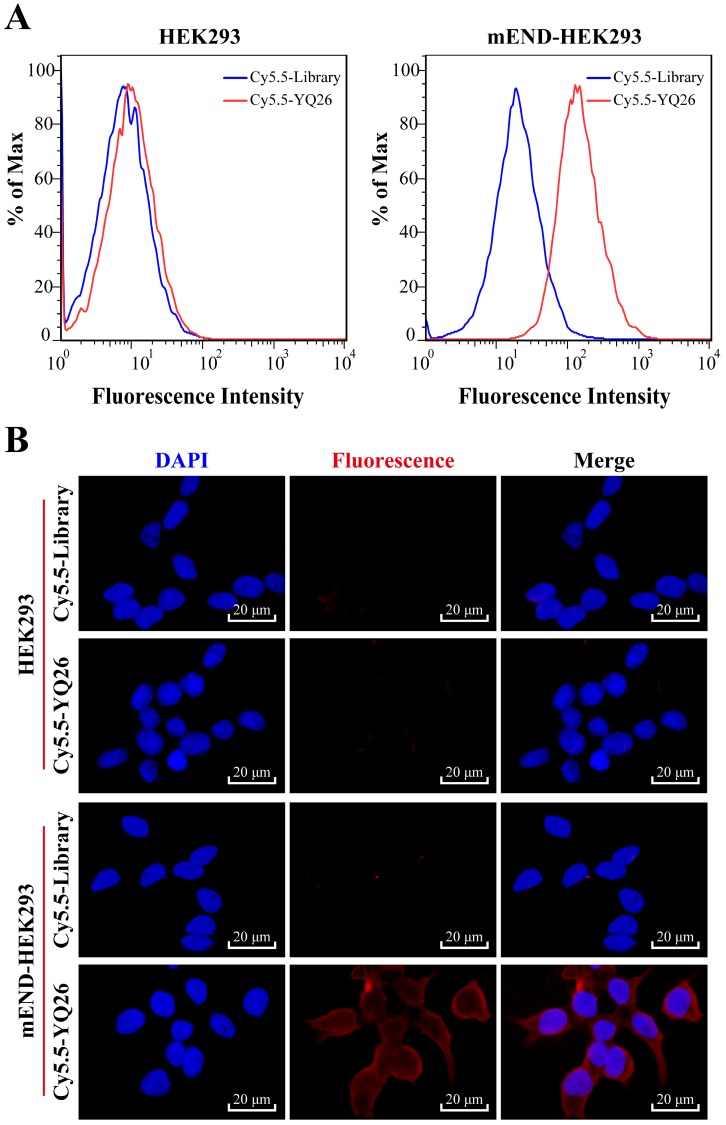
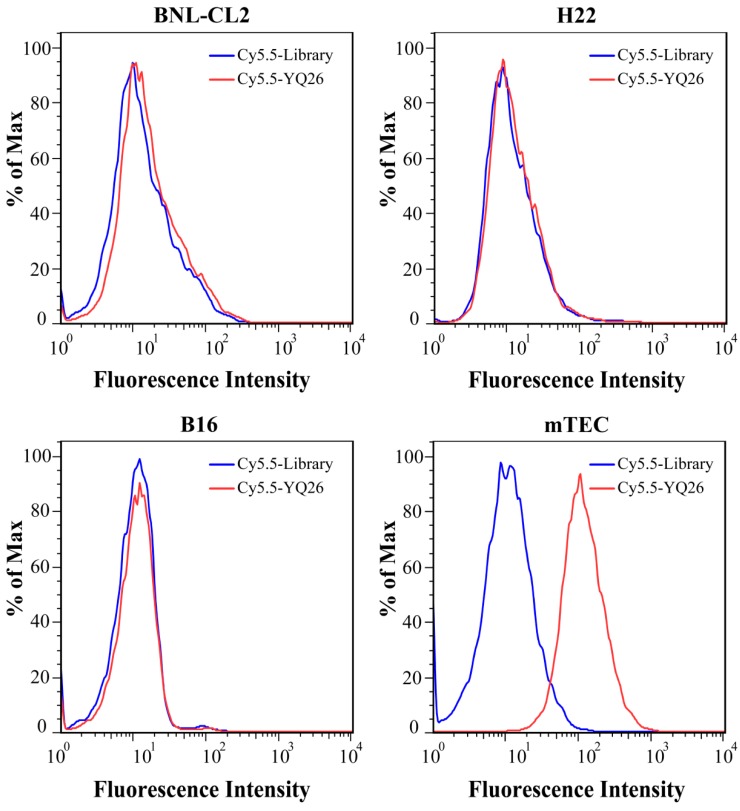
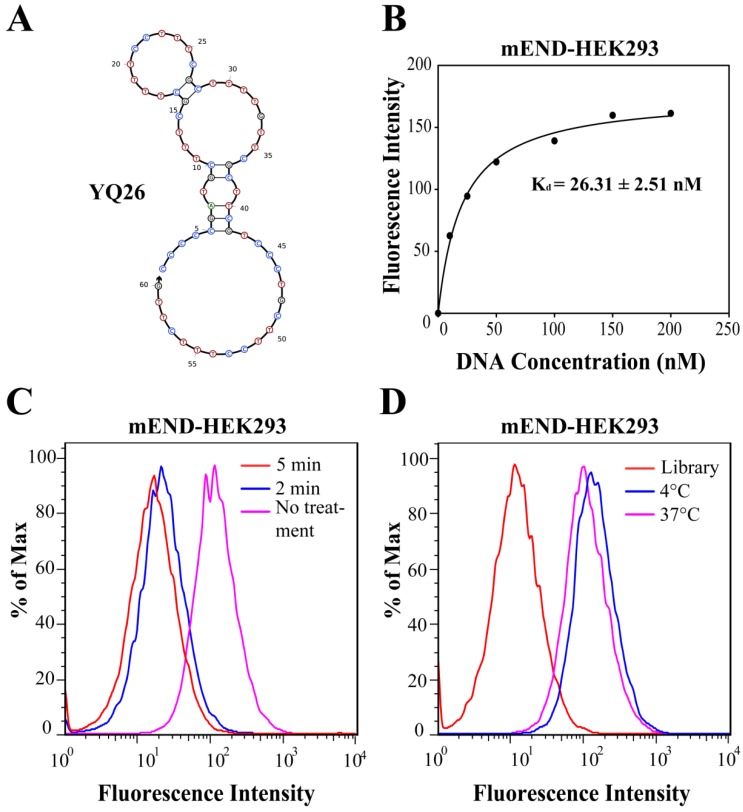
After sequencing, the DNA sequences (aptamer candidates) were divided into four families based on homogeneity, and four representative sequences, YQ26, YQ15, YQ23, and YQ30 were synthesized as aptamer candidates for further research. Supplementary Table S2 shows DNA sequences and Kd of aptamer candidates after truncating forward and reverse primers. The Kd of aptamer YQ26 was about 26.31 nM (lower than the Kd of YQ13, YQ23 or YQ30), indicating that the selected aptamer YQ26 could bind to target cells with the highest affinity. Using the library sequence as a control, both flow cytometry and fluorescence images illustrated that the aptamer YQ26 could bind to the target mEND-HEK293 cell line, but not to the negative control cell line HEK293 (Figure 3). Aptamer YQ26 did not show binding ability to cell lines without mEND expression, such as BNL-CL2, H22, and B16, but displayed specific binding to mTEC with mEND expression (Figure 4). As shown in Figure S2, aptamer YQ26 in the tumor section was primarily on the vessel (indicated by excellent coverage of green and red fluorescence signals, which stand for CD31 and Cy5.5-YQ26), while the Cy5.5 labeled library sequence showed no significant red fluorescence signal in the tumor section. These results further demonstrated that aptamer YQ26 could bind to mTEC cells with specific ability.
Figure 3.
(A) Flow cytometric assay and (B) Fluorescence images of binding of aptamer YQ26 to HEK293 and mEND-HEK293 cells. The unselected initial library (250 nM) was used as a control.
Figure 4.
Flow cytometric assay for the binding ability of aptamer YQ26 (250 nM, red line) on BNL-CL2, H22, B16 and mTEC cells.
Characterization of aptamer YQ26
The structure of YQ26 was predicted by Nupack as the main structure consisting of stems and loops (Figure 5A). The Kd of YQ26 was 26.31 ± 2.51 nM for mEND-HEK293 cells (Figure 5B) and 20.61 ± 2.20 nM for mTEC cells (Figure S3) determined by a transformation between fluorescence intensity and concentration using the SigmaPlot software, indicating that YQ26 show specific binding to mEND-HEK293 and mTEC cells with Kd in the nanomolar range. The targeting moiety of aptamer YQ26 was also characterized. mEND-HEK293 cells were incubated with trypsin for 2 or 5 min to digest extracellular domains of membrane proteins. The binding signal of FITC-labeled YQ26 was reduced proportionately with prolonged treatment of trypsin (Figure 5C), suggesting that the target of YQ26 was most likely an extracellular protein. There was little influence on the fluorescence intensity from target cells at 37°C or 4°C (Figure 5D), indicating that the YQ26 binding to mEND would not be affected at physiological temperature.
Figure 5.
Characterization of aptamer YQ26. (A) Secondary structure of aptamer YQ26 predicted by NUPACK. (B) Dissociation constant of aptamer YQ26 for mEND-HEK293 cells. (C) Binding of aptamer YQ26 to trypsin-treated mEND-HEK293 cells. (D) Binding of aptamer YQ26 to mEND-HEK293 cells at 4°C and 37°C. The concentration of DNA sequences was 250 nM in all assays.
Characterization of YQ26-FSiNPs
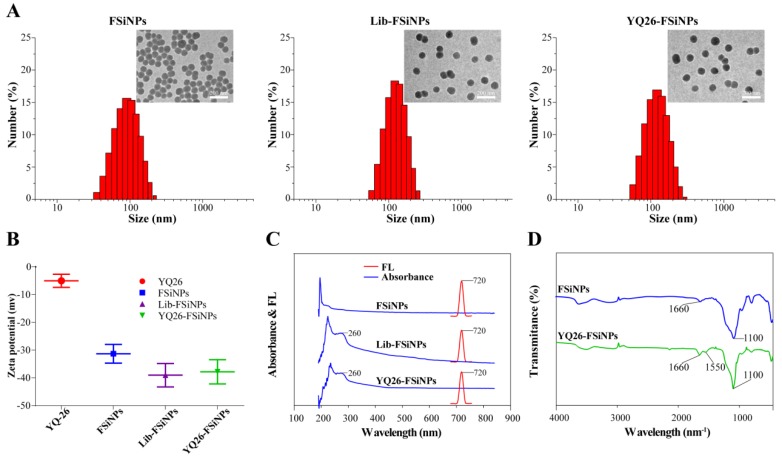
The average diameter was estimated to be 70.72 ± 2.62 nm, 76.34 ± 3.89, and 75.87 ± 4.12 for FSiNPs, Lib-FSiNPs, and YQ26-FSiNPs, respectively; The corresponding PDIs were 0.131 ± 0.023, 0.103 ± 0.016, and 0.099 ± 0.010; The corresponding zeta potentials were -31.32 ± 3.38, -39.04 ± 4.23 and -37.82 ± 4.38 mV (Table S3). According to the total number of aptamers conjugated on FSiNPs and the conversion between mass and mol for nanoparticles 31, we estimated that approximately 360 aptamers were conjugated on a single FSiNP (Table S3).
The FSiNPs, Lib-FSiNPs, and YQ26-FSiNPs were characterized by dynamic light scattering (DLS) and TEM (Figure 6A). The results indicated that all three FSiNPs were uniform, monodisperse spherical nanoparticles; the corresponding TEM showed that the negative charge from DNA sequences could increase the electrostatic repulsion between the nanoparticles, which made Lib-FSiNPs and YQ26-FSiNPs better dispersed than FSiNPs. The additional negative charge from DNA sequences made the zeta potential of Lib-FSiNPs or YQ26-FSiNPs more negative than that of FSiNPs (Figure 6B). The UV-vis spectrum of Lib-FSiNPs and YQ26-FSiNPs showed an absorbance peak of DNA at 260 nm that was absent in the spectrum of FSiNPs, indicating successful conjugation of the aptamer to the nanoparticles (Figure 6C). The fluorescence emission spectra of FSiNPs, Lib-FSiNPs, and YQ26-FSiNPs illustrated an identical emission peak at 720 nm, suggesting that the aptamer conjugation did not change the fluorescence property of FSiNPs. The FT-IR spectra for YQ26-FSiNPs and FSiNPs displayed peaks at 1100 cm-1 corresponding to Si-O stretching vibrations, and 1660 cm-1 corresponding to C=O carbonyl stretching vibrations (Figure 6D). The peaks around 1550 cm-1 were the feature of amides II obtained from N-H bending and C-N stretching vibrations 40. The peak at 1550 cm-1 was only present for YQ26-FSiNPs, indicating that aptamer YQ26 labeled with an amine group was successfully modified on the surface of FSiNPs-COOH (Figure 6D).
Figure 6.
Characterization of YQ26-FSiNPs. (A) Size distribution and transmission electron micrographs (inset) of FSiNPs, Lib-FSiNPs, and YQ26-FSiNPs. Scale bar = 200 nm. (B) Zeta potential of aptamer YQ26, FSiNPs, Lib-FSiNPs and YQ26-FSiNPs. (C) UV-Vis absorbance (blue line) and fluorescence emission spectra (red line) of FSiNPs, Lib-FSiNPs, and YQ26-FSiNPs. (D) FT-IR spectra of FSiNPs and YQ26-FSiNPs.
Figure S4 (A) and (B) show the effect of temperature and concentration of Mg2+ on YQ26-FSiNPs in capturing mTEC cells. There was no significant shift in fluorescence intensity from mTEC cells at 4°C or 37°C, indicating that the binding ability of YQ26-FSiNPs to mEND would not be affected at physiological temperature. When the concentration of Mg2+ was 2.5 mM, the maximum shift in fluorescence intensity was observed, indicating that YQ26-FSiNPs had the best binding ability to target cells at a Mg2+ concentration of 2.5 mM.
Binding ability of YQ26-FSiNPs
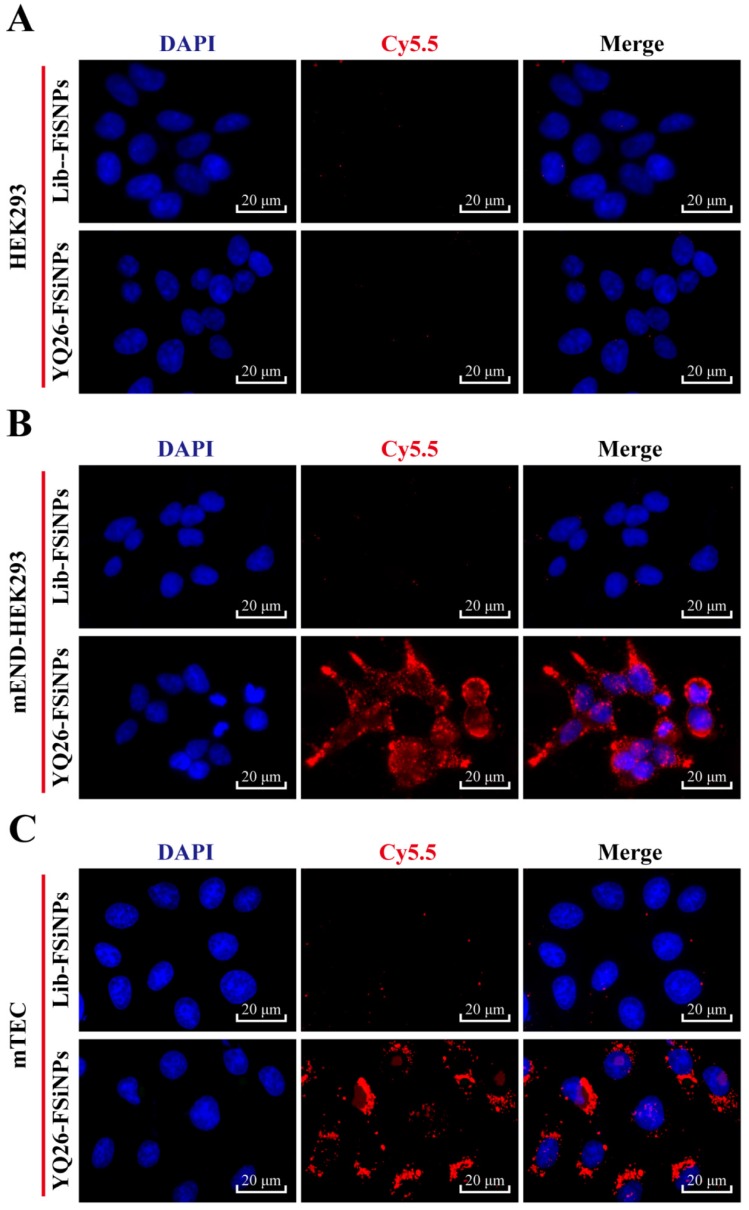
To determine whether the YQ26-FSiNPs can specifically recognize and bind mEND molecule, mEND-HEK293 and mTEC cells (i.e. mEND positive cells) were incubated with Lib-FSiNPs or YQ26-FSiNPs for fluorescence microscopy. HEK293 cells (i.e. mEND negative cells) were used as a control. Almost no fluorescence signal was observed for Lib-FSiNPs or YQ26-FSiNPs staining of HEK293 cells (Figure 7A). However, YQ26-FSiNPs stained the surfaces of mEND-HEK293 and mTEC cells with strong red fluorescence signal, while Lib-FSNPs did not (Figure 7B, C). These results indicate that YQ26-FSiNPs could specifically recognize and bind cell lines with mEND expression.
Figure 7.
Fluorescence images of binding of YQ26-FSiNPs to (A) HEK293 cells, (B) mEND-HEK293 cells, and (C) mTEC cells.
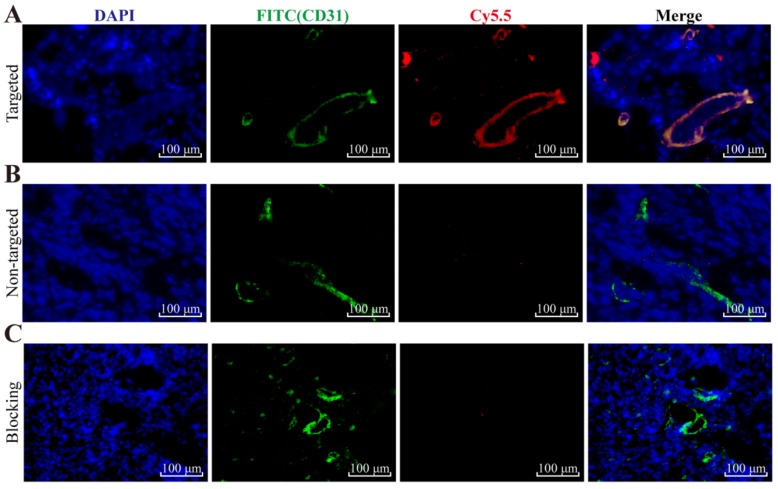
To further evaluate the mEND targeting specificity of YQ26-FSiNPs in tumor tissue, tumor tissue sections were stained for endothelial marker CD31 after reaction with YQ26-FSiNPs (targeted group) or Lib-FSiNPs (non-targeted group) or YQ26-FSiNPs with excess dose of anti-mEND (blocking group). As shown in Figure 8, tumor tissue sections in targeted, non-targeted, and blocking groups all showed green fluorescence signals representing CD31, indicating the presence of vascular endothelial cells in all tumor tissues. The targeted group showed an almost perfect overlay of red fluorescence signal for YQ26-FSiNPs staining and green fluorescence signal for CD31 (Figure 8A), while the non-targeted group showed weak and nonspecific red fluorescence for Lib-FSiNPs (Figure 8B). After blocking with anti-mEND, there was no significant red fluorescence signal for YQ26-FSiNPs staining of tumor tissue (Figure 8C). These results clearly demonstrated that YQ26-FSiNPs specifically recognize and bind tumor vasculature via mEND targeting.
Figure 8.
Immunofluorescence staining of tumor tissue slices for CD31 (green, with anti-mouse CD31 primary antibody) and (A) targeted group: YQ26-FSiNPs, (B) non-targeted group: Lib-FSiNPs, and (C) blocking group: YQ26-FSiNPs with excess dose of anti-mEND.
In vivo imaging and biodistribution of YQ26-FSiNPs
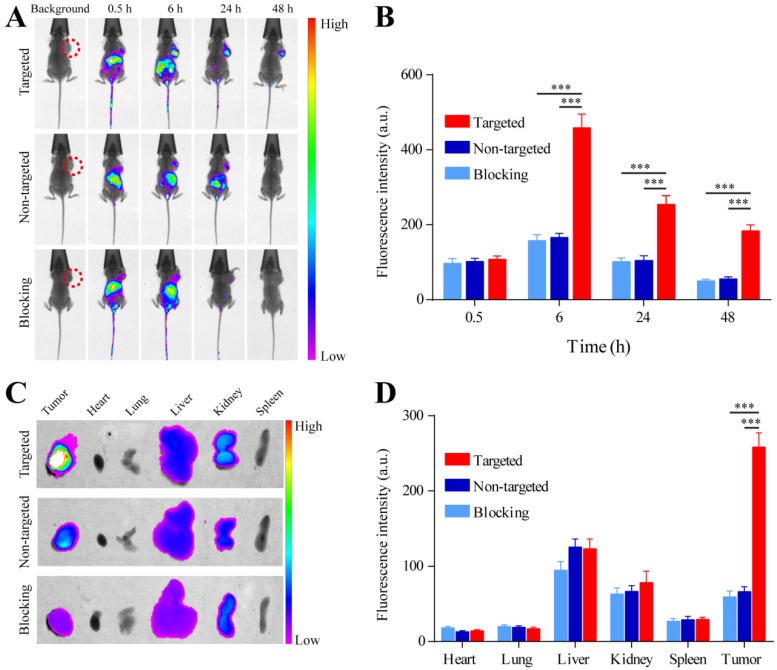
A whole animal near-infrared imaging system was used to study the in vivo distribution and tumor targeting of YQ26-FSiNPs. The in vivo distribution of fluorescent nanoparticles in targeted, non-targeted and blocking groups is displayed in Figure 9 (A) and (B). At 0.5 h post-injection, the fluorescent nanoparticles were distributed throughout the whole body in all groups, and a strong fluorescence signal was located in the abdomen. At 6 h post-injection, the fluorescence intensity in the abdomen began to wane, while fluorescence signal began to accumulate at the tumor site. Moreover, the fluorescence signal at the tumor site of the targeted group was stronger than the non-targeted and blocking groups. At 24 h post-injection, the fluorescence signal at the tumor site of all groups decreased. Nevertheless, the tumor fluorescence signal of the targeted group was also significantly higher than that of the non-targeted and blocking groups. At 48 h post-injection, the fluorescence signal at the tumor site of the targeted group can still be observed and is stronger than the non-targeted and blocking groups, indicating that YQ26-FSiNPs has an in vivo targeting ability.
Figure 9.
In vivo imaging and biodistribution analysis of H22 tumor-bearing mice after intravenous injection of YQ26-FSiNPs (targeted group), Lib-FSiNPs (non-targeted group) and YQ26-FSiNPs with excess dose of anti-mEND (blocking group). (A) Time-lapse in vivo fluorescence images of tumor-bearing mice. The tumors are circled with a red dotted line. (B) Fluorescence intensity of tumors was quantified at indicated time points. (C) Ex vivo imaging of tumors and major organs after injection at 24 h. (D) Semiquantitative biodistribution of YQ26-FSiNPs, Lib-FSiNPs and YQ26-FSiNPs with excess dose of anti-mEND in tumor-bearing mice determined by the averaged fluorescence intensity of organs and tumors. *** P<0.001.
Figure 9 (C) and (D) shows the biodistribution of fluorescent nanoparticles at 24 h post-injection in the H22 xenograft, which further confirmed that YQ26-FSiNPs exhibited the highest tumor accumulation compared with Lib-FSiNPs and the blocking group. It also could be observed that the dissected liver and kidney exhibited fluorescence signal in all groups, while other organs had almost no signal. This situation may be explained by the fact that most NPs are metabolized in the liver and finally excreted in the urine 41, 42. Fluorescence images of tissue slices from dissected tumor and major organs also showed that higher tumor accumulation was displayed in the targeted group compared with the non-targeted and blocking groups, and that fluorescent nanoparticles were mainly metabolized by the liver and kidney (Figure S5).
In vivo antitumor efficacy of YQ26-FSiNPs
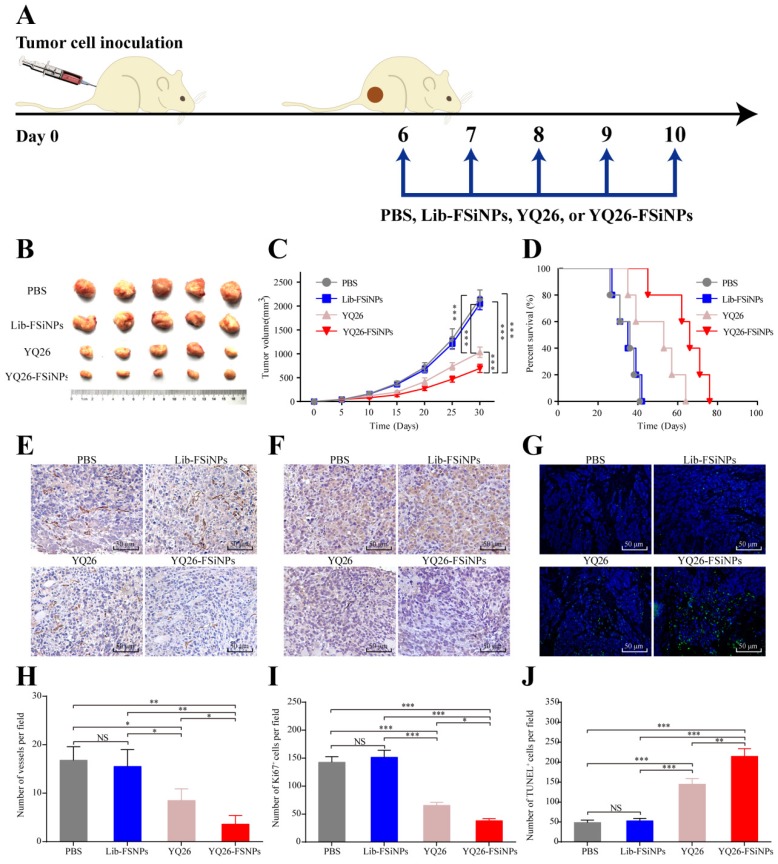
Anti-END monoclonal antibodies have been reported to suppress tumor growth and metastasis in tumor-bearing mice 12. Since aptamer YQ26 showed high affinity and specificity to END molecules, we hypothesized that both aptamer YQ26 and YQ26-FSiNPs were also capable of suppressing tumor growth. To test the antitumor effect of aptamer YQ26 and YQ26-FSiNPs, PBS and Lib-FSiNPs were set as the controls (Figure 10A). Compared with controls, both YQ26-FSiNPs and aptamer YQ26 alone significantly reduced tumor volumes and also prolonged mouse survival (Figure 10B-D). Moreover, YQ26-FSiNPs significantly delayed tumor growth and prolonged the survival of mice compared with aptamer YQ26 alone. Immunohistochemical assays of tumor sections showed that treatment with YQ26-FSiNPs significantly decreased microvessel density (Figure 10E and H), Ki67-positive cells (Figure 10F and I) and increased TUNEL positive cells (Figure 10G and J) compared with the other groups. These results demonstrate that YQ26-FSiNPs has the best in vivo antitumor efficacy.
Figure 10.
In vivo antitumor effect of YQ26-FSiNPs. (A) Schematic plan for the administration of PBS, Lib-FSiNPs, YQ26 or YQ26-FSiNPs. (B) Images of tumor. (C) Tumor volume. (D) Survival of tumor-bearing mice. Immunohistochemical imaging of tumor tissue sections after staining with (E) CD31, (F) Ki-67 and (G) TUNEL assay of apoptotic tumor cells; (H) Statistical analysis of blood vessel density by CD 31 antibody staining, (I) cell proliferation by Ki-67 antibody staining, (J) cell apoptosis by TUNEL. Values shown are mean ± SD; NS, not significant; *P < 0.05; **P < 0.01; ***P < 0.001.
Three weeks after receiving the different treatments, YQ26-FSiNPs was used to image the tumor in vivo again. As shown in Figure S6, fluorescence signal at the tumor site can be observed in all groups at 0.5, 6, 24 or 48 h post-injection, indicating that YQ26-FSiNPs can be used for monitoring tumors after treatment.
In vitro and in vivo toxicity of YQ26-FSiNPs
To evaluate the cytotoxicity of YQ26-FSiNPs, four different cell lines, i.e. HEK293, BNL-CL2, H22, and B16, were incubated with different concentrations of YQ26-FSiNPs. After incubation for 24 h, all cell lines displayed high viability, implying low cytotoxicity of YQ26-FSiNPs (Figure S7).
A histological assessment of tissues from major organs such as heart, lung, liver, spleen, and kidney was performed to investigate the in vivo toxicity of YQ26-FSiNPs associated with cellular shrinkage or blebbing, rupture of cell membranes, apoptotic bodies or necrosis. No significant difference was observed among three groups (PBS, Lib-FSiNPs, and YQ26-FSiNPs), confirming the low if any toxic effects of YQ26-FSiNPs (Figure S8).
Photostability of Cy5.5-YQ26 and YQ26-FSiNPs
Comparison of photostability between Cy5.5-YQ26 and YQ26-FSiNPs was also performed by fluorescence microscopy. Samples, Cy5.5-YQ26 or YQ26-FSiNPs, were illuminated with an intensive laser for 10 min at 650 nm, and images at 0, 1, 5, and 10 min were acquired. Image Pro software was used for quantifying fluorescence intensity. The fluorescence intensity of YQ26-FSiNPs was stronger than that of Cy5.5-YQ26 (Figure S9A). Normalized fluorescence intensities were also compared between Cy5.5-YQ26 and YQ26-FSiNPs. The fluorescence intensity of Cy5.5-YQ26 reduced by 82% after irradiation for 10 min, while YQ26-FSiNPs was decreased by only 19%, indicating that YQ26-FSiNPs are more photostable than Cy5.5-YQ26 (Figure S9B). This could be due to the fact that the fluorescent dyes were doped in the silica shell, separating quenching substances away from the dye molecules 31.
Discussion
Here, we used Gene-modified cell line-based SELEX to scan a specific DNA aptamer for mEND molecules. The resulting mEND aptamer YQ26 was conjugated with near-infrared FSNPs for the first time to develop the YQ26-FSNPs theranostic system, which exhibited high sensitivity and specificity for imaging tumor vasculature and enhanced the anti-tumor effect of aptamer YQ26 by inhibiting tumor angiogenesis. Moreover, this theranostic system can be used for monitoring tumors after treatment through specific enrichment of YQ26-FSNPs at the tumor site.
Aptamers labeled with organic fluorescent dyes often suffer from photobleaching and DNA sequence degradation in vivo, which severely hinders their application in bioanalysis 29, 31. To circumvent these limitations, we combined the YQ26 aptamer with FSiNPs to develop a novel photo- and DNA sequence-stable fluorescent probe for imaging tumor vasculature. The FSiNPs prepared in this study were monodisperse, spherical nanoparticles with uniform shape and size, as evidenced by DLS and TEM. Also, the results of UV-Vis, fluorescence emission spectra, and FT-IR of YQ26-FSiNPs confirmed that YQ26 aptamer was successfully conjugated on the surface of FSiNPs. YQ26-FSiNPs had an emission spectrum at 720 nm, making the near-infrared YQ26-FSiNPs a good diagnostic probe suitable for in vivo imaging. Compared to organic fluorescent dyes, stronger and more stable fluorescence intensity was observed from FSiNPs by photostability testing. Thus, YQ26-FSiNPs served as a highly sensitive probe for the detection of mEND due to both enrichment of the YQ26 aptamers and superior photostability of the nanoparticles.
In addition to binding to the target with high affinity and specificity, some aptamers have the ability to regulate biological pathways and interfere with disease progression by binding to target molecules involved in pathogenesis 43. For instance, the first aptamer for the treatment of diseases is anti-VEGF aptamer (Macugen), which has been approved by the U.S. Food and Drug Administration (FDA) for treatment of age-related macular degeneration 44. AS1411 is a G rich aptamer that can inhibit cell proliferation in a wide range of cancer cells by binding to the nucleolus 45. Tan and his colleagues reported that aptamer TY04 can inhibit the growth of multiple myeloma cells through cell cycle arrest. In this study, the results of in vivo antitumor effects showed that both aptamer YQ26 and YQ26-FSiNPs resulted in effective tumor treatment. Moreover, it was observed that both aptamer YQ26 and YQ26-FSiNPs resulted in lower tumor blood vessel density than treatment with PBS or Lib-FSiNPs. So, the possible mechanism of anti-tumor effect of this theranostic system is that aptamer YQ26 can interfere with the TGF-β pathway through binding to the membrane protein END of tumor vascular endothelial cells, resulting in inhibition of tumor angiogenesis. In addition, YQ26-FSiNPs had a more effective antitumor effect than aptamer YQ26 alone, as evidenced by the results of tumor size, tumor growth curve, survival of tumor-bearing mice, tumor blood vessel density, Ki-67, and TUNEL. This situation can be explained by the ability of YQ26-FSiNPs to prevent aptamer YQ26 from being degraded by nuclease in vivo and then bring more aptamer to the tumor site for a more effective antitumor effect.
The expression of END is almost exclusively on proliferating tumor endothelial cells, which makes it an ideal ligand for targeting tumor vasculature 5. At present, it is reported that there are some nanomaterials combined with END antibody for tumor targeted imaging and treatment. For example, reduced graphene oxide (RGO) was conjugated to the anti-CD105 antibody (TRC105) and labeled with 64Cu to form 64Cu-NOTA-RGO-TRC105 for tumor vasculature targeting and positron emission tomography (PET) imaging in living mice 46. TRC105 was also reported to be conjugated to the surface of 64Cu-labeling of mesoporous silica nanoparticles (mSiO2) for actively targeted PET imaging and drug delivery in tumor-bearing mice 47. For these nanoparticle conjugates, the preparation conditions were complex and the antibodies were immunogenic and not easy to preserve. In the present study, the synthesis of YQ26-FSiNPs is simple, and it is efficient for tumor vasculature imaging and treatment. Moreover, the aptamer YQ26 had high affinity and high specificity for END, no immunogenicity, easy modification, and it inhibited tumor angiogenesis. Based on these advantages, the YQ26-FSiNPs theranostic system has a great potential application in diagnosis and monitoring of therapy.
In summary, using gene-modified cell line-based SELEX technique, we have identified a highly specific aptamer YQ26 for the mEND molecule that can serve as a common target in solid tumors. By combining YQ26 with the excellent properties of FSiNPs, the YQ26-FSiNPs theranostic system was developed that provided not only high sensitivity and specificity for mEND in vitro and tumor vasculature in vivo but also an effective strategy for the treatment of tumors. Our study has clearly demonstrated the potential of the simple, sensitive, and specific YQ26-FSiNPs theranostic system for clinical tumor targeted imaging and treatment.
Supplementary Material
Supplementary figures and tables.
Acknowledgments
This work was supported, in part, by grants from Programs for Key Project of National Natural Scientific Foundation of China (No.81430055); Changjiang Scholars and Innovative Research Team in University (No.IRT_15R13); National Natural Scientific Foundation of China (Nos. 81372362, 81360335); International Cooperation Project of the Ministry of Science and Technology of China (No. 2015DFA31320); the Project of Science and Technology of Guangxi (Nos.14125008-2-12 and 1599005-2-10).
Abbreviations
- END
Endoglin
- mEND
mouse END
- SELEX
Systematic Evolution of Ligands by Exponential enrichment
- mEND-HEK293
mEND-expressing human embryonic kidney cells
- FSiNPs
Fluorescence silica nanoparticles
- ssDNA
single-stranded DNA
- APTMS
3-aminopropylmethyldimethoxysilane
- TMS-EDTA
N-[(3-trimethoxysilyl) propyl] ethylenediamine triacetic acid trisodium salt
- EDC
1-ethyl-3-(3-dimethylaminopropyl) carbodiimide hydrochloride
- NH4OH
ammonium hydroxide
- TEOS
tetraethyl orthosilicate
- NHS
N-hydroxysulfosuccinimide sodium salt.
References
- 1.Folkman J. Tumor angiogenesis: Therapeutic implications. N Engl J Med. 1971;285:1182–6. doi: 10.1056/NEJM197111182852108. [DOI] [PubMed] [Google Scholar]
- 2.De Palma M, Lewis CE. Macrophage regulation of tumor responses to anticancer therapies. Cancer Cell. 2013;23:277–86. doi: 10.1016/j.ccr.2013.02.013. [DOI] [PubMed] [Google Scholar]
- 3.Kerbel RS, Kamen BA. The anti-angiogenic basis of metronomic chemotherapy. Nat Rev Cancer. 2004;4:423–36. doi: 10.1038/nrc1369. [DOI] [PubMed] [Google Scholar]
- 4.Carmeliet P, Jain RK. Angiogenesis in cancer and other disease. Nature. 2000;407:249–57. doi: 10.1038/35025220. [DOI] [PubMed] [Google Scholar]
- 5.Fonsatti E, Nicolay HJ, Altomonte M, Covre A, Maio M. Targeting cancer vasculature via endoglin/CD105: a novel antibody-based diagnostic and therapeutic strategy in solid tumours. Cardiovasc Res. 2010;86:12–9. doi: 10.1093/cvr/cvp332. [DOI] [PubMed] [Google Scholar]
- 6.Minhajat R, Mori D, Yamasaki F, Sugita Y, Satoh T, Tokunaga O. Organ-specific endoglin (CD105) expression in the angiogenesis of human cancers. Pathol Int. 2006;56:717–23. doi: 10.1111/j.1440-1827.2006.02037.x. [DOI] [PubMed] [Google Scholar]
- 7.Dallas NA, Samuel S, Xia L, Fan F, Gray MJ, Lim SJ. et al. Endoglin (CD105): a marker of tumor vasculature and potential target for therapy. Clin Cancer Res. 2008;14:1931–7. doi: 10.1158/1078-0432.CCR-07-4478. [DOI] [PubMed] [Google Scholar]
- 8.Fonsatti E, Maio M. Highlights on endoglin (CD105): from basic findings towards clinical applications in human cancer. J Transl Med. 2004;2:18. doi: 10.1186/1479-5876-2-18. [DOI] [PMC free article] [PubMed] [Google Scholar]
- 9.Toi H, Tsujie M, Haruta Y, Fujita K, Duzen J, Seon BK. Facilitation of endoglin-targeting cancer therapy by development/utilization of a novel genetically engineered mouse model expressing humanized endoglin (CD105) Int J Cancer. 2015;136:452–61. doi: 10.1002/ijc.28994. [DOI] [PMC free article] [PubMed] [Google Scholar]
- 10.Matsuno F, Haruta Y, Kondo M, Tsai H, Barcos M, Seon BK. Induction of lasting complete regression of preformed distinct solid tumors by targeting the tumor vasculature using two new anti-endoglin monoclonal antibodies. Clin Cancer Res. 1999;5:371–82. [PubMed] [Google Scholar]
- 11.She X, Matsuno F, Harada N, Tsai H, Seon BK. Synergy between anti-endoglin (CD105) monoclonal antibodies and TGF-β in suppression of growth of human endothelial cells. Int J Cancer. 2004;108:251–7. doi: 10.1002/ijc.11551. [DOI] [PubMed] [Google Scholar]
- 12.Seon BK, Haba A, Matsuno F, Takahashi N, Tsujie M, She X. et al. Endoglin-Targeted Cancer Therapy. Curr Drug Deliv. 2011;8:135–43. doi: 10.2174/156720111793663570. [DOI] [PMC free article] [PubMed] [Google Scholar]
- 13.Schwartzberg LS. Clinical experience with edrecolomab: a monoclonal antibody therapy for colorectal carcinoma. Crit Rev Oncol Hematol. 2001;40:17–24. doi: 10.1016/s1040-8428(01)00131-7. [DOI] [PubMed] [Google Scholar]
- 14.Shigdar S, Lin J, Yu Y, Pastuovic M, Wei M, Duan W. RNA aptamer against a cancer stem cell marker epithelial cell adhesion molecule. Cancer Sci. 2011;102:991–8. doi: 10.1111/j.1349-7006.2011.01897.x. [DOI] [PubMed] [Google Scholar]
- 15.Ellington AD, Szostak JW. In vitro selection of RNA molecules that bind specific ligands. Nature. 1990;346:818–22. doi: 10.1038/346818a0. [DOI] [PubMed] [Google Scholar]
- 16.Rajendran M, Ellington AD. Selection of fluorescent aptamer beacons that light up in the presence of zinc. Anal Bioanal Chem. 2008;390:1067–75. doi: 10.1007/s00216-007-1735-8. [DOI] [PubMed] [Google Scholar]
- 17.Kumar PK, Machida K, Urvil PT, Kakiuchi N, Vishnuvardhan D, Shimotohno K. et al. Isolation of RNA aptamers specific to the NS3 protein of hepatitis C virus from a pool of completely random RNA. Virology. 1997;237:270–82. doi: 10.1006/viro.1997.8773. [DOI] [PubMed] [Google Scholar]
- 18.Hicke BJ, Marion C, Chang YF, Gould T, Lynott CK, Parma D. et al. Tenascin-C aptamers are generated using tumor cells and purified protein. J Biol Chem. 2001;276:48644–54. doi: 10.1074/jbc.M104651200. [DOI] [PubMed] [Google Scholar]
- 19.Bunka DH, Stockley PG. Aptamers come of age - at last. Nat Rev Microbiol. 2006;4:588–96. doi: 10.1038/nrmicro1458. [DOI] [PubMed] [Google Scholar]
- 20.Berezhnoy A, Castro I, Levay A, Malek TR, Gilboa E. Aptamer-targeted inhibition of mTOR in T cells enhances antitumor immunity. J Clin Invest. 2014;124:188–97. doi: 10.1172/JCI69856. [DOI] [PMC free article] [PubMed] [Google Scholar]
- 21.Shi H, He X, Wang K, Wu X, Ye X, Guo Q. et al. Activatable aptamer probe for contrast-enhanced in vivo cancer imaging based on cell membrane protein-triggered conformation alteration. Proc Natl Acad Sci USA. 2011;108:3900–5. doi: 10.1073/pnas.1016197108. [DOI] [PMC free article] [PubMed] [Google Scholar]
- 22.Schmidt KS, Borkowski S, Kurreck J, Stephens AW, Bald R, Hecht M. et al. Application of locked nucleic acids to improve aptamer in vivo stability and targeting function. Nucleic Acids Res. 2004;32:5757–65. doi: 10.1093/nar/gkh862. [DOI] [PMC free article] [PubMed] [Google Scholar]
- 23.Sefah K, Shangguan D, Xiong X, O'Donoghue MB, Tan W. Development of DNA aptamers using Cell-SELEX. Nat Protoc. 2010;5:1169–85. doi: 10.1038/nprot.2010.66. [DOI] [PubMed] [Google Scholar]
- 24.Yang X, Zhang X, Wang K, Wang Q, Tan Y, Guo Q. et al. Whole cell-SELEX aptamers for fluorescence staining of frozen hepatocellular carcinoma tissues. Anal Methods. 2014;6:3506–9. [Google Scholar]
- 25.Li X, Zhang W, Liu L, Zhu Z, Ouyang G, An Y. et al. In vitro selection of DNA aptamers for metastatic breast cancer cell recognition and tissue imaging. Anal Chem. 2014;86:6596–603. doi: 10.1021/ac501205q. [DOI] [PubMed] [Google Scholar]
- 26.Zhao Z, Xu L, Shi X, Tan W, Fang X, Shangguan D. Recognition of subtype non-small cell lung cancer by DNA aptamers selected from living cells. Analyst. 2009;134:1808–14. doi: 10.1039/b904476k. [DOI] [PubMed] [Google Scholar]
- 27.Kunii T, Ogura S, Mie M, Kobatake E. Selection of DNA aptamers recognizing small cell lung cancer using living cell-SELEX. Analyst. 2011;136:1310–2. doi: 10.1039/c0an00962h. [DOI] [PubMed] [Google Scholar]
- 28.Wu X, Zhao Z, Bai H, Fu T, Yang C, Hu X. et al. DNA Aptamer Selected against Pancreatic Ductal Adenocarcinoma for in vivo Imaging and Clinical Tissue Recognition. Theranostics. 2015;5:985–94. doi: 10.7150/thno.11938. [DOI] [PMC free article] [PubMed] [Google Scholar]
- 29.Wang QY, Kang YJ. Bioprobes Based on Aptamer and Silica Fluorescent Nanoparticles for Bacteria Salmonella typhimurium Detection. Nanoscale Res Lett. 2016;11:150. doi: 10.1186/s11671-016-1359-z. [DOI] [PMC free article] [PubMed] [Google Scholar]
- 30.Yao J, Yang M, Duan Y. Chemistry, Biology, and Medicine of Fluorescent Nanomaterials and Related Systems: New Insights into Biosensing, Bioimaging, Genomics, Diagnostics, and Therapy. Chem Rev. 2014;114:6130–78. doi: 10.1021/cr200359p. [DOI] [PubMed] [Google Scholar]
- 31.Cai L, Chen ZZ, Chen MY, Tang HW, Pang DW. MUC-1 aptamer-conjugated dye-doped silica nanoparticles for MCF-7 cells detection. Biomaterials. 2013;34:371–81. doi: 10.1016/j.biomaterials.2012.09.084. [DOI] [PubMed] [Google Scholar]
- 32.Zhao Y, Ye Y, Zhou X, Chen J, Jin Y, Hanson A. et al. Photosensitive fluorescent dye contributes to phototoxicity and inflammatory responses of dye-doped silica NPs in cells and mice. Theranostics. 2014;4:445–59. doi: 10.7150/thno.7653. [DOI] [PMC free article] [PubMed] [Google Scholar]
- 33.He XX, Wang K, Tan W, Liu B, Lin X, He C. et al. Bioconjugated Nanoparticles for DNA Protection from Cleavage. J Am Chem Soc. 2003;125:7168–9. doi: 10.1021/ja034450d. [DOI] [PubMed] [Google Scholar]
- 34.Rossi LM, Shi L, Quina FH, Rosenzweig Z. Stöber synthesis of monodispersed luminescent silica nanoparticles for bioanalytical assays. Langmuir. 2005;21:4277–80. doi: 10.1021/la0504098. [DOI] [PubMed] [Google Scholar]
- 35.Roy I, Ohulchanskyy TY, Bharali DJ, Pudavar HE, Mistretta RA, Kaur N. et al. Optical tracking of organically modified silica nanoparticles as DNA carriers: a nonviral, nanomedicine approach for gene delivery. Proc Natl Acad Sci USA. 2005;102:279–84. doi: 10.1073/pnas.0408039101. [DOI] [PMC free article] [PubMed] [Google Scholar]
- 36.Ohga N, Ishikawa S, Maishi N, Akiyama K, Hida Y, Kawamoto T. et al. Heterogeneity of tumor endothelial cells: comparison between tumor endothelial cells isolated from high- and low-metastatic tumors. Am J Pathol. 2012;180:1294–307. doi: 10.1016/j.ajpath.2011.11.035. [DOI] [PubMed] [Google Scholar]
- 37.Arriagada FJ, Osseo-Asare K. Synthesis of Nanosize Silica in a Nonionic Water-in-Oil Microemulsion: Effects of the Water/Surfactant Molar Ratio and Ammonia Concentration. J Colloid Interf Sci. 1999;211:210–20. doi: 10.1006/jcis.1998.5985. [DOI] [PubMed] [Google Scholar]
- 38.Savran CA, Knudsen SM, Ellington AD, Manalis SR. Micromechanical detection of proteins using aptamer-based receptor molecules. Anal Chem. 2004;76:3194–8. doi: 10.1021/ac049859f. [DOI] [PubMed] [Google Scholar]
- 39.Zhang Z, Wang L, Wang J, Jiang X, Li X, Hu Z. et al. Mesoporous Silica-Coated Gold Nanorods as a Light-Mediated Multifunctional Theranostic Platform for Cancer Treatment. Adv Mater. 2012;24:1418–23. doi: 10.1002/adma.201104714. [DOI] [PubMed] [Google Scholar]
- 40.Fahmy K, Jäger F, Beck M, Zvyaga TA, Sakmar TP, Siebert F. Protonation states of membrane-embedded carboxylic acid groups in rhodopsin and metarhodopsin II: a Fourier-transform infrared spectroscopy study of site-directed mutants. Proc Natl Acad Sci USA. 1993;90:10206–10. doi: 10.1073/pnas.90.21.10206. [DOI] [PMC free article] [PubMed] [Google Scholar]
- 41.Gao J, Chen K, Xie R, Xie J, Lee S, Cheng Z. et al. Ultrasmall near-infrared non-cadmium quantum dots for in vivo tumor imaging. Small. 2010;6:256–61. doi: 10.1002/smll.200901672. [DOI] [PMC free article] [PubMed] [Google Scholar]
- 42.He X, Nie H, Wang K, Tan W, Wu X, Zhang P. In vivo study of biodistribution and urinary excretion of surface-modified silica nanoparticles. Anal Chem. 2008;80:9597–603. doi: 10.1021/ac801882g. [DOI] [PubMed] [Google Scholar]
- 43.Zhu G, Ye M, Donovan MJ, Song E, Zhao Z, Tan W. Nucleic acid aptamers: an emerging frontier in cancer therapy. Chem Commun. 2012;48:10472–80. doi: 10.1039/c2cc35042d. [DOI] [PMC free article] [PubMed] [Google Scholar]
- 44.Gragoudas ES, Adamis AP, Cunningham ET Jr, Feinsod M, Guyer DR. Pegaptanib for neovascular age-related macular degeneration. Am J Ophthalmol. 2004;351:2805–16. doi: 10.1056/NEJMoa042760. [DOI] [PubMed] [Google Scholar]
- 45.Soundararajan S, Wang L, Sridharan V, Chen W, Courtenay-Luck N, Jones D. et al. Plasma membrane nucleolin is a receptor for the anticancer aptamer AS1411 in MV4-11 leukemia cells. Mol Pharmacol. 2009;76:984–91. doi: 10.1124/mol.109.055947. [DOI] [PMC free article] [PubMed] [Google Scholar]
- 46.Shi S, Yang K, Hong H, Valdovinos HF, Nayak TR, Zhang Y. et al. Tumor vasculature targeting and imaging in living mice with reduced graphene oxide. Biomaterials. 2013;34:3002–9. doi: 10.1016/j.biomaterials.2013.01.047. [DOI] [PMC free article] [PubMed] [Google Scholar]
- 47.Chen F, Hong H, Zhang Y, Valdovinos HF, Shi S, Kwon GS. et al. In vivo tumor targeting and image-guided drug delivery with antibody-conjugated, radiolabeled mesoporous silica nanoparticles. Acs Nano. 2013;7:9027–39. doi: 10.1021/nn403617j. [DOI] [PMC free article] [PubMed] [Google Scholar]
Associated Data
This section collects any data citations, data availability statements, or supplementary materials included in this article.
Supplementary Materials
Supplementary figures and tables.


