Abstract
The structural stability of proteins has been traditionally studied under conditions in which the folding/unfolding reaction is reversible, since thermodynamic parameters can only be determined under these conditions. Achieving reversibility conditions in temperature stability experiments has often required performing the experiments at acidic pH or other nonphysiological solvent conditions. With the rapid development of protein drugs, the fastest growing segment in the pharmaceutical industry, the need to evaluate protein stability under formulation conditions has acquired renewed urgency. Under formulation conditions and the required high protein concentration (~100 mg/mL), protein denaturation is irreversible and frequently coupled to aggregation and precipitation. In this article, we examine the thermal denaturation of hen egg white lysozyme (HEWL) under irreversible conditions and concentrations up to 100 mg/mL using several techniques, especially isothermal calorimetry which has been used to measure the enthalpy and kinetics of the unfolding and aggregation/precipitation at 12°C below the transition temperature measured by DSC. At those temperatures the rate of irreversible protein denaturation and aggregation of HEWL is measured to be on the order of 1 day−1. Isothermal calorimetry appears a suitable technique to identify buffer formulation conditions that maximize the long term stability of protein drugs.
Keywords: chemical denaturation, differential scanning calorimetry, irreversible denaturation, isothermal calorimetry, protein denaturation and aggregation
1 | INTRODUCTION
Temperature stability studies of proteins by differential scanning calorimetry or other techniques need to be performed under conditions of reversibility to be able to measure thermodynamic parameters.1–3 For many proteins, attaining folding/unfolding reversibility in temperature stability experiments has implied the use of buffers and pH values away from physiological conditions.4–6 Even the temperature folding/unfolding of small globular proteins like ribonuclease, lysozyme, cytochrome c, myoglobin, chymotrypsin becomes irreversible at physiological pH; in fact, most studies have been performed at acidic pH values.3,7 Nowadays, with the rapid development of biologics, that is, proteins as therapeutic drugs, structural stability and self-association or aggregation studies under physiological conditions, even if they are irreversible, have become necessary.8–11 In particular, structural stability and aggregation have become critical parameters in the development of biologics, especially monoclonal antibodies (the largest class of protein drugs), since dosage considerations require being formulated at 100 mg/mL or more.12–14 In the past, stability or aggregation studies have not been performed directly at the formulation concentrations of 100–200 mg/mL due to instrumental limitations.15 Usually, samples are incubated at the required high concentration and diluted immediately prior to DSC, fluorescence, size exclusion chromatography or light scattering measurements.16,17 It would be highly desirable to incorporate biophysical techniques that span the entire range of concentrations.
In this article, we present a systematic analysis of the structural stability of hen egg white lysozyme (HEWL) as a function of pH, especially at pH 9.0, a pH at which the transition is irreversible, kinetically controlled and coupled to aggregation. In these studies, we utilized differential scanning calorimetry, isothermal chemical denaturation and a novel application of isothermal calorimetry that allows direct measurements of the kinetics of denaturation/aggregation at concentrations higher than 100 mg/mL and temperatures well below the denaturation temperature. The ability of different types of calorimeters (isothermal titration calorimeters, isothermal calorimeters, etc) to measure kinetic processes has been demonstrated before in different laboratories.18–22 To measure the kinetics of slow irreversible protein denaturation/aggregation processes such as those occurring below their denaturation temperature,23 it is necessary to measure the rate of heat production or absorption (heat flow) over long periods of time, weeks or even months. Isothermal calorimeters24–26 are the best suited instruments to accomplish this task and has been used in this work.
2 | MATERIALS AND METHODS
2.1 | Proteins and reagents
Lysozyme from chicken egg white (HEWL) was purchased as a lyophilized powder from Sigma-Aldrich (cat. no. L6876, St. Louis, MO, USA) and was dissolved in one of the buffers listed below. The protein was then dialyzed overnight against buffer at the desired experimental pH before concentrating it to the desired experimental concentration using an Amicon Ultra-4 centrifugal filter (Merck Millipore, Cork, Ireland). Molecular grade GdnHCl was from Promega Corporation (Madison, WI, USA). All buffers were from Sigma-Aldrich, St. Louis, MO, USA.
2.2 | Differential scanning calorimetry
Thermal denaturation experiments were performed using a VP-DSC microcalorimeter from MicroCal/Malvern Instruments (Northamption, MA, USA). The dialyzed protein was diluted or concentrated to the desired experimental concentration in the range 0.2–15 mg/mL and thoroughly degassed prior to loading of the calorimetric cell having a volume of ~0.5 mL. The reference cell was filled with dialysis buffer. The buffers used were 30 mM glycine (pH 2–2.5), 30 mM sodium formate (pH 3–4.5), 30 mM sodium acetate (pH 5–5.5), 30 mM succinate (pH 6–6.5), 10 mM sodium phosphate (pH 7–7.5), 30 mM sodium phosphate (pH 8–9, reversibility studies), 20 mM bicine (pH 9). Thermal scans were conducted from 10 to 100°C at a rate of 1°C/min. Data collection, processing and analysis was performed with the software provided with the instrument.
2.3 | Isothermal calorimetry
Isothermal calorimetry experiments were performed using a TAM IV microcalorimeter system from TA Instruments (New Castle, DE, USA) equipped with six calorimeter channels. Protein solutions at ~150 mg/mL were dialyzed overnight against 50 mM bicine buffer (pH 9.0) and diluted to the experimental concentration of 100 mg/mL, 50 mg/mL, or 25 mg/mL. Experimental temperatures were chosen based on DSC results to monitor slow protein unfolding and aggregation below the transition temperature. The selected temperatures were 57, 58, and 59 °C which are about 12°C below Tm at that pH. To begin an experiment, an initial baseline was recorded for 30 minutes at the experimental temperature without any inserted sample ampoules. Cylindrical glass ampoules were filled with 1 mL of protein solutions or buffer, which were hermetically sealed with crimp caps. The ampoules were then inserted into each calorimetric channel to a position where they were allowed to equilibrate to the instrument temperature for 45 minutes before they were lowered into the measuring position. The signal was considered correct after another 45 minutes in the measuring position. The heat flow, dQ/dt, was recorded as a function of time until constant levels close to zero were reached for the samples (~ 6 days). The samples were then removed from the calorimeters and a final 30-min baseline was recorded. The baseline from the empty calorimeters were subtracted from the heat flow recorded from each ampoule. The signal from the ampoule containing only buffer was subtracted from the heat flow from the sample and the differential signal was normalized per mole of protein. The final signal was expressed as kcal/day/mol. Data collection and processing of raw data were performed using the software provided by the instrument. Analysis of the experimental data was performed using software developed in this laboratory and implemented in the DataFit software package (Oakdale Engineering, Oakdale, PA, USA).
2.4 | Isothermal chemical denaturation
All chemical denaturation experiments were performed using a HUNK chemical denaturation system equipped with fluorescence detector from Unchained Labs (Pleasanton, CA, USA). The excitation wavelength was 280 nm and emission intensity scans were recorded between 300 and 500 nm. The buffer used in the presence or absence of denaturant was 20 mM bicine (pH 9.0). For individual experiments, the instrument automatically added protein, buffer, and 7 M GdnHCl in 36 wells with a linear GdnHCl gradient from 0 to 6.4 M. The protein concentration is diluted 12.5-fold on addition to the wells; therefore, the protein stocks were prepared at concentrations to take this dilution into account. To ensure complete protein denaturation the fluorescence intensities were recorded after four hours of incubation with denaturant. Reversibility was demonstrated by performing renaturation experiments where the protein was first dissolved in 7 M GdnHCl before the instrument applied a linear dilution gradient using the experimental buffer. Data processing and analysis was performed using the software provided by the instrument. A general description of the technique has been described in detail by Pace27 and Bolen et al.28,29
3 | RESULTS AND DISCUSSION
3.1 | Differential scanning calorimetry
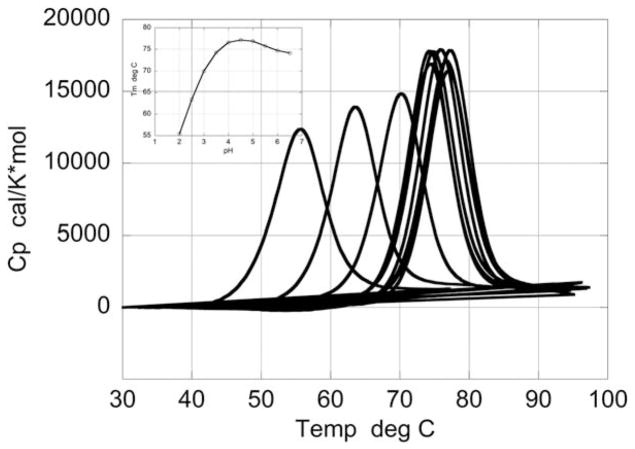
Figure 1 shows the temperature dependence of the excess heat capacity of HEWL in the pH range in which the denaturation transition is reversible (pH 2.0–6.5). The thermodynamic stability of HEWL under these conditions have been the subject of numerous studies.7,30–41 The thermodynamic parameters obtained under these conditions agree with those published earlier.33,35,37 For example, at pH 2.0 where the denaturation is centered at 55°C, the enthalpy obtained from the scan is 100.2 kcal/mol which is in excellent agreement with the previously published value of 102.5 kcal/mol at the same temperature.35,37 The enthalpy change increases with temperature with a ΔCp of 1.4 kcal/K*mol, consistent with previously published values. The transition temperature (Tm) increases monotonically up to about pH 4.5, then plateaus and decreases slightly between pH 4.5 and 6.5. Under these reversible conditions, the heat capacity curves are characterized by the presence of a positive change in heat capacity between the denatured and native states (ΔCp). This positive change in heat capacity has been attributed to the exposure of nonpolar groups to water upon unfolding.42–48 In fact, it has been shown that the magnitude of ΔCp can be calculated from the change in polar and nonpolar surface areas determined from the crystallographic structures,44,49,50 indicating that under reversible conditions polar and nonpolar groups become exposed to solvent upon unfolding.
FIGURE 1.
Temperature dependence of the excess heat capacity function of HEWL at different pH values in the range pH 2.0–6.5, where the denaturation transition is reversible. The protein concentration was ~ 1 mg/mL in all scans. The midpoint of the transition (Tm) increases with increasing pH and reaches a maximum at pH 4.5 after which a slight decrease is observed as shown in the plot of Tm as a function of pH (inset)
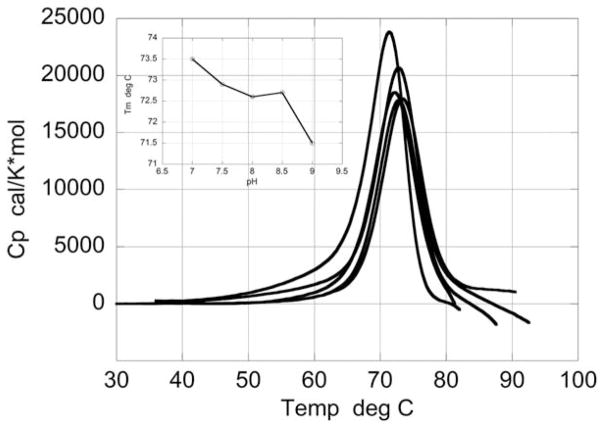
Figure 2 shows the temperature dependence of the excess heat capacity of HEWL between pH 7.0 and 9.0. Under these pH conditions the temperature denaturation is irreversible and coupled to aggregation and precipitation. This process is often seen by the appearance of an exothermic heat effect immediately following the endothermic denaturation peak. The exothermic heat effect is most likely due to precipitation since it can be minimized by modifying the geometry of the cell and reducing the length of the precipitation path.51,52 Even if the exothermic heat effect is suppressed, denaturation under these conditions is not coupled to a significant exposure of nonpolar groups to the solvent (due to aggregation) and no positive change in heat capacity is observed. Irreversible denaturation is a kinetically controlled process and its rigorous analysis has been developed by Sanchez-Ruiz and colleagues.23,32,53,54
FIGURE 2.
Temperature dependence of the excess heat capacity function of HEWL at different pH values above pH 7.0, where irreversible denaturation is observed. The protein concentration was the same as for the reversible scans shown in Figure 1. The transition is followed by exothermic aggregation, which usually is observed as a drop in heat capacity at the end of the scans. The inset shows Tm as a function of pH
3.2 | Protein concentration dependence
At pH values between pH 7.0 and 9.0, the denatured state of HEWL aggregates and eventually precipitates. One of the most important characteristics of a conformational equilibrium reaction coupled to a self-association process is that it depends on protein concentration. In general, the denaturation of HEWL can be represented by the Lumry-Eyring models according to the following reactions54:
| (1) |
| (2) |
Reaction 1 corresponds to the equilibrium between the native and denatured states and is characterized by the equilibrium constant K0. Reaction 2 corresponds to the self-association and aggregation processes and is divided into a reversible self-association process followed by an irreversible aggregation step. For simplicity, we will assume that the protein self-associates with an average degree of oligomerization j. Of course, more complicated self-association reactions can be considered but for the purpose of this discussion, this simple Lumry-Eyring model is sufficient to account for the data. For a complete discussion of different self-association models the reader is referred to the reviews of Roberts and colleagues.55,56 The reversible self-association process is characterized by the equilibrium constant Kj and the irreversible step by the rate constant k.
For the system of coupled reactions, the apparent or measured conformational equilibrium constant can be defined as57:
| (3) |
And the apparent Gibbs energy, ΔGapp becomes:
| (4) |
Where [Pt] is the total protein concentration and FD the fraction of denatured protein. It is clear from equation 4 that the stability of the protein decreases as a function of concentration that is, ΔGapp becomes smaller in magnitude. The magnitude of the decrease in ΔG is a function of the concentration of denatured protein, the self-association constant and the degree of oligomerization. Self-association of the denatured state pulls the equilibrium toward the denatured state.
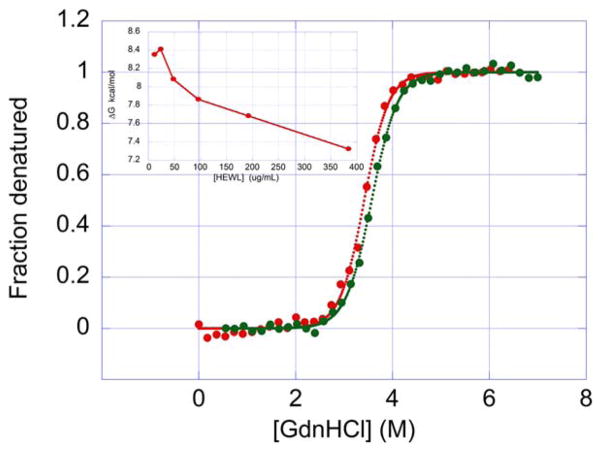
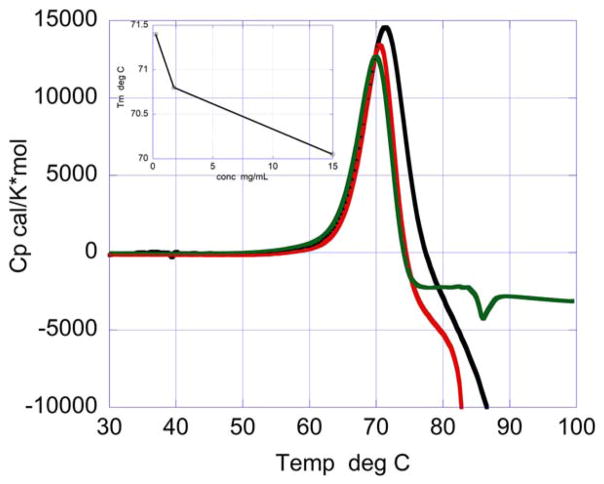
While the temperature denaturation of HEWL is irreversible at pH 9, chemical denaturation using GdnHCl is reversible at that same pH as shown in Figure 3. A protein sample that has been denatured refolds upon removal of the denaturant. Under these conditions, irreversible aggregates are not formed since the protein can be totally renatured by diluting the GdnHCl away. In fact, denaturation and renaturation curves at pH 9.0 are similar and yield similar ΔG and m values of 8.0 kcal/mol (8.1 and 7.9, respectively) and 2.3 kcal/(mol × M) (2.4 and 2.2, respectively). Nevertheless, if the chemical denaturation experiment is performed using different protein concentrations, a clear decrease in ΔGapp is observed as a function of protein concentration. The decrease in ΔGapp with protein concentration is a clear indication that the denatured state still has a propensity to self-associate at the temperature where the chemical denaturation experiment is performed (25°C). As suggested by Plaza del Pino et al.58 the overall denaturation is most likely still irreversible at this low experimental temperature but the irreversible aggregation step becomes so slow that the much faster folding reaction will make the chemical denaturation appear reversible over short periods of time. On the other hand, temperature denaturation is irreversible at pH 9.0 since aggregation occurs at a fast rate. In temperature denaturation experiments, denatured self-association and aggregation is reflected by lower Tm’s at higher protein concentrations (see Figure 4).
FIGURE 3.
Chemical denaturation (red) and renaturation (green) curves for HEW lysozyme using GdnHCl as denaturant. For renaturation, protein was first dissolved in 20 mM bicine buffer (pH 9.0) containing 7 M GdnHCl and then diluted using buffer with varying amounts of denaturant to achieve the desired concentrations of GdnHCl. The final protein concentration was 96 μg/mL for both curves. See “Materials and Methods” for details [Color figure can be viewed at wileyonlinelibrary.com]
FIGURE 4.
Temperature dependence of the excess heat capacity function of HEWL for irreversible thermal unfolding and aggregation at pH 9 (20 mM bicine buffer) and concentrations of 0.226 mg/mL (black), 1.76 mg/mL (red) and 15.0 mg/mL (green). Increasing protein concentration shifts Tm to lower temperatures (inset), and protein precipitates at high temperatures [Color figure can be viewed at wileyonlinelibrary.com]
3.3 | Isothermal calorimetry
Under irreversible conditions most proteins, especially high molecular weight proteins, undergo unfolding followed by aggregation and precipitation.12,57,59–69 Protein unfolding is an endothermic process whereas aggregation and precipitation are exothermic processes. Irreversible denaturation is kinetically controlled23,32,53,54 and its rate becomes progressively slower as the temperature is lowered below Tm. The kinetics of this process can be studied calorimetrically by measuring the time evolution of the heat effects associated with unfolding and aggregation/precipitation at constant temperatures below Tm. Isothermal calorimetry is ideally suited to measure denaturation/aggregation/precipitation over a period of days and weeks. We used the DSC data in Figure 2 and the formalism of Sanchez-Ruiz23 to estimate the temperature range in which unfolding/aggregation/precipitation is expected to occur over a period of a week. The experiments for HEWL at pH 9.0 were performed in a high sensitivity isothermal calorimeter (TAM) to measure the heat effects at 57, 58, and 59°C, that is, about 12° below Tm. The TAM is capable of maintaining a constant temperature within ± 0.0001°C >24 hours and measure heat effects smaller than 0.5 μcal/s. See for example, references24,25 for general reviews on isothermal calorimetry.
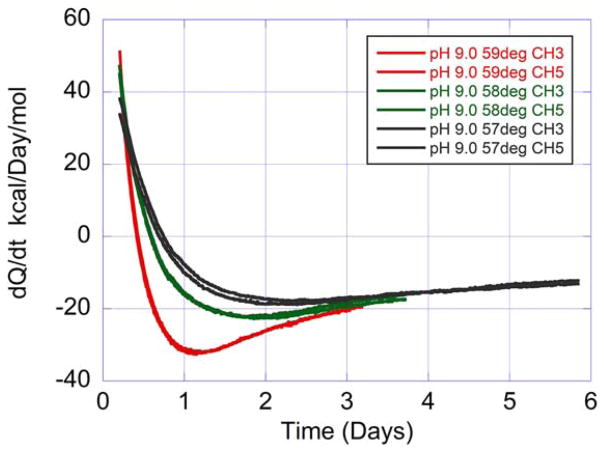
Figure 5 shows the rate of heat production or absorbtion, called heat flow (dQ/dt) measured at 57, 58, and 59°C for HEWL at pH 9.0. These measurements were performed in duplicate over a period of six days. It is immediately apparent that at the three measured temperatures the initial process is endothermic (positive heat flow) and that this effect is followed by an exothermic event (negative heat flow). It is also apparent that the process occurs faster at the highest temperature. This sequence is the one expected from an unfolding reaction followed by aggregation/precipitation. For the experiments in this figure, a protein concentration of 100 mg/mL was utilized. These and additional experiments using monoclonal antibodies (data not shown) indicate that isothermal calorimetry is able to measure the unfolding/aggregation process at temperatures well below Tm.
FIGURE 5.
Heat flow recorded as a function of time for HEWL at different constant temperatures below the midpoint of the irreversible transition at pH 9.0 (50 mM bicine buffer). The protein concentration was 100 mg/mL in a volume of 1.0 mL. The traces in the graph correspond to duplicate samples run at 57°C (black), 58°C (green), and 59°C (red), respectively. The inset in the figure indicates the calorimeter channel used for each experiment. The curves in the graph were obtained after subtraction of the signal from an ampoule containing buffer run in parallel followed by normalization by the amount of protein. In this figure, positive and negative heat flows correspond to endothermic and exothermic processes, respectively
Mathematically, the excess enthalpy or heat associated with the unfolding followed by aggregation of the protein, relative to that of the native nonaggregated protein can be represented by the following equations. At any time the heat, QTotal, is equal to:
| (5) |
Where v is the sample volume, [Pu] and [Pagg] are the concentration of unfolded and aggregated protein respectively and, ΔHu and Qagg are the molar heats of unfolding and aggregation respectively. It must be noted that aggregation/precipitation is not an equilibrium process and that the magnitude of Qagg is not an enthalpy and depends on the exact chemical and physical conditions. Equation 5 can be written in terms of the total protein concentration and the fractions of unfolded, Fu, and aggregated, Fagg, protein as follows:
| (6) |
The second term on the right hand side assumes that only the denatured protein aggregates. The normalized heat, Q, becomes:
| (7) |
At any time, the fractions of unfolded and aggregated protein can be written in terms of the rates of unfolding and aggregation as:
| (8) |
Finally, the heat flow, q = dQ/dt, becomes
| (9) |
which is the quantity measured by the isothermal calorimeter and shown in Figure 5.
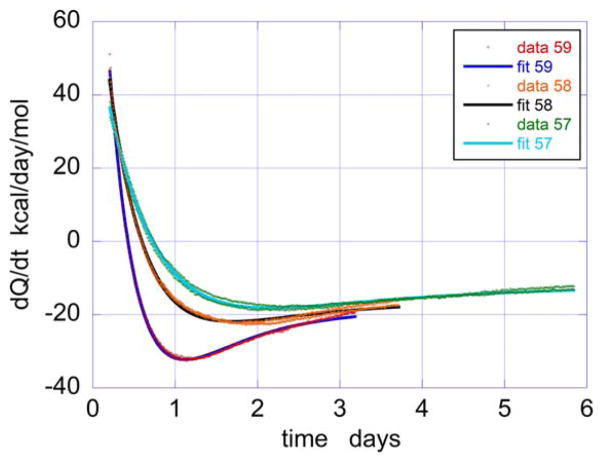
Equation 9 was used to fit the isothermal calorimetry data by nonlinear least squares. The results of the analysis are shown in Figure 6 and demonstrate that the data is well accounted by Equation 9. Both, the endothermic and exothermic components are accurately described. Table 1 summarizes the rates and enthalpies obtained from the analysis. The unfolding enthalpies obtained by isothermal calorimetry are similar in magnitude to those previously reported in differential scanning calorimetry studies.33,37,40 Using the formalism developed by Sanchez-Ruiz23 to estimate the rates of irreversible unfolding from the DSC curve (Figure 2) and the Arrhenius equation to extrapolate to the temperatures measured in the TAM, values of 1.9–4.6 days−1 were obtained for the temperatures of 57–59°C, which are close to the values in Table 1 despite the differences in experimental conditions. At low temperatures, for example 25°C, the denaturation/aggregation process is expected to take months or even years, being therefore impractical to measure, especially if what is needed is a rapid identification of the formulation conditions that optimize long term stability. Experiments performed at different temperatures should allow extrapolation of the rates using the standard Arrhenius equation (ln k vs 1/T). For example, a simple linear Arrhenius extrapolation of the data in Table 1 is consistent with a rate of 0.00285 days−1 (that is, about 350 days) at 25°C. This time frame is in the same order of magnitude estimated by Plaza del Pino et al.58
FIGURE 6.
Nonlinear least squares fits of the heat flow versus time data at 57, 58, and 59°C in terms of Equation 9 (see text for details). The parameters derived from the fits are summarized in Table 1. The experimental data represent duplicate experiments at each temperature. The solid lines are the fitted curves
TABLE 1.
Enthalpies and rates of unfolding and aggregation derived from isothermal calorimetry at 100 mg/mLa
| Temperature (°C) | ΔHu (kcal/mol) | Qagg (kcal/mol) | ku (days−1) | kagg (days−1) |
|---|---|---|---|---|
| 57 | 81.8 ± 3.6 | −68.4 ± 3.5 | 0.93 ± 0.045 | 0.66 ± 0.015 |
| 58 | 88.0 ± 4.17 | −66.5 ± 4.14 | 1.198 ± 0.061 | 0.96 ± 0.016 |
| 59 | 118.0 ± 4.4 | −106.0 ± 4.4 | 1.29 ± 0.055 | 1.36 ± 0.015 |
The errors in the table are the standard errors of the fits.
3.4 | Isothermal calorimetry at different protein concentrations
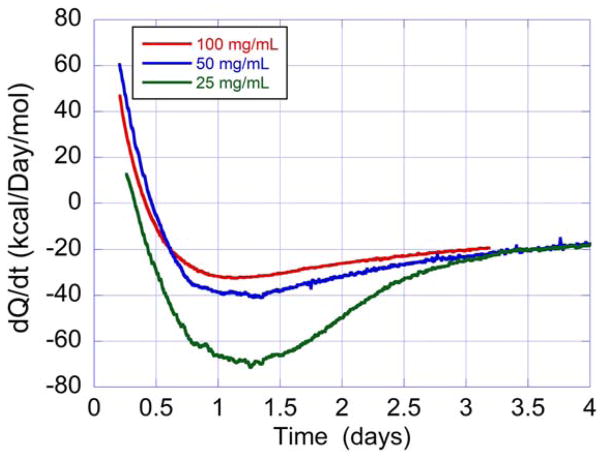
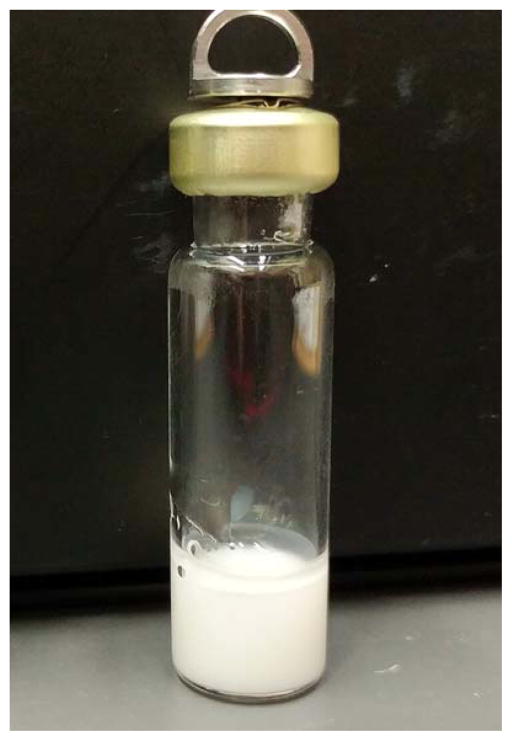
The isothermal calorimetry data in Figure 5 indicates that these experiments can be performed at the concentrations used in the formulation of protein drugs, 100 mg/mL or even more. Additional experiments were performed at lower concentrations of 50 and 25 mg/mL as shown in Figure 7. Inspection of Figure 7 reveals that the magnitude of the exothermic heat effect is larger on a molar basis at 25 mg/mL than at the higher concentrations. Unlike the enthalpy, Qagg is not a state function and depends on the exact physical conditions. This result is consistent with the DSC observation that the magnitude of the exothermic heat effect depends on the length of the precipitation path (cylindrical, lollipop or capillary shaped cells). In the isothermal calorimetry experiments the high concentration HEWL samples form a gel without any significant vertical precipitation path through the solution as shown in Figure 8. As expected, the rate of aggregation/precipitation increases with protein concentration. Analysis of the data yields rates of 0.5, 0.72, and 1.36 days−1 at 25, 50, and 100 mg/mL respectively.
FIGURE 7.
Heat flow recorded as a function of time for HEWL at 59°C in 50 mM bicine, pH 9.0, at concentrations of 25, 50, and 100 mg/mL. The curves were treated in the same way as described in the legend to Figure 5
FIGURE 8.
Picture of the calorimeter vial with the aggregated protein after the experiment [Color figure can be viewed at wileyonlinelibrary.com]
4 | CONCLUSIONS
In these studies, differential scanning calorimetry, isothermal chemical denaturation and isothermal calorimetry were used to study the structural stability of HEW under conditions in which the unfolding is coupled to aggregation. It is demonstrated that the three techniques reflect the unfolding/aggregation process in different ways. Chemical denaturation at 25°C is reversible but characterized by a ΔG that decreases upon increasing protein concentration as expected from thermodynamic theory. DSC experiments are characterized by the presence of an exothermic heat effect after denaturation and also by a decrease in Tm upon increasing protein concentration. Isothermal calorimetry provides information not only about the heat effects associated with unfolding, aggregation and precipitation, but perhaps more importantly the kinetics of these processes below Tm. In addition, isothermal calorimetry can perform these measurements at high protein concentrations (>100 mg/mL) which makes it an ideal technique to evaluate different formulations (buffers and excipients) in the development of biologics.
For the protein studied here, denaturation preceds aggregation. This behavior is not necessary the same for other proteins. For example, some proteins may associate in the native state, in which case an exothermic event preceds the endothermic denaturation process. Some proteins may exhibit partially denatured states and those states may be the ones that aggregate. The combinations are many as demonstrated by Roberts and colleagues.55,56 In general, it is necessary to derive an expression for the population of protein that exists in a particular conformational/aggregational state.55 Each state will have associated a particular kinetic rate of formation and a particular heat of formation as illustrated in Equations 5–9 for the simple denaturation/aggregation case. The resultant heat flow, q, equations can be used to analyze and fit the isothermal calorimetry data.
Acknowledgments
Funding information
National Science Foundation, Grant/Award Number: MCB-1157506
This work was supported by a grant from the National Science Foundation MCB-1157506.
References
- 1.Freire E. Differential scanning calorimetry. Methods Mol Biol. 1995;40:191–218. doi: 10.1385/0-89603-301-5:191. [DOI] [PubMed] [Google Scholar]
- 2.Freire E, Biltonen RL. Statistical mechanical deconvolution of thermal transitions in macromolecules. I. Theory and application to homogeneous systems. Biopolymers. 1978;17(2):463–479. [Google Scholar]
- 3.Privalov PL. Stability of proteins: small globular proteins. Adv Protein Chem. 1979;33:167–241. doi: 10.1016/s0065-3233(08)60460-x. [DOI] [PubMed] [Google Scholar]
- 4.Brandts JF, Oliveira RJ, Westort C. Thermodynamics of protein denaturation. Effect of pressu on the denaturation of ribonuclease A. Biochemistry. 1970;9(4):1038–1047. doi: 10.1021/bi00806a045. [DOI] [PubMed] [Google Scholar]
- 5.Privalov PL, Khechinashvili NN, Atanasov BP. Thermodynamic analysis of thermal transitions in globular proteins. I. Calorimetric study of chymotrypsinogen, ribonuclease and myoglobin. Biopolymers. 1971;10(10):1865–1890. doi: 10.1002/bip.360101009. [DOI] [PubMed] [Google Scholar]
- 6.Tanford C. Protein denaturation. Adv Protein Chem. 1968;23:121–282. doi: 10.1016/s0065-3233(08)60401-5. [DOI] [PubMed] [Google Scholar]
- 7.Privalov PL, Khechinashvili NN. A thermodynamic approach to the problem of stabilization of globular protein structure: a calorimetric study. J Mol Biol. 1974;86(3):665–684. doi: 10.1016/0022-2836(74)90188-0. [DOI] [PubMed] [Google Scholar]
- 8.Capelle MA, Gurny R, Arvinte T. High throughput screening of protein formulation stability: practical considerations. Eur J Pharm Biopharm. 2007;65(2):131–148. doi: 10.1016/j.ejpb.2006.09.009. [DOI] [PubMed] [Google Scholar]
- 9.He F, Hogan S, Latypov RF, Narhi LO, Razinkov VI. High throughput thermostability screening of monoclonal antibody formulations. J Pharm Sci. 2010;99(4):1707–1720. doi: 10.1002/jps.21955. [DOI] [PubMed] [Google Scholar]
- 10.Senisterra GA, Finerty PJ., Jr High throughput methods of assessing protein stability and aggregation. Mol Biosyst. 2009;5(3):217–223. doi: 10.1039/b814377c. [DOI] [PubMed] [Google Scholar]
- 11.Vedadi M, Niesen FH, Allali-Hassani A, et al. Chemical screening methods to identify ligands that promote protein stability, protein crystallization, and structure determination. Proc Natl Acad Sci. 2006;103(43):15835–15840. doi: 10.1073/pnas.0605224103. [DOI] [PMC free article] [PubMed] [Google Scholar]
- 12.Duy C, Fitter J. Thermostability of irreversible unfolding alpha-amylases analyzed by unfolding kinetics. J Biol Chem. 2005;280(45):37360–37365. doi: 10.1074/jbc.M507530200. [DOI] [PubMed] [Google Scholar]
- 13.Shire SJ, Shahrokh Z, Liu J. Challenges in the development of high protein concentration formulations. J Pharm Sci. 2004;93(6):1390–1402. doi: 10.1002/jps.20079. [DOI] [PubMed] [Google Scholar]
- 14.Wang W, Singh S, Zeng DL, King K, Nema S. Antibody Structure, Instability, and Formulation. J Pharm Sci. 2007;96(1):1–26. doi: 10.1002/jps.20727. [DOI] [PubMed] [Google Scholar]
- 15.Harn N, Allan C, Oliver C, Middaugh CR. Highly concentrated monoclonal antibody solutions: direct analysis of physical structure and thermal stability. J Pharm Sci. 2007;96(3):532–546. doi: 10.1002/jps.20753. [DOI] [PubMed] [Google Scholar]
- 16.Samra HS, He F. Advancements in high throughput biophysical technologies: applications for characterization and screening during early formulation development of monoclonal antibodies. Mol Pharm. 2012;9(4):696–707. doi: 10.1021/mp200404c. [DOI] [PubMed] [Google Scholar]
- 17.Thiagarajan G, Semple A, James JK, Cheung JK, Shameem M. A comparison of biophysical characterization techniques in predicting monoclonal antibody stability. mAbs. 2016;8(6):1088–1097. doi: 10.1080/19420862.2016.1189048. [DOI] [PMC free article] [PubMed] [Google Scholar]
- 18.Bianconi ML. Calorimetric determination of thermodynamic parameters of reaction reveals different enthalpic compensations of the yeast hexokinase isozymes. J Biol Chem. 2003;278(21):18709–18713. doi: 10.1074/jbc.M211103200. [DOI] [PubMed] [Google Scholar]
- 19.Bianconi ML. Calorimetry of enzyme-catalyzed reactions. Biophys Chem. 2007;126(1–3):59–64. doi: 10.1016/j.bpc.2006.05.017. [DOI] [PubMed] [Google Scholar]
- 20.Morin PE, Freire E. Direct calorimetric analysis of the enzymatic activity of yeast cytochrome c oxidase. Biochemistry. 1991;30(34):8494–8500. doi: 10.1021/bi00098a030. [DOI] [PubMed] [Google Scholar]
- 21.Spink C, Wadso I. Calorimetry as an analytical tool in biochemistry and biology. Methods Biochem Anal. 1976;23(0):1–159. doi: 10.1002/9780470110430.ch1. [DOI] [PubMed] [Google Scholar]
- 22.Todd MJ, Gomez J. Enzyme kinetics determined using calorimetry: a general assay for enzyme activity? Anal Biochem. 2001;296(2):179–187. doi: 10.1006/abio.2001.5218. [DOI] [PubMed] [Google Scholar]
- 23.Sanchez-Ruiz JM, Lopez-Lacomba JL, Cortijo M, Mateo PL. Differential scanning calorimetry of the irreversible thermal denaturation of thermolysin. Biochemistry. 1988;27(5):1648–1652. doi: 10.1021/bi00405a039. [DOI] [PubMed] [Google Scholar]
- 24.Wadso I. Trends in isothermal microcalorimetry. Chem Soc Rev. 1997;26(2):79–86. [Google Scholar]
- 25.Wadsö I. Isothermal microcalorimetry in applied biology. Thermochim Acta. 2002;394(1–2):305–311. [Google Scholar]
- 26.Wadsö I. Biocalorimetry. CRC Press; 2016. From classical thermochemistry to monitoring of living organisms; pp. 17–40. [Google Scholar]
- 27.Pace CN. Determination and analysis of urea and guanidine hydrochloride denaturation curves. Methods Enzymol. 1986;131:266–280. doi: 10.1016/0076-6879(86)31045-0. [DOI] [PubMed] [Google Scholar]
- 28.Bolen DW, Santoro MM. Unfolding free energy changes determined by the linear extrapolation method. 2. Incorporation of delta G degrees N-U values in a thermodynamic cycle. Biochemistry. 1988;27(21):8069–8074. doi: 10.1021/bi00421a015. [DOI] [PubMed] [Google Scholar]
- 29.Santoro MM, Bolen DW. Unfolding free energy changes determined by the linear extrapolation method. 1. Unfolding of phenylmethane-sulfonyl alpha-chymotrypsin using different denaturants. Biochemistry. 1988;27(21):8063–8068. doi: 10.1021/bi00421a014. [DOI] [PubMed] [Google Scholar]
- 30.Chen L, Hodgson KO, Doniach S. A lysozyme folding intermediate revealed by solution X-ray scattering. J Mol Biol. 1996;261(5):658–671. doi: 10.1006/jmbi.1996.0491. [DOI] [PubMed] [Google Scholar]
- 31.Cooper A, Eyles SJ, Radford SE, Dobson CM. Thermodynamic consequences of the removal of a disulphide bridge from hen lysozyme. J Mol Biol. 1992;225(4):939–943. doi: 10.1016/0022-2836(92)90094-z. [DOI] [PubMed] [Google Scholar]
- 32.Ibarra-Molero B, Sanchez-Ruiz JM. Are there equilibrium intermediate states in the urea-induced unfolding of hen egg-white lysozyme? Biochemistry. 1997;36(31):9616–9624. doi: 10.1021/bi9703305. [DOI] [PubMed] [Google Scholar]
- 33.Khechinashvili NN, Privalov PL, Tiktopulo EI. Calorimetric investigation of lysozyme thermal denaturation. FEBS Lett. 1973;30(1):57–60. doi: 10.1016/0014-5793(73)80618-0. [DOI] [PubMed] [Google Scholar]
- 34.Makhatadze GI, Privalov PL. Protein interactions with urea and guanidinium chloride. A calorimetric study. Mol Biol. 1992;226(2):491–505. doi: 10.1016/0022-2836(92)90963-k. [DOI] [PubMed] [Google Scholar]
- 35.Pfeil W, Privalov PL. Thermodynamic investigations of proteins. II. Calorimetric study of lysozyme denaturation by guanidine hydrochloride. Biophys Chem. 1976;4(1):33–40. doi: 10.1016/0301-4622(76)80004-x. [DOI] [PubMed] [Google Scholar]
- 36.Pfeil W, Privalov PL. Thermodynamic investigations of proteins. III. Thermodynamic description of lysozyme. Biophys Chem. 1976;4(1):41–50. doi: 10.1016/0301-4622(76)80005-1. [DOI] [PubMed] [Google Scholar]
- 37.Pfeil W, Privalov PL. Thermodynamic investigations of proteins. I. Standard functions for proteins with lysozyme as an example. Biophys Chem. 1976;4(1):23–32. doi: 10.1016/0301-4622(76)80003-8. [DOI] [PubMed] [Google Scholar]
- 38.Privalov PL, Gill SJ. Stability of protein structure and hydrophobic interaction. Adv Protein Chem. 1988;39:191–234. doi: 10.1016/s0065-3233(08)60377-0. [DOI] [PubMed] [Google Scholar]
- 39.Radford SE, Dobson CM. Insights into protein folding using physical techniques: studies of lysozyme and alpha-lactalbumin. Philos Trans R Soc Lond B Biol Sci. 1995;348(1323):17–25. doi: 10.1098/rstb.1995.0041. [DOI] [PubMed] [Google Scholar]
- 40.Schon A, Freire E. Three easy pieces. Biochim Biophys Acta. 2016;1860(5):975–980. doi: 10.1016/j.bbagen.2015.12.003. [DOI] [PMC free article] [PubMed] [Google Scholar]
- 41.Sophianopoulos AJ, Vanholde KE. Physical Studies of Muramidase (Lysozyme). Ii. Ph-Dependent Dimerization. J Biol Chem. 1964;239:2516–2524. [PubMed] [Google Scholar]
- 42.Livingstone JR, Spolar RS, Record MT., Jr Contribution to the thermodynamics of protein folding from the reduction in water-accessible nonpolar surface area. Biochemistry. 1991;30(17):4237–4244. doi: 10.1021/bi00231a019. [DOI] [PubMed] [Google Scholar]
- 43.Makhatadze GI, Privalov PL. Heat capacity of proteins. I. Partial molar heat capacity of individual amino acid residues in aqueous solution: hydration effect. J Mol Biol. 1990;213(2):375–384. doi: 10.1016/S0022-2836(05)80197-4. [DOI] [PubMed] [Google Scholar]
- 44.Murphy KP, Bhakuni V, Xie D, Freire E. Molecular basis of cooperativity in protein folding. III. Structural identification of cooperative folding units and folding intermediates. J Mol Biol. 1992;227(1):293–306. doi: 10.1016/0022-2836(92)90699-k. [DOI] [PubMed] [Google Scholar]
- 45.Murphy KP, Freire E. Thermodynamics of structural stability and cooperative folding behavior in proteins. Adv Protein Chem. 1992;43:313–361. doi: 10.1016/s0065-3233(08)60556-2. [DOI] [PubMed] [Google Scholar]
- 46.Murphy KP, Gill SJ. Solid model compounds and the thermodynamics of protein unfolding. J Mol Biol. 1991;222(3):699–709. doi: 10.1016/0022-2836(91)90506-2. [DOI] [PubMed] [Google Scholar]
- 47.Privalov PL, Makhatadze GI. Heat capacity of proteins. II. Partial molar heat capacity of the unfolded polypeptide chain of proteins: protein unfolding effects. J Mol Biol. 1990;213(2):385–391. doi: 10.1016/S0022-2836(05)80198-6. [DOI] [PubMed] [Google Scholar]
- 48.Spolar RS, Ha JH, Record MT., Jr Hydrophobic effect in protein folding and other noncovalent processes involving proteins. Proc Natl Acad Sci U S A. 1989;86(21):8382–8385. doi: 10.1073/pnas.86.21.8382. [DOI] [PMC free article] [PubMed] [Google Scholar]
- 49.Gomez J, Hilser VJ, Xie D, Freire E. The heat capacity of proteins. Proteins. 1995;22(4):404–412. doi: 10.1002/prot.340220410. [DOI] [PubMed] [Google Scholar]
- 50.Spolar RS, Livingstone JR, Record MT., Jr Use of liquid hydrocarbon and amide transfer data to estimate contributions to thermodynamic functions of protein folding from the removal of nonpolar and polar surface from water. Biochemistry. 1992;31(16):3947–3955. doi: 10.1021/bi00131a009. [DOI] [PubMed] [Google Scholar]
- 51.Eronina T, Borzova V, Maloletkina O, et al. A protein aggregation based test for screening of the agents affecting thermostability of proteins. PLoS One. 2011;6(7):e22154. doi: 10.1371/journal.pone.0022154. [DOI] [PMC free article] [PubMed] [Google Scholar]
- 52.Privalov PL, Potekhin SA. Scanning microcalorimetry in studying temperature-induced changes in proteins. Methods Enzymol. 1986;131:4–51. doi: 10.1016/0076-6879(86)31033-4. [DOI] [PubMed] [Google Scholar]
- 53.Kurganov BI, Lyubarev AE, Sanchez-Ruiz JM, Shnyrov VL. Analysis of differential scanning calorimetry data for proteins. Criteria of validity of one-step mechanism of irreversible protein denaturation. Biophys Chem. 1997;69(2–3):125–135. doi: 10.1016/s0301-4622(97)80552-2. [DOI] [PubMed] [Google Scholar]
- 54.Sanchez-Ruiz JM. Theoretical analysis of Lumry-Eyring models in differential scanning calorimetry. Biophys J. 1992;61(4):921–935. doi: 10.1016/S0006-3495(92)81899-4. [DOI] [PMC free article] [PubMed] [Google Scholar]
- 55.Li Y, Roberts CJ. Protein aggregation pathways, kinetics, and thermodynamics. In: Wang W, Roberts CJ, editors. Aggregation of Therapeutic Proteins. John Wiley & Sons, Inc; 2010. pp. 63–102. [Google Scholar]
- 56.Roberts CJ. Non-native protein aggregation kinetics. Biotechnol Bioeng. 2007;98(5):927–938. doi: 10.1002/bit.21627. [DOI] [PubMed] [Google Scholar]
- 57.Schon A, Clarkson BR, Siles R, Ross P, Brown RK, Freire E. Denatured state aggregation parameters derived from concentration dependence of protein stability. Anal Biochem. 2015;488:45–50. doi: 10.1016/j.ab.2015.07.013. [DOI] [PubMed] [Google Scholar]
- 58.Plaza del Pino IM, Ibarra-Molero B, Sanchez-Ruiz JM. Lower kinetic limit to protein thermal stability: a proposal regarding protein stability in vivo and its relation with misfolding diseases. Proteins. 2000;40(1):58–70. doi: 10.1002/(sici)1097-0134(20000701)40:1<58::aid-prot80>3.0.co;2-m. [DOI] [PubMed] [Google Scholar]
- 59.Andersen CB, Manno M, Rischel C, Thorolfsson M, Martorana V. Aggregation of a multidomain protein: A coagulation mechanism governs aggregation of a model IgG1 antibody under weak thermal stress. Protein Sci. 2010;19(2):279–290. doi: 10.1002/pro.309. [DOI] [PMC free article] [PubMed] [Google Scholar]
- 60.Borzova VA, Markossian KA, Chebotareva NA, et al. Kinetics of Thermal Denaturation and Aggregation of Bovine Serum Albumin. PLoS One. 2016;11(4):e0153495. doi: 10.1371/journal.pone.0153495. [DOI] [PMC free article] [PubMed] [Google Scholar]
- 61.Fitter J. The perspectives of studying multi-domain protein folding. Cell Mol Life Sci. 2009;66(10):1672–1681. doi: 10.1007/s00018-009-8771-9. [DOI] [PMC free article] [PubMed] [Google Scholar]
- 62.Freire E, Schon A, Hutchins BM, Brown RK. Chemical denaturation as a tool in the formulation optimization of biologics. Drug Discov Today. 2013;18(19–20):1007–1013. doi: 10.1016/j.drudis.2013.06.005. [DOI] [PMC free article] [PubMed] [Google Scholar]
- 63.Giri Rao VVH, Gosavi S. In the Multi-domain Protein Adenylate Kinase, Domain Insertion Facilitates Cooperative Folding while Accommodating Function at Domain Interfaces. PLos Comput Biol. 2014;10(11):e1003938. doi: 10.1371/journal.pcbi.1003938. [DOI] [PMC free article] [PubMed] [Google Scholar]
- 64.Goyal M, Chaudhuri TK, Kuwajima K. Irreversible denaturation of maltodextrin glucosidase studied by differential scanning calorimetry, circular dichroism, and turbidity measurements. PLoS One. 2014;9(12):e115877. doi: 10.1371/journal.pone.0115877. [DOI] [PMC free article] [PubMed] [Google Scholar]
- 65.Ionescu RM, Vlasak J, Price C, Kirchmeier M. Contribution of variable domains to the stability of humanized IgG1 monoclonal antibodies. J Pharm Sci. 2008;97(4):1414–1426. doi: 10.1002/jps.21104. [DOI] [PubMed] [Google Scholar]
- 66.Mehta SB, Bee JS, Randolph TW, Carpenter JF. Partial unfolding of a monoclonal antibody: role of a single domain in driving protein aggregation. Biochemistry. 2014;53(20):3367–3377. doi: 10.1021/bi5002163. [DOI] [PubMed] [Google Scholar]
- 67.Schon A, Brown RK, Hutchins BM, Freire E. Ligand binding analysis and screening by chemical denaturation shift. Anal Biochem. 2013;443(1):52–57. doi: 10.1016/j.ab.2013.08.015. [DOI] [PMC free article] [PubMed] [Google Scholar]
- 68.Strucksberg KH, Rosenkranz T, Fitter J. Reversible and irreversible unfolding of multi-domain proteins. Biochim Biophys Acta. 2007;1774(12):1591–1603. doi: 10.1016/j.bbapap.2007.09.005. [DOI] [PubMed] [Google Scholar]
- 69.Vermeer AWP, Norde W. The thermal stability of immunoglobulin: unfolding and aggregation of a multi-domain protein. Biophys J. 2000;78(1):394–404. doi: 10.1016/S0006-3495(00)76602-1. [DOI] [PMC free article] [PubMed] [Google Scholar]


