Abstract
Preventing virological failure following HIV treatment remains a difficult task that is further complicated by the emergence of drug resistance. We have developed a mathematical model able to explain and predict HIV virological outcomes for various compounds and patients' drug intake patterns. Compared to current approaches, this model considers, altogether, drug penetration into lymph nodes, a refined adherence representation accounting for the propensity for long drug holidays, population pharmacokinetic and pharmacodynamic variability, drug interaction, and crossresistance. In silico results are consistent with clinical observations for treatment with efavirenz, efavirenz in association with tenofovir DF and emtricitabine, or boosted darunavir. Our findings indicate that limited lymph node drug penetration can account for a large proportion of cases of virological failure and drug resistance. Since a limited amount of information is required by the model, it can be of use in the process of drug discovery and to guide clinical treatment strategies.
Study Highlights.
WHAT IS THE CURRENT KNOWLEDGE ON THE TOPIC?
☑ The in vitro potency of HIV drugs offers no guarantee that in vivo outcomes will be positive. Different virological outcomes can be observed for individuals having similar drug adherence, a perplexing situation for clinicians on the cause of such a discrepancy.
WHAT QUESTION DID THIS STUDY ADDRESS?
☑ We formulated a Quantitative Systems Pharmacology model to explain and predict the risk of virological failure and the emergence of drug resistance, considering different antiretroviral treatments and drug adherence patterns.
WHAT THIS STUDY ADDS TO OUR KNOWLEDGE
☑ Under various partial adherence scenarios, the developed model improves predictions of virological failure with HIV treatment. The results indicate that limited lymph node drug penetration can account for virological failure and resistance.
HOW MIGHT THIS CHANGE DRUG DISCOVERY, DEVELOPMENT, AND/OR THERAPEUTICS?
☑ The model helps delineate the role of the involved biopharmacological mechanisms and drug adherence in therapeutic failure. Prior to human testing, it can be applied to help choose the right dosing of new drugs or their combinations.
Although potent antiretroviral drugs efficaciously inhibit HIV replication, monotherapy with these drugs has been historically associated with high rates of treatment failure due to the development of drug resistance. This illustrates how the in vitro potency of a drug can poorly reflect its clinical efficacy. Efavirenz, a nonnucleoside reverse transcriptase inhibitor, is a typical example for which clinical outcomes differ from results obtained in tissue culture infection assays. Although viral growth is significantly inhibited in vitro when drug concentrations are similar to those observed in the plasma of patients,1, 2 resistance to efavirenz is frequently observed by clinicians. Accordingly, the product monograph advises the use of efavirenz only as part of combination therapy.3
Unfortunately, efavirenz is not an exception, and clinical studies may be the only reliable way to provide information about the clinical efficacy of antiretroviral treatments. Such studies generally involve high costs that may discourage the initiation of clinical trials with novel treatment regimens. The resulting lack of knowledge around the efficacy of different treatments inevitably hampers clinical practice. Indeed, when facing a patient experiencing treatment failure, clinicians are limited to well‐known treatment options that may be suboptimal both for the health of the patient and economically. Risk evaluation from preliminary data would help clinicians to anticipate the outcomes of various treatments, thereby guiding a better choice. In addition to clinicians, drug developers could also benefit from clinical predictions by helping them plan (or avoid) costly and lengthy clinical trials.
The potential gain resulting from the predictive ability of mathematical modeling motivated the work presented herein. Accordingly, our objective was to formulate a model that would assess the risk of virological failure and drug resistance from antiretroviral use. As the starting point, we used a mathematical model elaborated by Rosenbloom et al.4 The model successfully shows how the relationship between drug intake and virological outcomes varies for different drugs. Unfortunately, the model falls short of explaining issues such as the lack of efficacy of efavirenz monotherapy: it foretells an absence of virological failure for patients having moderate or high drug adherence, despite clinical expectations and in vivo evidence.5 We took this discrepancy as a learning opportunity, and revisited this mathematical model.
The approach adopted herein complies with the integrative vision advocated in Quantitative Systems Pharmacology.6, 7 In particular, the most up‐to‐date knowledge in immune physiology, antiretroviral pharmacology, and viral kinetics was incorporated into a model that describes the processes linking drug use to treatment effect. Since the current literature only partially informs these processes, hypotheses were used to fill the knowledge gaps that prevented the formulation of a comprehensive model. Notably, the model required a conceptualization of the in vivo effect of drugs. For this purpose, we hypothesized that the main cause of virological failure is insufficient drug exposure in one or more physiological compartments hosting a large number of CD4+ T‐cell infections, hence allowing viral replication for some of the strains. We identified lymph nodes as biological structures that are likely to exhibit both characteristics for the antiretrovirals that are considered in this study, namely, efavirenz, emtricitabine, tenofovir, and darunavir; for these drugs, concentrations in lymph node mononuclear cells were consistently lower than that of peripheral blood mononuclear cells (–66% to −99%).8 The level of drug penetration in the lymph node along with results from in vitro experiments were used for predictions of in vivo drug efficacy (see Methods for details).
Once a complete model was formulated, we compared model predictions of virological failure and resistance with clinical observations. Our attention then turned towards the sensitivity of model predictions to: 1) lymph node drug penetration, 2) drug adherence behavior, and 3) the within‐host viral load growth rate. The latter investigation was motivated by hypotheses of high model sensitivity to these three components.
METHODS
The model inputs a specified antiretroviral treatment, potential resistance mutations, and a set of patient characteristics. These characteristics, such as drug adherence behavior, are represented by model parameters. A number of virtual patients are generated by the model, each one having specific parameter values sampled from population distributions. The model outputs, at the individual patient level, the evolution over time of the number of infected CD4+ T cells in the lymph nodes. These cells contribute to the viral load by producing virions. It was defined that a patient experiences virological failure when this contribution is above a given threshold (the threshold value can vary). The model will be further described later in this section.
Antiretroviral treatment
Three daily antiretroviral treatments were considered in the modeling process: 1) monotherapy with 600 mg efavirenz, 2) combined therapy with 600 mg efavirenz, 300 mg tenofovir disoproxil fumarate, and 200 mg emtricitabine, and 3) monotherapy with darunavir (800 mg)/ritonavir (100 mg). This choice was driven by the availability of virological failure data5, 9, 10 and the required parameters for the model (lymph node drug penetration,8 see below).
The model and parameter values
To better grasp the rationale behind the model elaboration and detail the mathematical development, see the Supplementary Material. In the following, the modeling schematic is illustrated in Figure 1. The model was developed for the general case of multiple patients, therapy with multiple drugs, and multiple resistant strains. However, to help understand the model structure, the simple case of monotherapy for one patient is illustrated with the assumption of only one major resistance mutation (Figure 1).
Figure 1.
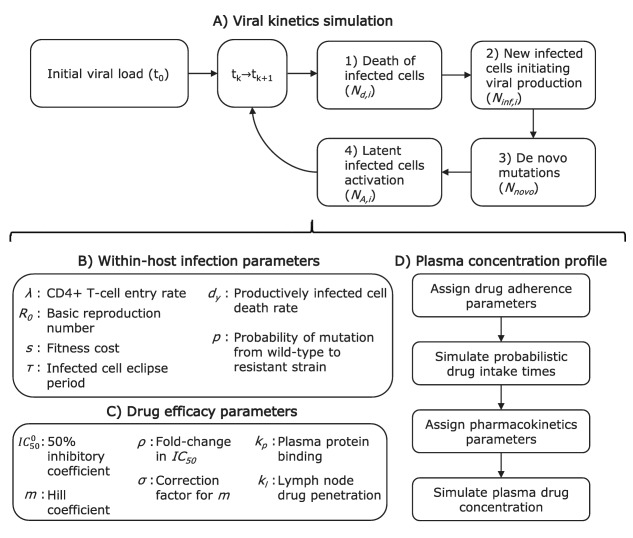
Simplified model algorithm and parameters: the special case of monotherapy for one patient with the assumption of only one major resistance mutation. Index k goes from 0 to the number of evaluated time steps. Index i takes a value of 1 for the wildtype strain and 2 for the resistant strain.
The main model component simulates the number of infected cells in the lymph nodes of a patient. Two types of infected cells are discriminated depending on the specific strain of virus having infected them (wildtype (y 1) or resistant virus (y 2)). An initial population size for the infected cells needs to be assigned (initial viral load (t 0)). Then, for a small time step , the following number of events are computed for each of the two infected cell types (i = 1, 2): 1) the number of productively infected cells of each type that die ( , Figure 1 a, Eq. (1)); 2) the number of newly infected cells initiating viral production ( , Figure 1 a, Eq. (2)); 3) the number of de novo mutations leading to cells infected by the resistant strain (Nnovo, Figure 1 a, Eq. (3)); and 4) the number of latent cells activation ( , Figure 1 a, Eq. (4)). Steps 1 to 4 above are repeated until the end of the virtual trial is reached.
The simulation of the number of infected cells within the host over time relies on the assignment of Poisson random variable values for each of the above‐mentioned processes at each evaluated time steps. The expected value of the random variables are given by Eqs. (1), (2), (3), (4), with the description of model parameters immediately following:
| (1) |
| (2) |
| (3) |
| (4) |
where and where is the expected fraction of the infected cell population that would be of type i, in the absence of drug.
Within‐host infection parameters are required (Figure 1 b). A viral setpoint (maximum viral load) is assigned to the patient. The setpoint value is related to the rate of entry of new CD4+ T cells (λ).4 One random value for λ is generated from a distribution suggested in Rosenbloom et al.4 A value of the basic reproduction number (R 0) is also attributed to the patient. The reproduction number characterizes the growth rate of the wildtype virus infection within the host in the absence of antiretroviral. As this can significantly vary between individuals due to immunity and quasispecies differences, the attributed R 0 is sampled from random distributions, which are reported for patients in the acute (primary infection, higher viral growth rate) and chronic (a few months after primary infection) phases.11, 12 For the resistant strain, growth is hampered by a nonzero fitness cost (s), which value depends on the considered mutation, and is reported for multiple strains in Sampah et al.13 A newly infected cell starts producing new virions after an eclipse period of 1 day (τ) and for a median period of 1 day (dy).14, 15 The newly produced virions can differ from the originating wildtype strains due to mutation. This occurs with probability P.4, 16
Drug concentrations have an effect on the growth rate of the wildtype and resistant viruses (Figure 1 c). Hill functions are shown to reflect the relationship between drug concentration and drug efficacy in vitro.1 The effect of the drug is accounted in the model using the drug concentration inhibiting 50% of the infection growth in vitro in a medium containing no plasma protein content ( ) and using the Hill curve coefficient (m). The former is taken from a random distribution since significant quasispecies differences in IC 50 are commonly reported.17 For the treatments investigated herein, these parameters were obtained from the product monographs3, 18, 19, 20 and from results of in vitro experimentations.1, 13 For the resistant strain, the model uses the fold‐change in IC 50 (ρ) and the correction factor for the Hill coefficient (σ).4, 13 If multiple drug treatment are considered, an algorithm for the combined effect is used.21 The in vitro to in vivo extrapolation of drug effect needed to account for the plasma protein binding effect on the IC 50 (kp), and for lymph node drug penetration (kl).8, 22
The simulation of drug concentrations is based on patient specific characteristics of adherence and drug disposition. The patient is assigned parameters representing the adherence behavior (Figure 1 d, first two boxes). The first parameter is the general adherence level, defined as the fraction of the prescribed pills that are expected to be taken over the investigated period. The second parameter is the probability of dose intake following a missed dose (PIM), related to the tendency of the patient for long periods of nonadherence (drug holidays). For an outpatient taking medication for chronic conditions, it was shown that these two values are required to reproduce the recorded distribution of the length of time separating consecutive dose intakes.23, 24 Using the two parameters mentioned above (general adherence, PIM), we simulate a sequence of zeros (missed dose) and ones (correct dose intake) which are then transformed in time sequences according to the treatment regimen (e.g., once daily).
We then use population pharmacokinetic models to compute the expected drug concentrations in the plasma of the patient ( ) from drug intake (Figure 1 d, last two boxes). This requires the random assignment of pharmacokinetic parameters whose distributions are obtained from the reported pharmacokinetic models (see Supplementary Material for a brief description of these models). For the considered treatments, pharmacokinetic drug parameters were taken from reported studies.25, 26, 27, 28 For therapy combining efavirenz, emtricitabine, and tenofovir DF, we did not consider medication interactions in absorption or elimination; efavirenz is mostly eliminated by the liver, while the other two medications are eliminated by the kidneys without noticeable interaction.29
Simulations
Using this model, three reported clinical studies were reproduced with the associated virological failure and resistance data.5, 9, 10 For the study of efavirenz monotherapy, a viral load of 50 copies/mL or more at the end of the trial was considered a virological failure. The mutations that were considered were SNPs K103N, Y181C, G190S, M184V, and K65R. Virological failure could occur without resistance mutations or with resistance‐associated mutations when at least 20% of the viral load has major resistance mutations. For the combination therapy, HIV patients were followed for a period of 12–18 months, with blood samples taken approximately every 3 months.9 Patients differed in their level of drug adherence, measured using pharmacy refill records. Virological failure was defined as two consecutive viral loads of 200 RNA copies/mL or above throughout the course of the trial. We replicated this experiment in silico. For this simulation, the same mutations (K103N, Y181C, G190S, M184V, and K65R) were considered. Finally, we used our model to predict virological failure with darunavir/ritonavir therapy for 48 weeks. No mutation was considered, since darunavir was shown to possess a high genetic barrier against resistance and because we considered a short trial in virologically suppressed patients.30
We used a stratified random sample to investigate the sensitivity of model predictions to the components mentioned above: drug adherence, and the within‐host viral load growth rate. Simulations were run by groups of 300 individuals characterized by the same drug intake behavior, represented by the general level of adherence and the PIM (probability of drug intake following a missed dose), and being in the same infection phase (acute or chronic). The general level of adherence could take values from 10–100% by 10% increments. The PIM could take values from 5% to a maximum mathematically allowable value determined by the general level of adherence, by 5% increments. For each drug or drug combination, we simulated the virological outcomes of 1,200–12,000 virtual individuals per general level of adherence. The risk of virological outcome for each adherence group was computed using a weighted average. The corresponding weights were chosen based on the assumption of a stratified random sample from a patient population (see Supplementary Material for the specific values). In order to evaluate the extent of the variation in the percentage of virtual patients experiencing virological failure between trials, the minimum and maximum values were obtained for each adherence groups and are displayed in Figures 6, 7.
Figure 6.
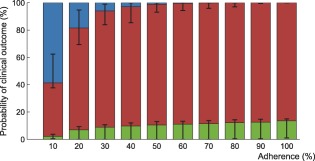
Interindividual variability in the probability of virological outcome under efavirenz monotherapy as a function of adherence. The impact of model variability in adherence patterns and infection phase is displayed using whiskers on the graph. The proportion of individuals without virological failure (green), with virological failure and resistance mutations (red), and with virological failure and no resistance mutations (blue) are represented.
Figure 7.
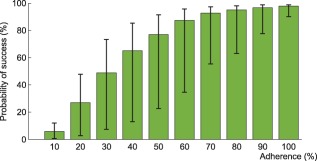
Interindividual variability in the probability of virological success under efavirenz, tenofovir disoproxil fumarate, emtricitabine combination therapy as a function of adherence. The impact of model variability in adherence patterns and infection phase is displayed using whiskers on the graph.
An alternative model was used for the impact of lymph node drug penetration. The model was identical to the model described above, with the exception that the intracellular drug concentration of CD4+ T cells located in the lymph node was set equal to that of peripheral blood mononuclear cells (kl = 1).
All models were numerically implemented and simulations were carried using MatLab 2014a.21
RESULTS
Using the model that accounts for incomplete lymph node penetration (the main model, not the alternative model), we obtained the virological outcomes for efavirenz monotherapy and efavirenz, emtricitabine, and tenofovir combination therapy (Figures 2, 3). For efavirenz monotherapy, a majority of virtual patients having a general level of adherence of 20% or more had virological failure with resistance at the end of 48 weeks. In comparison, two out of three macaques having plasma drug concentrations similar to those of simulated patients had high viral loads and significant resistance within the first 42 weeks of therapy.5 For the treatment combination, predictions of virological failure (green bars) are displayed along a regression curve that is based on clinical data.9 Compared to the regression curve, more virtual patients having an adherence level between 20% and 60% experienced virological success. The opposite is true for patients with a level of drug adherence of 10% or 70% and above. For treatment with darunavir/ritonavir, simulation results are only reported for those with full adherence (100%), as no comparative data were found for the case of low adherence. The results were sensitive to small changes in the level of lymph node drug penetration kl, as confirmed by a sensitivity analysis with kl varying from 0.5–2.0% (the reported value was 1%8). Virological failure was obtained for 13–48% of individuals, depending on the value of kl that was used, compared to a reported value of 14%.10
Figure 2.
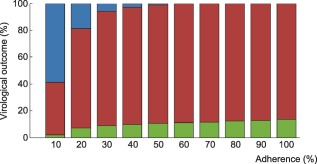
Probability of virological outcomes as a function of adherence under efavirenz monotherapy. The proportion of individuals without virological failure (green), with virological failure and resistance mutations (red), and with virological failure and no resistance mutations (blue) are represented.
Figure 3.
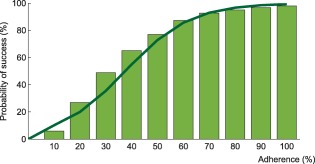
Probability of virological success as a function of adherence under efavirenz, tenofovir disoproxil fumarate, and emtricitabine combination therapy. The model prediction for virological success is illustrated by the green bars and compared to a regression curve fitting clinical data (green line).30
Results from the alternative model (complete lymph node drug penetration from the plasma) for efavirenz monotherapy and the combination therapy are displayed in Figures 4 and 5, respectively. No virological failure was predicted by this model for darunavir/ritonavir therapy. In comparison with the model accounting for incomplete lymph node drug penetration, a smaller number of cases of virological failure was obtained using the alternative model.
Figure 4.
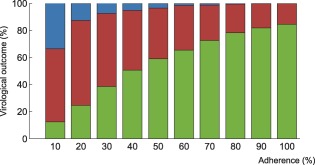
Probability of virological outcomes as a function of adherence under efavirenz monotherapy with complete lymph node penetration. The proportion of individuals without virological failure (green), with virological failure and resistance mutations (red), and with virological failure and no resistance mutations (blue) are represented.
Figure 5.
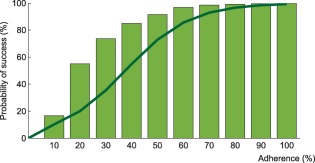
Probability of virological success as a function of adherence under efavirenz, tenofovir disoproxil fumarate, and emtricitabine combination therapy: results from the model assuming complete lymph node penetration for all drugs. The model prediction for virological success is illustrated by the green bars and compared to a regression curve fitting clinical data (green line).9
Within each adherence group, model predictions significantly differed in terms of PIM and infection phase (Figures 6, 7). The lower and higher limit for the green bar represent patients in the acute infection phase who have the lowest PIM and in the chronic infection phase who have the highest PIM, respectively.
DISCUSSION
The main objective of this study was to develop a model able to reproduce the expected or observed relationships between patients' drug use and clinical outcome for several treatments: efavirenz monotherapy, efavirenz/tenofovir disoproxil fumarate/emtricitabine combination therapy, and boosted darunavir (ritonavir) monotherapy. The effect of three model components on virological failure predictions were also investigated: lymph node drug penetration, the PIM, and the viral load growth rate through a distinction of the acute and chronic infection phases.
The approach used in this study enabled the evaluation of hypotheses regarding the pathogenesis of virological failure. Indeed, since the parameter values used in the current model are fully supported by independent studies, an observed discrepancy between predictions and observations puts into question the veracity of at least one of the model assumptions. However, a satisfactory clinical prediction under various therapeutic contexts using a specific set of hypotheses suggests both the plausibility of model assumptions and the potential utility of the model in evaluating the risk of virological failure and resistance in patients.
The model we developed has significantly increased the accuracy of predictions for efavirenz monotherapy. Indeed, a previous model predicted virological success for all adherent patients under the regimen, a result that is inconsistent with a reported animal study.4, 5 For the combination treatment, there was a high level of agreement between the regression fit of the observed clinical data and model predictions. However, for those who were less adherent, the model underestimated the number of cases of virological failure. A possible explanation for the discrepancy could originate from the lack of precision in the obtained PIM distribution due to a smaller sample size for those with very low drug adherence (see Supplementary Material). Those with a lower PIM tended to have less virological success (Figures 6, 7), hence it is possible that those with a low level of adherence are more likely to take long drug holidays than what was estimated. Furthermore, it was not possible to assess the proportion of patients from the reported trial who were in the acute infection phase. We assumed that the great majority (90%) were in the chronic infection phase, but predictions may have been impacted by deviations from this assumption. For treatment with darunavir/ritonavir, the intracellular concentration ratio between mononuclear cells from lymph nodes and peripheral blood was very small for this drug and estimated to be 1%.8 When kl is small, its variation can have a significant impact on the predicted lymph node drug concentration (compared to the reported 1% drug penetration for darunavir, a value of 0.5% leads to a decrease of 50% in drug concentration, while a value of 2% doubles the drug concentration). Model predictions coincided with the clinically observed proportion of virological failure when this ratio was assumed to be 1.9%.8
The results suggest that low drug penetration in lymph nodes can account for a large proportion of cases of virological failure. It can also account for a significant number of cases that could not be solely explained by plasma drug exposure. Whether or not this means that lymph node drug exposure is responsible for these cases is debatable. However, we argue that higher drug concentrations in these biological structures are likely to have a significant impact on viral loads. Since the action of most antiretrovirals is centered around preventing the infection of healthy T cells, an underlying condition for this hypothesis would be that a large number of cell infection events occur there, as suggested by the following. Indeed, there is evidence that virus producing T cells mainly infect cells located in their vicinity,32 therefore a sufficient number of virus‐producing and healthy cells are required in lymph nodes in order for infection events to occur locally. Lymphatic tissues, including lymph nodes, are major sites where the viruses are produced.32, 33 Whether the infection occurred in the same biological structure or in different tissues is unknown (lymphocytes exhibit complex homing and recirculation dynamics).34 Unfortunately, little information is available regarding the dynamics of healthy CD4+ T cells within human organs. T cells migrate from the blood to many organs. They spend a relatively short amount of time circulating in the blood of healthy subjects (average of 2.3 h).35 Furthermore, it was estimated that, at any given moment, only 5.5% of CD4+ T cells capable of trafficking to peripheral blood are located therein.35 In healthy mice, CD4+ T cells passage in the lungs and liver has been estimated to be quite rapid (less than a minute), compared to their passage in the spleen (∼2 h), or in lymph nodes or gut (10 hours).36 It is also known that CD4+ T cells are depleted from the gut of patients upon infection.37 In SIV‐infected macaques, this phenomenon is observed at all stages of infection.38 These arguments suggest that healthy CD4+ T cells likely reside in lymph nodes for a long period compared to other secondary lymphoid organs, increasing the likelihood of infection events occurring in these structures.
From these considerations, a high drug concentration inside lymph node T cells is desirable, but not observed for many drugs.8 However, we argue against changes in drug formulation or therapeutic administration that would solely favor lymph node penetration without providing therapeutic plasma concentrations. Indeed, other physiological compartments could host a large number of cell infection events (e.g., spleen). We assumed that, in such compartments, cell infection activity is either suppressed by the drugs during treatment, occurs concomitantly with lymph node activity, or occurs at a small scale without altering the predicted outcome. This consequently allowed model predictions to be solely based on the evolution of the viral population in lymph nodes. If, however, therapeutic drug concentrations for all viral strains are observed in the lymph nodes but not in a different compartment, then new cell infections in the latter may become responsible for rebounds and the selection of resistance mutations. We believe model predictions of virological failure could still be performed in such cases by replacing the parameter value associated with lymph node drug penetration with its respective value in the new drug‐limited compartment.
Additional HIV compounds and combinations could be investigated using the developed model. Trial predictions can be performed by modifying model parameters according to drug pharmacokinetics, in vitro efficacy curves, and the intracellular concentration in peripheral blood mononuclear cells and mononuclear cells located in various secondary lymphoid tissues. Even though the model focuses on predicting the outcome of groups of patients, individualized risk evaluation can be performed. The procedure involves simulating virological outcomes for a group of virtual patients having common characteristics, such as adherence behavior, drug disposition, and the rate of viral load growth during rebounds. The utility of individualized predictions is highlighted by the impact of interindividual variability in PIM and viral load growth rate (Figures 6 and 7). However, a full individualization still depends on our capacity to gather patient‐specific data.
The scope of the model can be extended to predict other virological outcomes and tackle more complex therapeutic cases. Modifications to the structural model, however, could be required. Indeed, the model predicts virological failure and resistance both based on threshold values applied to a viral load. Accurate viral load predictions would likely require simulating the dynamics of viral populations and drug effect in all of the important compartments concomitantly. Furthermore, many components of the immune system (CD8+, follicular dendritic cells)39 as well as the processes governing latent cells activation were not explicitly modeled; this may impact the ability of the model to predict virological failure over more extended periods or in the case of patients suffering from AIDS. The model would also benefit from a better understanding of the pharmacokinetics of drugs in specific body compartments: so far, it was assumed that there is rapid equilibrium in drug concentrations between all relevant compartments, which may not be a good approximation for all drugs. Overall, the current model can be used as a backbone for the investigation of diverse situations.
In summary, the translational approach adopted here is in line with the increasingly popular Quantitative Systems Pharmacology. It suggests that antiretroviral drug outcomes, such as virological failure and the development of resistance, can be demystified by integrating current scientific knowledge. We consider that the model developed herein is a promising step forward to clinical prediction and to the understanding of the pathogenesis of virological failure in vivo.
Supporting information
SUPPORTING INFORMATION.
Figure S1. Number of infected CD4+ T cells (black) and number of plasma virions (gray) over time.
Table S1. Distribution of weight values associated with the probability of pill intake following a missed dose (PIM), per adherence level. These are used to obtain population prevalence estimates of virological outcomes.
Table S2. Plasma protein binding correction kp,18 lymph node penetration kl,19 and variability in the susceptibility of wildtype virus in the population.3, 27, 28, 29
The supplementary files are the following:
Matlab files that allow running a simulation of the viral kinetics of multiple patients (Sanche_Matlab_model_code_and_data.zip)
Supplementary material
Acknowledgments
To Dr. Mark Wainberg, whose dedication and passion for the HIV cause will continue to inspire us and elicit our admiration. The authors acknowledge the help of Lindsay L. Gordon in clarifying study details, and ViiV Healthcare for providing data regarding the use of efavirenz monotherapy. This study was supported by the Natural Sciences and Engineering Research Council of Canada and the Fonds de Recherche Santé Québec.
Conflict of Interest/Disclosure
The authors declare no conflicts of interest.
Author Contributions
S.S. designed the research, performed the research and analyzed the data. N.S., Y.M., and M.W. provided clinical expertise. F.H. and J.L. participated in designing the research. All authors participated in the writing of the article.
This article was published online on 27 May 2017. After online publication, additional author information was inserted. This notice is included to indicate that this was updated online on 14 June 2017.
References
- 1. Shen, L. et al Dose‐response curve slope sets class‐specific limits on inhibitory potential of anti‐HIV drugs. Nat. Med. 14, 762–766 (2008). [DOI] [PMC free article] [PubMed] [Google Scholar]
- 2. Young, S.D. , et al L‐743, 726 (DMP‐266): a novel, highly potent nonnucleoside inhibitor of the human immunodeficiency virus type 1 reverse transcriptase. Antimicrob. Agents Chemother. 39(12), 2602–2605 (1995). [DOI] [PMC free article] [PubMed] [Google Scholar]
- 3. Bristol‐Myers Squibb . Sustiva (efavirenz): highlight of prescribing information. Technical report, Bristol‐Myers Squibb (2015).
- 4. Rosenbloom, D.I.S. , Hill, A.L. , Rabi, S.A. , Siliciano, R.F. & Nowak, M.A. Antiretroviral dynamics determines HIV evolution and predicts therapy outcome. Nat. Med. 18, 1378–1385 (2012). [DOI] [PMC free article] [PubMed] [Google Scholar]
- 5. Hofman, M.J. et al Efavirenz therapy in rhesus macaques infected with a chimera of simian immunodeficiency virus containing reverse transcriptase from human immunodeficiency virus type 1. Antimicrob. Agents Chemother. 48, 3483–3490 (2004). [DOI] [PMC free article] [PubMed] [Google Scholar]
- 6. Craig, M. , González‐Sales, M. , Li, J. & Nekka, F. Approaching pharmacometrics as a paleontologist would: recovering the links between drugs and the body through reconstruction. CPT Pharmacometrics Syst. Pharmacol. 5, 158–160 (2016). [DOI] [PMC free article] [PubMed] [Google Scholar]
- 7. Sorger, P.K. et al Quantitative and systems pharmacology in the post‐genomic era: new approaches to discovering drugs and understanding therapeutic mechanisms In An NIH White Paper by the QSP Workshop Group 1–48 (NIH, Bethesda, MD, 2011). [Google Scholar]
- 8. Fletcher, C.V. et al Persistent HIV‐1 replication is associated with lower antiretroviral drug concentrations in lymphatic tissues. Proc. Natl. Acad. Sci. U. S. A. 111, 2307–2312 (2014). [DOI] [PMC free article] [PubMed] [Google Scholar]
- 9. Gordon, L.L. , Gharibian, D. , Chong, K. & Chun, H. Comparison of HIV Virologic Failure Rates Between Patients with Variable Adherence to Three Antiretroviral Regimen Types. AIDS Patient Care STDs 29, 384–388 (2015). [DOI] [PubMed] [Google Scholar]
- 10. Antinori, A. et al Week 48 efficacy and central nervous system analysis of darunavir/ritonavir monotherapy versus darunavir/ritonavir with two nucleoside analogues. Aids 29, 1811–1820 (2015). [DOI] [PubMed] [Google Scholar]
- 11. Ioannidis, J.P.A. , et al Dynamics of HIV‐1 viral load rebound among patients with previous suppression of viral replication. AIDS 14, 1481–1488 (2000). [DOI] [PubMed] [Google Scholar]
- 12. Ribeiro, R.M. , Qin, L. , Chavez, L.L. , Li, D. , Self, S.G. & Perelson, A.S. Estimation of the initial viral growth rate and basic reproductive number during acute HIV‐1 infection. J. Virol. 84, 6096–6102 (2010). [DOI] [PMC free article] [PubMed] [Google Scholar]
- 13. Sampah, M.E.S. , Shen, L. , Jilek, B.L. & Siliciano, R.F. Dose‐response curve slope is a missing dimension in the analysis of HIV‐1 drug resistance. Proc. Natl. Acad. Sci. U. S. A. 108, 7613–7618 (2011). [DOI] [PMC free article] [PubMed] [Google Scholar]
- 14. Dixit, N.M. , Markowitz, M. , Ho, D.D. & Perelson, A.S. Estimates of intracellular delay and average drug efficacy from viral load data of HIV-infected individuals under antiretroviral therapy. Antiviral Ther. 9, 237–246 (2004). [PubMed] [Google Scholar]
- 15. Markowitz, M. et al A novel antiviral intervention results in more accurate assessment of human immunodeficiency virus type 1 replication dynamics and T‐cell decay in vivo. J. Virol. 77, 5037–5039 (2003). [DOI] [PMC free article] [PubMed] [Google Scholar]
- 16. Abram, M.E. , Ferris, A.L. , Shao, W. , Alvord, G.W. & Hughes, S.H. Nature, position, and frequency of mutations made in a single cycle of HIV‐1 replication. J. Virol. 84, 9864–9878 (2010). [DOI] [PMC free article] [PubMed] [Google Scholar]
- 17. Parkin, N.T. et al Natural variation of drug susceptibility in wild‐type human immunodeficiency virus type 1. Antimicrob. Agents Chemother. 48, 437–443 (2004). [DOI] [PMC free article] [PubMed] [Google Scholar]
- 18. Gilead Sciences Inc . Product Monograph: Emtriva (Emtricitabine Capsules). Technical report. Foster City, CA: Gilead Sciences (2008).
- 19. Gilead Sciences Inc . Product Monograph: Viread (Tenofovir Disoproxil Fumarate). Technical report. Foster City, CA: Gilead Sciences (2013).
- 20. Janssen Inc . Monographie de produit: Prezista. Technical report. Beerse, Belgium: Janssen (2014).
- 21. Jilek, B.L. et al A quantitative basis for antiretroviral therapy for HIV‐1 infection. Nat. Med. 18, 446–451 (2012). [DOI] [PMC free article] [PubMed] [Google Scholar]
- 22. Acosta, E.P. et al Novel method to assess antiretroviral target trough concentrations using in vitro susceptibility data. Antimicrob. Agents Chemother. 56, 5938–5945 (2012). [DOI] [PMC free article] [PubMed] [Google Scholar]
- 23. Girard, P. , Blaschke, T.F. , Kastrissios, H. & Sheiner, L.B. A Markov mixed effect regression model for drug compliance. Stat. Med. 17, 2313–2333 (1998). [DOI] [PubMed] [Google Scholar]
- 24. Wong, D. , Modi, R. & Ramanathan, M. Assessment of Markov‐dependent stochastic models for drug administration compliance. Clin. Pharmacokinet. 42, 193–204 (2003). [DOI] [PubMed] [Google Scholar]
- 25. Sánchez, A. et al Population pharmacokinetic/pharmacogenetic model for optimization of efavirenz therapy in caucasian HIV-infected patients. Antimicrob. Agents Chemother. 55, 5314–5324 (2011). [DOI] [PMC free article] [PubMed] [Google Scholar]
- 26. Valade, E. et al Population pharmacokinetics of emtricitabine in HIV‐1-infected adult patients. Antimicrob. Agents Chemother. 58, 2256–2261 (2014). [DOI] [PMC free article] [PubMed] [Google Scholar]
- 27. Baheti, G. , Kiser, J.J. , Havens, P.L. & Fletcher, C.V. Plasma and intra–cellular population pharmacokinetic analysis of tenofovir in HIV‐1-infected patients. Antimicrob. Agents Chemother. 55, 5294–5299 (2011). [DOI] [PMC free article] [PubMed] [Google Scholar]
- 28. Moltó, J. et al Simultaneous pharmacogenetics‐based population pharmacokinetic analysis of darunavir and ritonavir in HIV-infected patients. Clin. Pharmacokinet. 52, 543–553 (2013). [DOI] [PubMed] [Google Scholar]
- 29. Blum, R.M. , Chittick, G.E. , Begley, J.A. & Zong, J. Steady‐state pharmacokinetics of emtricitabine and tenofovir disoproxil fumarate administered alone and in combination in healthy volunteers. J. Clin. Pharmacol. 47, 751–759 (2007). [DOI] [PubMed] [Google Scholar]
- 30. Dierynck, I. et al Binding kinetics of darunavir to human immunodeficiency virus type 1 protease explain the potent antiviral activity and high genetic barrier. J. Virol. 81, 13845–13851 (2007). [DOI] [PMC free article] [PubMed] [Google Scholar]
- 31. MATLAB . 8.3.0.532 (R2014a). The MathWorks, Natick, MA (2014).
- 32. Haase, A.T. Population biology of HIV‐1 infection: viral and CD4+ T cell demographics and dynamics in lymphatic tissues. Annu. Rev. Immunol. 17, 625–656 (1999). [DOI] [PubMed] [Google Scholar]
- 33. Haase, A.T. et al Quantitative Image Analysis of HIV‐1 Infection in Lymphoid Tissue. Science 274, 985–989 (1996). [DOI] [PubMed] [Google Scholar]
- 34. Wiedle, G. , Dunon, D. & Imhof, B.A. Current concepts in lymphocyte homing and recirculation. Crit. Rev. Clin. Lab. Sci. 38, 1–31 (2001) [DOI] [PubMed] [Google Scholar]
- 35. Savkovic, B. et al T‐lymphocyte perturbation following large‐scale apheresis and hematopoietic stem cell transplantation in HIV-infected individuals. Clin. Immunol. (Orlando, FL) 144, 159–171 (2012). [DOI] [PubMed] [Google Scholar]
- 36. Ganusov, V.V. & Auerbach, J. Mathematical modeling reveals kinetics of lymphocyte recirculation in the whole organism. PLoS Comput. Biol. 10, e1003586 (2014). [DOI] [PMC free article] [PubMed] [Google Scholar]
- 37. Brenchley, J.M. CD4+ T Cell Depletion during all Stages of HIV Disease Occurs Predominantly in the Gastrointestinal Tract. J. Exp. Med. 200, 749–759 (2004). [DOI] [PMC free article] [PubMed] [Google Scholar]
- 38. Veazey, R.S. & Lackner, A.A. Getting to the guts of HIV pathogenesis. J. Exp. Med. 200, 697–700 (2004). [DOI] [PMC free article] [PubMed] [Google Scholar]
- 39. De Boer, R.J. , Ribeiro, R.M. & Perelson, A.S. Current estimates for HIV‐1 production imply rapid viral clearance in lymphoid tissues. PLoS Comput. Biol. 6, e1000906 (2010). [DOI] [PMC free article] [PubMed] [Google Scholar]
Associated Data
This section collects any data citations, data availability statements, or supplementary materials included in this article.
Supplementary Materials
SUPPORTING INFORMATION.
Figure S1. Number of infected CD4+ T cells (black) and number of plasma virions (gray) over time.
Table S1. Distribution of weight values associated with the probability of pill intake following a missed dose (PIM), per adherence level. These are used to obtain population prevalence estimates of virological outcomes.
Table S2. Plasma protein binding correction kp,18 lymph node penetration kl,19 and variability in the susceptibility of wildtype virus in the population.3, 27, 28, 29
The supplementary files are the following:
Matlab files that allow running a simulation of the viral kinetics of multiple patients (Sanche_Matlab_model_code_and_data.zip)
Supplementary material


