Abstract
Ursolic acid (UA) and oleanolic acid (OA) are insoluble drugs. The objective of this study was to encapsulate them into β-cyclodextrin (β-CD) and compare the solubility and intermolecular force of β-CD with the two isomeric triterpenic acids. The host-guest interaction was explored in liquid and solid state by ultraviolet-visible absorption,1 H NMR, phase solubility analysis, and differential scanning calorimetry, X-ray powder diffractometry, and molecular modeling studies. Both experimental and theoretical studies revealed that β-CD formed 1: 1 water soluble inclusion complexes and the complexation process was naturally favorable. In addition, the overall results suggested that ring E with a carboxyl group of the drug was encapsulated into the hydrophobic CD nanocavity. Therefore, a clear different inclusion behavior was observed, and UA exhibited better affinity to β-CD compared with OA in various media due to little steric interference, which was beneficial to form stable inclusion complex with β-CD and increase its water solubility effectively.
Keywords: β-cyclodextrin, oleanolic acid, ursolic acid, host-guest interaction, molecular modeling
Introduction
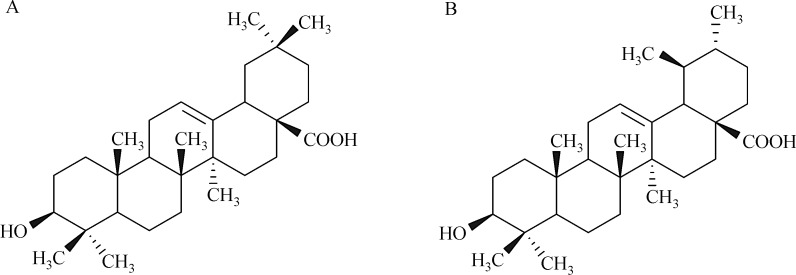
Ursolic acid (UA) and its isomer oleanolic acid (OA) are pentacyclic triterpenes which naturally coexist in many herbs, and draw much attention due to their various biologic activities, such as anti-inflammatory, antioxidative, anti-protozoal, anti-mutagenic and anti-cancer properties[1–4]. The chemical structures of OA and UA are shown in Fig. 1; they have similar structures except the location of one methyl group on ring E, which leads to a great difference in physicochemical properties. Though both UA and OA have numerous pharmacological effects, their biologic activities are limited due to their poor water-solubility. Various drug delivery systems, such as micelles, inclusion complexes, nanoparticles, and liposomes, have been developed to improve the solubility and bioavailablity of lipophilic drugs[5]. A promising solution to the solubility problem of lipophilic drugs might be the formation of its inclusion complexes with cyclodextrins (CDs).
Fig.1.
Chemical structure of oleanolic acid (A) and ursolic acid (B).
CDs are cone-shaped cyclic oligosaccharides composed of an α-(1, 4) linkage in their C 1 chair conformation. The most common members are α-, β-, and γ-CD, which contain 6, 7, and 8 units of glucopyranose, respectively[6]. With a hydrophilic outer surface and hydrophobic cavity, CDs become one of the most promising hosts for constructing inclusion complexation due to its good biocompatibility and excellent capacity to encapsulate a variety of small guest molecules[7–10]. Up to present, many guests of suitable size and shape are known to form inclusion with specific CDs and solubility was significant increased. The intermolecular forces which lead to the formation of inclusion complexation should include van der Waals interaction, electrostatic interaction, hydrogen bonding, hydrophobic interaction, charge-transfer interaction, release of conformational strain and exclusion of cavity-bound high-energy[11].
In the last decade, CDs have been widely used to form inclusion complexes with various drugs for different purposes, the investigation of such interaction with unstudied drugs or existing ones is of great importance; this includes the subject of this work, namely triterpenes acid-based drugs[12-13]. Among the CDs, β-CD is the most commonly used, based on its low cost, availability, and complex-forming capacity. For these reasons, the main objective of the present study was to prepare and compare the inclusion complex of the isomer drugs, UA and OA, with β-CD in the aqueous and solid state.
In this paper, UV spectroscopy and 1H NMR were used to study the interaction of β-CD with UA and OA in solution. To explore host-guest interaction, the complexes were characterizedvia phase solubility diagram, and then the thermodynamic parameters were also obtained to evaluate the driving forces to complex formation. In addition, the formulations of β-CD: UA inclusion complex (β-CD-UA) and β-CD: UA inclusion complexes (β-CD-OA) were optimized and the characteristics were determined by DSC and X-ray diffraction. Furthermore, the most probable structure of 1:1 inclusion complex was proposed by molecular docking studies.
Materials and methods
Materials
Oleanolic acid (OA, purity>98%) and ursolic acid (UA, purity>98%) were purchased from Shanxi Huisheng Medicament Technology Corp. (Shanxi, China). β-cyclodextrin (β-CD) was kindly provided by Guangdong Yunan Circlar Dextrin Factory (Guangdong, China). High performance liquid chromatography (HPLC) grade methanol was obtained from Shanghai Ludu Reagent Co. (Shanghai, China). Acetic acid (AR grade) was purchased from Shanghai Lingfeng Chemical Reagent Co., Ltd (Shanghai, China). All other chemical were of analytical reagent grade.
The interaction of β-CD with OA and UA in aqueous solution
One-dimensional 1H NMR spectra for UA, OA, β-CD and their complexes were recorded on a Bruker AV400 MHz spectrometer using an inverse broadband (BBI) probe at room temperature. Samples were dissolved in DMSO-d6.
Furthermore, absorption spectra obtained with various concentrations of β-CD (0 to 1.44 mmol/L) and added to a constant drug (0.03753 mmol/L UA or 0.038715 mmol/L OA) concentration in ethanol/water (50%, v/v) were scanned by the UV spectrophotometry (Shimadzu UV-2401 visible spectrophotometer, Shimadzu Corp., Tokyo, Japan). The stability constant was calculated according to the modified Benesi-Hildebrand equation Eq. (1) assuming the formation of a 1:1 host-guest complex[14].
| (1) |
Where was the change in absorbance of drugs at λmax in the presence and absence of β-CD. and were the total concentration of added drug and β-CD, respectively. represented the difference in molar absorptivities between the free drug and the inclusion complex, and was the stability constant.
HPLC
A HPLC method with UV detection at 210 nm was used to determine the concentration of OA and UA as described in our previous studies[15–17]. Dikma Kromasil (100 A C18 5 μm 250 × 4.6 mm) was used for separation and the mobile phase was methanol-water-acetic acid (95:5:0.2, v/v/v). Samples were eluted in isocratic mode with a flow rate of 1.0 mL/minute at 30°C, and the sample injection volume was 20 μL.
Phase solubility analyses
Phase solubility diagrams at different temperatures (298, 308 and 318 K) were obtained according to the method of Higuchi and Connors[18]. Briefly, an adequate amount of UA or OA was mixed in buffer solution (pH 9, 0.2 mol/L HBO 3-Na 2B 4O 7·10H 2O) with β-CD of an increasing concentration ranging from 4 to 8 mmol/L. The samples were continuously shaken for 48 hours after which the equilibrium was reached, and then the suspensions were filtered through a 0.45 μm membrane filter. The filtrate was dissolved in 2 mL MeOH, and sonicated for 30 minutes followed by diluted appropriately for HPLC analysis.
The apparent stability constants were calculated from the corresponding phase solubility diagrams according to the following formula:
| (2) |
Where the was obtained from the plot of UA or OA concentration against β-CD concentration and was the intrinsic solubility of UA or OA in water.
Complexation efficiency (CE) was defined as the solubilizing efficiency of CDs for guest molecule. Based on the results of the phase solubility studies, CE of β-CD for UA and OA was determined using the following equation:
| (3) |
Where denoted the concentration of dissolved complex, was the concentration of dissolved free β-CD and slope was the slope of the phase-solubility profile.
Preparation of solid systems
The solid systems of UA or OA with β-CD were prepared by the stirring method. Briefly, β-CD (0.5 mmol) was solubilized in 30 mL water and an excess amount of UA or OA (0.5 mmol) was added to it. The suspension was stirred at 20°C for 6 hours. The suspension was then filtered through a 0.45 µm Millipore filter and the filtrate was dried by lyophilizer.
Generally, there were many factors that may influence the preparation of the inclusion complexation of β-CD with drug. To investigate the factors which complicatedly affect the preparation, the orthogonal test was used. The orthogonal array was designed and a L 9 (34) table was set as shown inTable 1. The factors were included the molar ratio of drug and β-CD, the time of stirring, the stirring speed, and the temperature of preparation.
Tab.1.
Factor and level of orthogonal experiment design.
| Level | Factor | |||
|---|---|---|---|---|
| A(Molar ratio) | B(h) | C(rpm) | D(°C) | |
| 1 | 1:1 | 4 | 200 | 20 |
| 2 | 1:5 | 6 | 300 | 30 |
| 3 | 1:10 | 8 | 400 | 40 |
Determination of drug loading dosage and solubility of the inclusion
The drug loading dosage of complex was determined as described: dried samples (0.05 g) of UA-β-CD or UA-β-CD was dissolved in 5 mL MeOH, and sonicated for 30 minutes after votexingt for 10 seconds. Then, the samples were filtered through a 0.45 μm membrane filter followed by diluted appropriately for HPLC analysis. Drug loading dosage (DL) of the inclusion was calculated as Eq. (4):
| (4) |
Where denoted the weight of drug loaded in the inclusion, was the weight of the complex.
To determine the solubility of the complex in water, an excess amount of solid complexes were dispersed in 5 mL of distilled water. The flasks were vortexed for 5 minutes and filtered through a 0.45 μm membrane filter followed by dilution appropriately for HPLC analysis.
Solid state characterization
Differential scanning calorimetry (DSC)
DSC thermograms of pure materials, inclusion complexes as well as physical mixtures were determined by Netzsch 204 (Netzsch-Geraetebau GmbH, Selb, Germany) differential scanning calorimetry (DSC). About 5 mg of each sample was weighed into an aluminum pan and sealed hermetically, the scanning rate was 10°C/minute, and the scanning temperature range was from 30°C to 350°C.
Xray diffraction (XRD)
The XRD patterns of samples including UA, OA, β-CD, their complexes and physical mixture were obtained using a Rigaku D/max-rC rotating anode X-ray powder Diffractometer (2500 xt/PC, Akishima-shi, Tokyo, Japan) equipped with a scintillation counter and Cu K a 1 radiation source (wavelength was 0.15406 nm), a voltage of 40 kV, and a current of 100 mA. The samples were scanned with the diffraction angle increasing from 3 to 85° (2β), in continuous scan mode increasing at a step size of 0.02.
Molecular modeling
To rationalize and confirm the experimental results described above, the molecular models of the complexes were calculated. For both inclusion complexes, OA-β-CD and UA-β-CD, two orientations I and II with carboxyl and hydroxyl groups being inserted into the cavity of β-CD, respectively, were constructed, as shown inSupplementary Fig. 1(available online). Then, geometric optimizations were carried out in the framework of density functional theory (DFT) at B3LYP/6-31G (d) level. Frequency calculations were performed to verify whether the optimized geometries were the minima. To evaluate the solvent effects on the electronic structures and energetic properties of the studied systems, DFT methods through polarized continuum model[19-20] (PCM, dielectric constant ε = 78.39 for water) were applied. The interaction energies ( ) between β-CD and OA (or UA) were calculated as following equation:
| (5) |
Where , , and were the monomer energies of β-CD and OA (or UA) and the complex energy of β-CD-OA (or β-CD-OA). All the QM calculations were performed with Gaussian 09 program[21].
The van der Waals and electrostatic interaction term between β-CD and OA (or UA) were analyzed in the polymer consistent force field (PCFF)[22–25], which had been successfully used for describing the conformational and energetic properties of macrocyclic complexes[26]. It has been demonstrated that the polarization model, with conformation-dependent partial charges, is able to reasonably describe the conformations of various organic compounds and peptides in aqueous solutions[27-28]. Thus, the natural bond orbital (NBO)[29] charges of the optimized minima were calculated and embedded into the force field calculations. The van der Waals (UVdW) and electrostatic (UElec) functionals were expressed in Eq. (6) and (7):
| (6) |
| (7) |
In these equations, and were the repulsive and dispersive parameters between atoms i and j, respectively; was the distance between atoms i and j; and were the atomic partial charges centered on atoms i and j, respectively; was the dielectric constant. Here, the electrostatic parameter and were obtained through the NBO calculations at B3LYP/6-31G (d) level[27,28]. Other parameters came from the standard PCFF force field[22–25].
Results
1H NMR studies
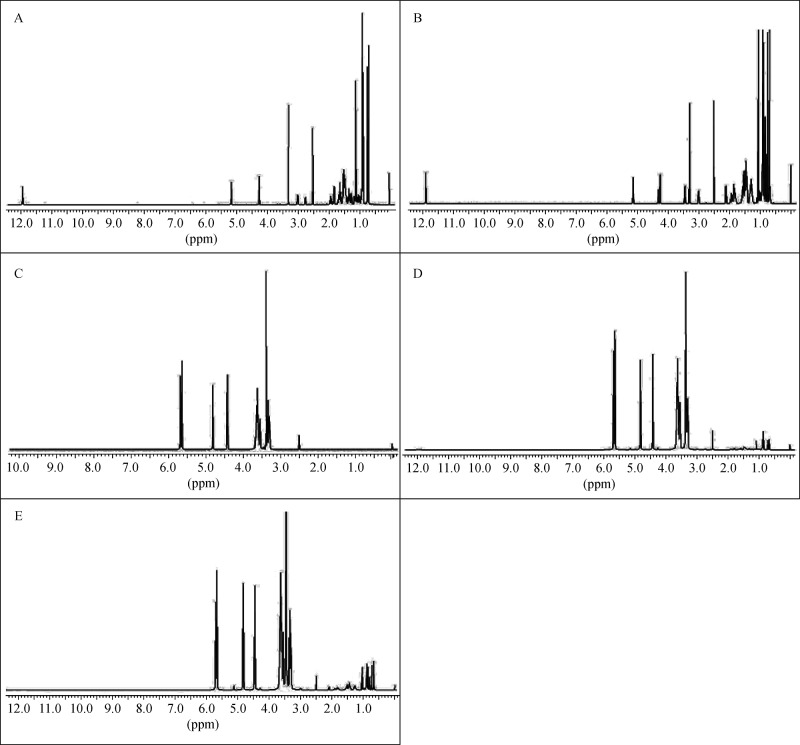
1H NMR spectroscopy is the most effective technique to confirm the formation of CD inclusion as it provides direct and detailed evidence and information[30]. The formation of inclusion complexes generally leads to a notable change of the chemical environment of guest molecules, which is associated with the chemical shift values of both host and guest protons[31]. Compared with the corresponding free drug molecule, carboxyl peak at δ 12 ppm of UA and OA disappeared in the complex (Fig. 2). Further, the chemical shifts of methyl protons (δ 1 ppm) and double bound protons (δ 5.15 ppm) of UA and OA were also moved in upfield significantly, because when UA (or OA) monomer entered into the nano hydrophobic cavity of β-CD, the change of the micro-environment of UA and OA protons resulted in the upfield shift in the ring protons.
Fig.2. 1HNMR spectra of OA and UA in β-CD solutions.
(A) OA, (B) UA, (C) β-CD, (D) OA in β-CD solution, (E) UA in β-CD solution.
UV-visible spectral studies
When the guest molecule was included inside the CD cavity, its spectral characteristics exhibited notable changes. Thus, UV-vis spectrophotometric studies of the interactions of host with guest molecule can be used to determine the stability constants of the inclusion complexes through the spectral changes related to the formation of the inclusion complexes.
The effects of β-CD on the UV-vis absorption spectra of UA and OA are illustrated in Fig. 3. As can be noticed in Fig. 3A, the absorption spectra of both UA and OA showed an obvious decrease in the absorbance as well as the shift of the position of the λ max to longer wavelengths (2-3 nm shift), i.e. bathochromic effect. The reason which was responsible for the phenomenon can be attributed to change of the drug molecules’ environment that the drug was transferred from the polar aqueous phase to the less polar β-CD cavity. Moreover, due to the inclusion of UA or OA by β-CD cavity, the substituent or conjugated structure of the electron delocalization was restricted, which led to the decrease in the absorbance.
Fig.3. The effects of β-CD on the UV-vis absorption spectra of UA and OA.
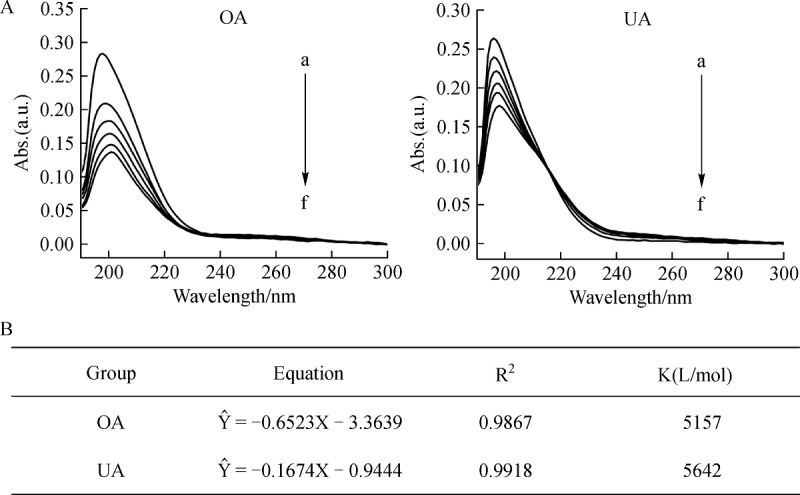
A: Absorption spectra of OA (0.038715 mmol/L) and UA (0.03753 mmol/L) in the presence of growing concentration of β-CD (mmol/L): 0 to 0.89 (a to f). B: Calculated stability constant (K) with coefficient of determination (R2) from UV absorption spectra.
Furthermore, K for the formation of inclusion complexes was identified by analyzing the changes in the absorbance as a function of the β-CD concentration. The calculated formation constants are shown inFig. 3B. Generally, the K values for UA-β-CD system were slightly higher than that of OA-β-CD system.
Phase-solubility studies
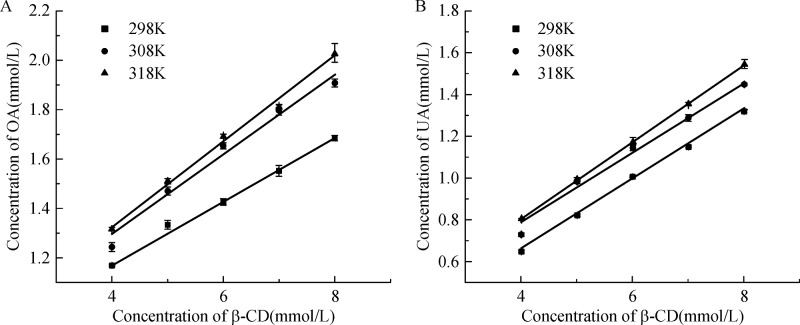
The phase solubility diagrams of both UA and OA toward β-CD at different temperatures are shown, respectively, in Fig. 4. The solubility of UA and OA in presence of β-CD increased with an increase in temperature. In addition, it can be observed that the apparent solubility of UA and OA increased linearly as a function of β-CD concentration over the entire concentration range studied. The same behavior was observed at each of the temperatures studied.
Fig.4.
Phase-solubility diagrams of OA and UA with β-CD in buffer solutions (pH= 9) at various temperatures.
Table 2 displays the values of the stability constants K and complexation efficiency CE of UA and OA with β-CD at different temperatures (298, 308 and 318K). K 1:1-values calculated from Eq. (2) by using S 0 resulted in significantly larger K 1:1-value than when S int was used, although both positive and negative deviations were observed. Furthermore, the difference between the two K 1:1-values was increased with decreasing S 0. Thus, for poorly soluble drugs, the observed CE was more efficient to evaluate the solubilizing effect of cyclodextrin. It was worth noting that CE for β-CD with UA and OA were increased as the increasing temperature, which contributed to the higher solubility at high temperature. However, the decreased value of K, which represented the affinity of the cyclodextrin for both ionized and nonionized drug, indicated the exothermic nature of inclusion complexation[32-33]. In addition, it can be observed as well that both CE and K of UA were higher than those of OA at all temperatures, which was attributed to the little steric interference in agreement with UV-vis absorption study.
Tab.2.
The parameters of OA-β-CD and UA-β-CD in buffer solutions (pH=9) at various temperatures. (n=3)
| OA-β-CD | UA-β-CD | |||||
|---|---|---|---|---|---|---|
| 298K | 308K | 318K | 298K | 308K | 318K | |
| CE(%,W/W) | 0.142 | 0.198 | 0.209 | 0.200 | 0.209 | 0.227 |
| K So(L·mol-1) | 7878 | 7770 | 7702 | 25189 | 20177 | 14372 |
| K Sint(L·mol-1) | 208 | 318 | 328 | − a | 2517 | 3606 |
| ΔG(KJ·mol -1) | −22.23 | −22.94 | −23.66 | −25.11 | −25.38 | −25.31 |
| ΔH(KJ·mol -1) | −891 | −885 | −891 | −22073 | −22244 | −22066 |
| ΔS(J·mol -1·K-1) | 71.60 | 10.46 |
Data are the mean of three determinations.
KSo: The stability constant calculated from Eq. (2) using S0; KSint: The stability constant calculated from Eq. (2) using S int.-a: Sint<0.
Other information can be obtained from the phase solubility data, such as the thermodynamical parameters involved in the complex formation. The integrated form of Van’t Hoff equation (Eq. (8)) allowed to calculate the values of enthalpy and entropy changes, in dependence of the variations of the stability constants with temperature[34–38]:
| (8) |
The Van’t Hoff plots for the complexes UA-β-CD and OA-β-CD showed a linear behavior, as reported inFig. 4. The relative thermodynamic parameters were calculated and are shown in Table 2. The negative values of enthalpy changes ( ) indicated that the interaction processes of both UA and OA with β-CD were exothermic. In contrast, the positive change of was owing to the increased degrees of freedom, due to the highly ordered solvent molecules inside CD cavity and surrounding the guest molecules were displaced. Interestingly, the complex formation in OA-β-CD showed larger and smaller compared with that in UA-β-CD. Therefore, we concluded that the major driven force in OA-β-CD and UA-β-CD was entropy and enthalpy, respectively.
These results indicated that the complexation of UA and OA with β-CD had occurred. The free energy changes ( ) for the interactions involved in the complex formation were calculated using the Gibbs equation (Eq. (9)):
| (9) |
The negative values of for UA and OA, in Table 2, showed that both complexations were spontaneous processes under the experimental condition.
Optimization of solid inclusion complex preparation
There are many methods to prepare the inclusion complexes by previous literatures, and parts of them are suitable to prepare the inclusion of β-CD with OA or UA[39-40]. To ensure the experiment precision, we first investigated several preparation methods which could be easily established by single factor analysis, including triturating, ultrasonic and stirring method. According to the results inSupplementary Table 1 (available online), although the kneaded products exhibited a higher drug loading, the solubility showed a limited improvement because the drugs were mostly dispersed in the complexation instead of being included. However, the stirred products were included better and can be achieved more easily, so the stirring method was chosen.
The statistical results of the orthogonal test are shown in Table 3 and Table 4. From the R value in Table 3 and Table 4, we found that the effect of each factor on the drug loading of OA-β-CD decreased with the order of C, A, D, B, while it was D>C>A>B of UA-β-CD. The results revealed that the speed of stirring (factor C) had a significant effect on the preparation of OA-β-CD (Table 3). The maximum drug loading of UA-β-CD was achieved under the conditions of A1B2C2D2, which was 0.19% (Table 4). Moreover, Table 3 and Table 4 show that the drug loading of both OA-β-CD and UA-β-CD were not satisfied during the entire test, and the drug loading of OA-β-CD was far above which of UA-β-CD.
Tab.3.
Results from L9 (34) orthogonal test for optimization of OA-β-CD complexes preparation.
| Group | A | B | C | D | DL (%, W/W) |
|---|---|---|---|---|---|
| 1 | 1:1 | 4 | 200 | 20 | 0.40 |
| 2 | 1:1 | 6 | 300 | 30 | 1.02 |
| 3 | 1:1 | 8 | 400 | 40 | 1.92 |
| 4 | 1:5 | 4 | 300 | 40 | 0.84 |
| 5 | 1:5 | 6 | 400 | 20 | 1.70 |
| 6 | 1:5 | 8 | 200 | 30 | 0.24 |
| 7 | 1:10 | 4 | 400 | 30 | 0.95 |
| 8 | 1:10 | 6 | 200 | 40 | 0.43 |
| 9 | 1:10 | 8 | 300 | 20 | 0.75 |
| K 1 | 3.33 | 2.19 | 1.07 | 2.85 | |
| K 2 | 2.79 | 3.15 | 2.62 | 2.21 | |
| K 3 | 2.13 | 2.91 | 4.56 | 3.19 | |
| R | 1.21 | 0.96 | 3.49 | 0.98 |
Tab.4.
Results from L9 (34) orthogonal test for optimization of UA-β-CD complexes preparation.
| Group | A | B | C | D | Drug loading dosage (%, W/W) |
|---|---|---|---|---|---|
| 1 | 1:1 | 4 | 200 | 20 | 0.14 |
| 2 | 1:1 | 6 | 300 | 30 | 0.19 |
| 3 | 1:1 | 8 | 400 | 40 | 0.11 |
| 4 | 1:5 | 4 | 300 | 40 | 0.08 |
| 5 | 1:5 | 6 | 400 | 20 | 0.17 |
| 6 | 1:5 | 8 | 200 | 30 | 0.10 |
| 7 | 1:10 | 4 | 400 | 30 | 0.13 |
| 8 | 1:10 | 6 | 200 | 40 | 0.06 |
| 9 | 1:10 | 8 | 300 | 20 | 0.16 |
| K 1 | 0.44 | 0.35 | 0.30 | 0.47 | |
| K 2 | 0.34 | 0.42 | 0.43 | 0.42 | |
| K 3 | 0.35 | 0.37 | 0.41 | 0.25 | |
| R | 0.10 | 0.07 | 0.13 | 0.22 |
Solid state characterization
Differential scanning calorimetry (DSC)
The DSC method offers useful insights on host-guest solid state interactions. In general, with the guest molecules entering into CD nanocavities, the melting and sublimation points will shift to different temperature or disappeared[41]. DSC thermograms for OA, UA, β-CD as well as the corresponding inclusion complexes and physical mixture are shown inFig. 5. As can be noticed from Fig. 5(a), β-CD showed a very broad peak, which attained a maximum around 110°C due to release of water molecules and peak at approximately 330°C corresponding to its melting point. However, in pure OA and UA, a sharp endothermic peak which was characteristic meting point of anhydrous crystalline was obtained at 312°C and 289°C. Comparison of the DSC curves of physical mixture with the inclusion complexation prepared by stirring method confirmed an interaction between β-CD and UA (or OA). In fact, the characteristic peaks observed in the individual guest molecules were found in the physical mixture. Interestingly, the disappearance of the melting peak of drug molecules and a notable shift in the position of β-CD dehydration peak toward lower temperature was observed in the inclusion complexation system, respectively, which indicated molecular encapsulation of the drug inside the CD cavity.
Fig.5. DSC thermograms.
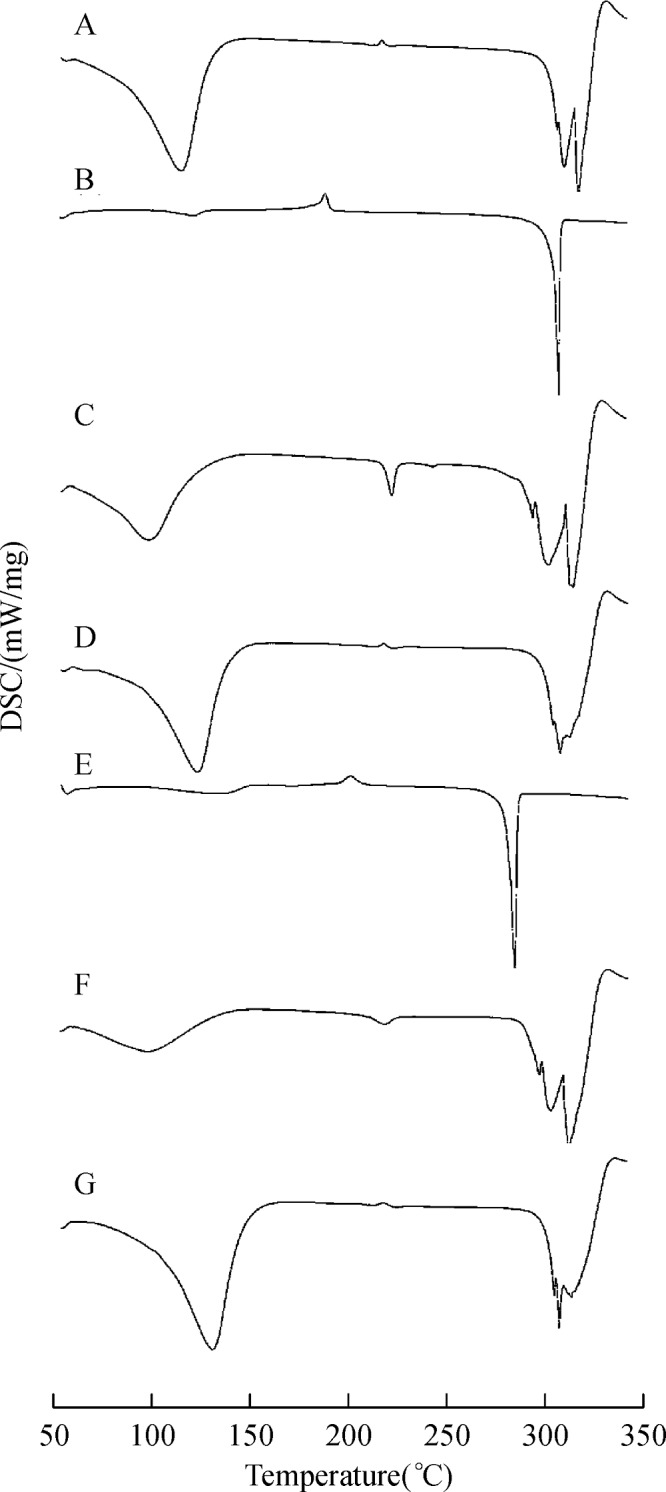
A: β-CD, B: OA, C: OA-β-CD, D: OA and β-CD physical mixture, E: UA, F: UA-β-CD, G: UA and β-CD physical mixture.
XRD analysis
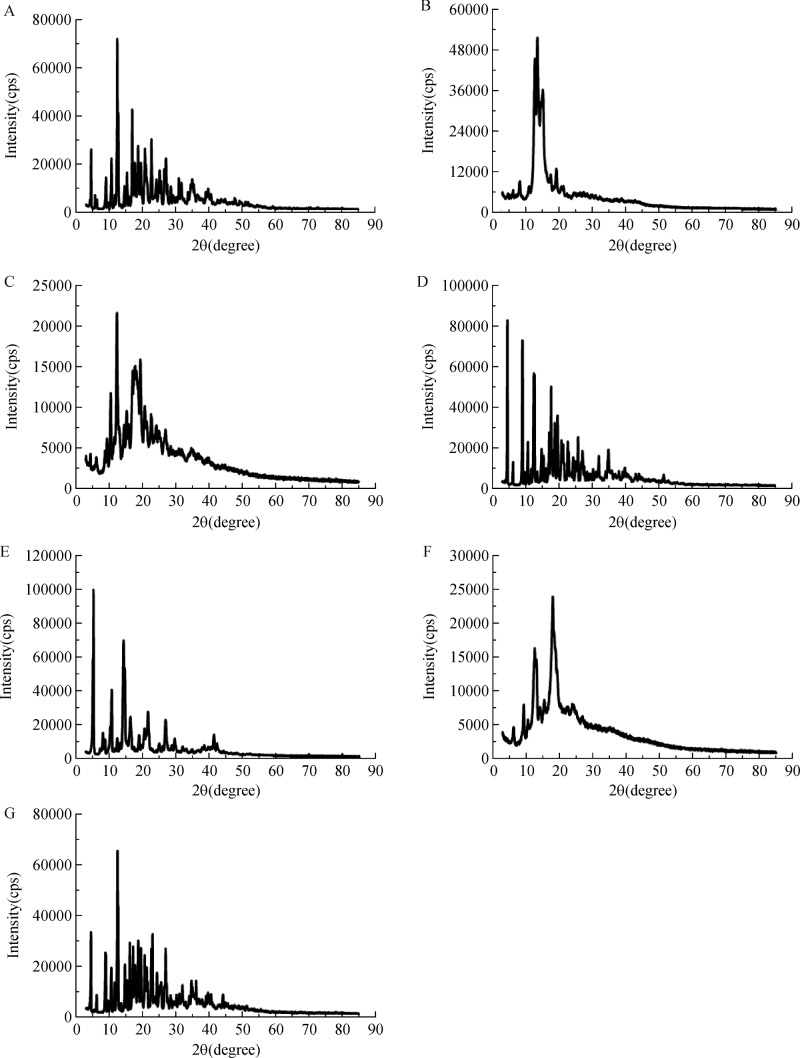
XRD is a supplementary technology for the formation of CDs inclusion complexes. The diffractograms of UA, OA, β-CD and their relative physical mixtures and inclusion complexes are presented inFig. 6. As illustrated in Fig. 6A, β-CD exhibited many crystalline peaks between 5° and 85°, indicating that β-CD mainly existed in a crystalline form. Similarly in OA and UA, the crystalline nature was confirmed by a series of sharp peaks. The XRD of the physical mixture of drugs (OA or UA) and β-CD showed approximate superimposition of the individual components patterns, confirming that no chemical association was occurred, and both kept their original physical characteristics. In contrast, the XRD spectrum of the inclusion complexes showed considerable diversity when comparing with the pure drugs as well as β-CD. Through comparative analysis of existing data, we considered that the crystal structure of β-CD and inclusion complex were different, which indicated the formation of inclusion complex.
Fig.6. X-ray thermograms.
β-CD, B: OA, C: OA-β-CD, D: OA and β-CD physical mixture, E: UA, F: UA-β-CD, G: UA and β-CD physical mixture.
Molecular modeling studies
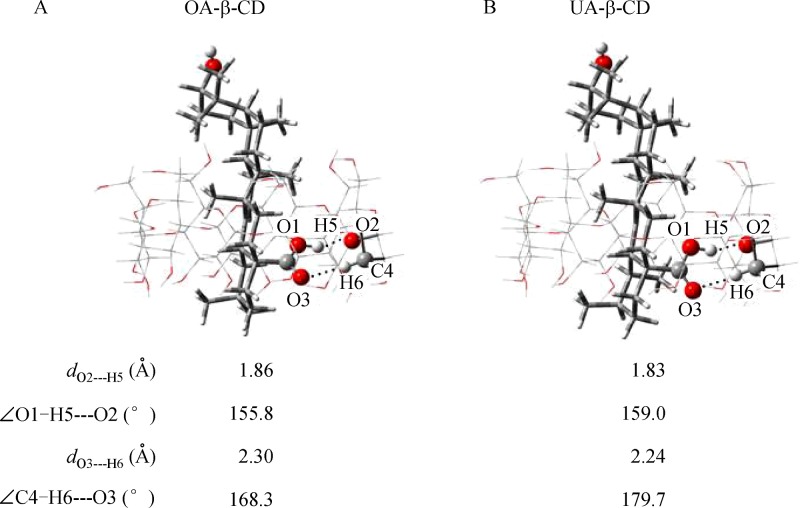
The theoretical calculations using DFT method at B3LYP/6-31G (d) level were employed to understand the mechanism of the inclusion complexation of OA and UA into β-CD. Two possible orientations were considered, including the carbonyl group oriented to the center of the CD cavity, named orientation I, and the hydroxyl group oriented to the center of the CD cavity, named orientation II (Supplementary Fig. 1, available online). The optimized OA-β-CD and UA-β-CD complex structures with orientation II are shown in Supplementary Fig. 2, available online. During the optimization, the OA and UA molecules moved out from the β-CD. In contrast, the most stable structures for both OA-β-CD and UA-β-CD were demonstrated to have orientation I in which the carbonyl group was located within the CD cavity through intermolecular hydrogen bonds (Fig. 7).
Fig.7.
Optimized structures as well as hydrogen-bonding parameters of the OA-β-CD (A) and UA-β-CD (B) complexes with hydroxyl group being inserted in the cavity of β-CD (orientation II) at B3LYP/6-31G (d) level.
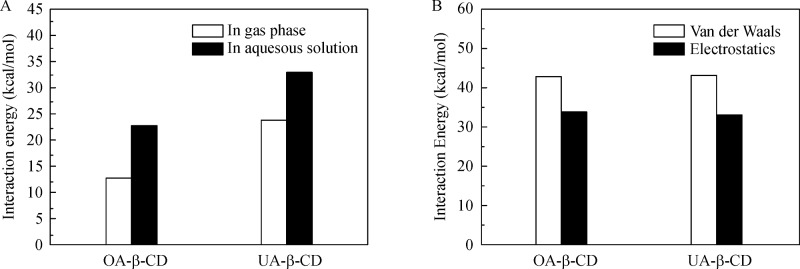
The energetic parameters (in atomic unit, a.u.) of β-CD, OA and UA and their complexes calculated in gas phase and aqueous solutions are summarized inSupplementary Table 2, available online. Furthermore, the interaction energies (ΔE, in unit of kcal/mol) were calculated to quantify the interaction of β-CD with OA and UA (Fig. 8A). The interaction energy of β-CD with UA was 32.95 (23.82) kcal/mol in aqueous solution (gas phase), higher than that of β-CD with OA, 12.70 (22.63) kcal/mol in aqueous solution (gas phase).
Fig.8. Van der Waals interaction between β-CD and UA or OA.
A: Total interaction energy (kcal/mol) in gas phase and aqueous solution calculated at B3LYP/6-31G (d) level. B: van der Waals and electrostatic interaction energy (kcal/mol), obtained through PCFF force field with conformation-dependent NBO charges, of β-CD with OA and UA.
To understand the complexation mechanism, the hydrogen bonding parameters were investigated. As shown in Fig. 7, there were two intermolecular hydrogen bonds, including O1 – H5···O2, which was formed between H atom in the carbonyl group of OA (and UA) and O atom in β-CD, and C4 – H6···O3, which was formed between the O atom in the carbonyl group of OA (and UA) and H atom bonding to C atom in β-CD. For both O1 – H5···O2 and C4 – H6···O3, the hydrogen bonding lengths in UA-β-CD (1.83 and 2.24 Å) were shorter than those in OA-β-CD (1.86 and 2.30 Å). The hydrogen bonding angles in UA-β-CD (159.0 and 179.7°) were larger than those in OA-β-CD (155.8 and 168.3°). On the other hand, the van der Waals interaction between β-CD and UA was comparable to that between β-CD and OA (Fig. 8B), due to the small structural difference between OA and UA at the carboxyl terminal being inserted into the β-CD.
Discussion
Cyclodextrins (CDs) represent one of the most commonly complexing agents used in the pharmaceutical industry because they are inexpensive and friendly to humans as well as the capability of improving the physical, chemical and biologic properties of bioactive molecules, especially those extracted from plants[42]. In this study, the continuous variation method demonstrates that the inclusion complexation of isomeric triterpenic acids, namely UA and OA, with β-CD had 1:1 stoichiometry ratio.
1H NMR and UV studies confirm the formation of inclusion of β-CD with UA and OA in liquid state simultaneously. The chemical shift of1H NMR spectroscopy indicates that the ring E both in UA or OA molecules strongly interacted with the CD cavities and the drugs had inserted into the CD cavity. Furthermore, the changes in the UV absorption spectra also display the formation of inclusion complex between drugs with β-CD, and the K values for UA-β-CD system were slightly higher than that of OA-β-CD system, which means that UA formed a more stable inclusion complex with β-CD.
The linearity of phase-solubility profile suggested A L-type system and was characteristic of 1:1 soluble complex formation in solution. The solubility of UA and OA in presence of β-CD was increased with an increase in temperature. This resulted in an increase in the slope of solubility curve, which may be attributed to the release of water molecules bound in the β-CD cavity at higher temperatures.
In the optimized formulation, the drug loading of OA-β-CD was far above which of UA-β-CD, which probably owed to that OA was slightly soluble in water, whereas UA was almost insoluble in water. For that reason, we change the preparation medium to be ammonia water (1:10, V/V). Predictably, the drug loading were obviously increased, which was 13.41% in OA-β-CD and 14.73% in UA-β-CD.
The computational study demonstrates that the most stable structures for both OA-β-CD and UA-β-CD were to have the orientation I in which the carbonyl group was located within the CD cavity through intermolecular hydrogen bonds. The interaction energy of β-CD with UA was higher than that of β-CD with OA in aqueous solution (gas phase), which indicates that the interaction of β-CD with UA was more stable than that between β-CD and OA, which was in good correction with those observed by experimental methods. In addition, the hydrogen boning interactions between β-CD with UA were stronger than those between β-CD and OA.
In conclusion, the inclusion complexation of isomeric triterpenic acids, namely UA and OA, with β-CD has been theoretically and experimentally characterized in this study. Formation of OA-β-CD and UA-β-CD inclusion complexes in liquid state has been confirmed using UV and1HNMR, and the binding constant (K) value is calculated using BH equation. The inclusion ratio of drug and β-CD is established as 1:1 (mol/mol) by phase solubility study and the negative free energy changes indicate that the two inclusion complexation processes are spontaneous. Moreover, DSC and XRD analysis of solid complex supports the formation of host-guest inclusion complex between β-CD with OA and UA. The energetically favorable complex obtained by molecular docking study agrees with the mode of inclusion process predicted through experimental observations.
Acknowledgments
This work was supported by grants from the National Natural Science Foundation of China (21303086), the Natural Science Foundation of Jiangsu Province (BK20130884), and the Research Fund for Doctoral Program of Higher Education (20123234120012). We thank the High Performance Computing Center at Shanghai.
Contributor Information
Rui Li, Email: ruili@njmu.edu.cn.
Nan Jiang, Email: jiangnan@njmu.edu.cn.
References
- 1. Gao D, Li Q, Li Y, et al. Antidiabetic potential of oleanolic acid from Ligustrum lucidum Ait[J].Can J Physiol Pharmacol, 2007, 85(11): 1076–1083. 10.1139/Y07-098 [DOI] [PubMed] [Google Scholar]
- 2. Price KR, Johnson IT, Fenwick GR, et al. The chemistry and biological significance of saponins in foods and feedingstuffs[J].Crit Rev Food Sci Nutr, 1987, 26(1): 27–135. 10.1080/10408398709527461 [DOI] [PubMed] [Google Scholar]
- 3. Mahato SB, Sarkar SK, Poddar G. Triterpenoid saponins[J].Phytochemistry, 1 988, 27(10): 3037–3067. 10.1016/0031-9422(88)80001-3 [DOI] [PubMed] [Google Scholar]
- 4. Dinkova-Kostova AT, Liby KT, Stephenson KK, et al. Extremely potent triterpenoid inducers of the phase 2 response: correlations of protection against oxidant and inflammatory stress[J].Proc Natl Acad Sci USA, 2005, 102(12): 4584–4589. 10.1073/pnas.0500815102 [DOI] [PMC free article] [PubMed] [Google Scholar]
- 5. Savic IM, Nikolic VD, Savic-Gajic I, et al. Investigation of properties and structural characterization of the quercetin inclusion complex with (2-hydroxypropyl)-β-cyclodextrin[J].J Incl Phenom Macrocycl Chem, 2015, 82(3–4): 383–394. 10.1007/s10847-015-0500-4 [DOI] [Google Scholar]
- 6. Szejtli J. Introduction and general overview of cyclodextrin chemistry[J].Chem Rev, 1998, 98(5): 1743–1754. 10.1021/cr970022c [DOI] [PubMed] [Google Scholar]
- 7. Grünstein D, Maglinao M, Kikkeri R, et al. Hexameric supramolecular scaffold orients carbohydrates to sense bacteria[J].J Am Chem Soc, 2011, 133(35): 13957–13966. 10.1021/ja2036767 [DOI] [PubMed] [Google Scholar]
- 8. Xue M, Zhong X, Shaposhnik Z, et al. pH-Operated mechanized porous silicon nanoparticles[J].J Am Chem Soc, 2011, 133(23): 8798–8801. 10.1021/ja201252e [DOI] [PMC free article] [PubMed] [Google Scholar]
- 9. Wenz G, Han BH, Müller A. Cyclodextrin rotaxanes and polyrotaxanes[J].Chem Rev, 2006, 106(3): 782–817. 10.1021/cr970027+ [DOI] [PubMed] [Google Scholar]
- 10. Liu Y, Zhao YL, Zhang HY, et al. Polymeric rotaxane constructed from the inclusion complex of beta-cyclodextrin and 4,4′-dipyridine by coordination with nickel(II) ions[J].Angew Chem Int Ed Engl, 2003, 42(28): 3260–3263. 10.1002/anie.200351128 [DOI] [PubMed] [Google Scholar]
- 11. Liu L, Guo QX. The driving forces in the inclusion complexation of cyclodextrins[J].J Incl Phenom Macrocycl Chem, 2002, 42(1): 1–14. 10.1023/A:1014520830813 [DOI] [Google Scholar]
- 12. Venkatesh G, Sivasankar T, Karthick M, et al. Inclusion complexes of sulphanilamide drugs and β-cyclodextrin: a theoretical approach[J].J Incl Phenom Macrocycl Chem, 2012, 77(1–4): 309–318. [Google Scholar]
- 13. Rajendiran N, Mohandoss T, Venkatesh G. Investigation of inclusion complexes of sulfamerazine with α- and β-cyclodextrins: an experimental and theoretical study[J].Spectrochim Acta A Mol Biomol Spectrosc, 2014, 124: 441–450. 10.1016/j.saa.2014.01.057 [DOI] [PubMed] [Google Scholar]
- 14. Benesi HA, Hildebrand JH. A Spectrophotometric investigation of the interaction of iodine with aromatic hydrocarbons[J].J Am Chem Soc, 1949, 71(8): 2703–2707. 10.1021/ja01176a030 [DOI] [Google Scholar]
- 15. Quan P, Liu DF, Li R, et al. The effects of water-soluble polymers on hydroxypropyl-β-cyclodextrin solubilization of oleanolic acid and ursolic acid[J].J Incl Phenom Macrocycl Chem, 2009, 63(1): 181–188. 10.1007/s10847-008-9505-6 [DOI] [Google Scholar]
- 16. Claude B, Morin P, Lafosse M, et al. Evaluation of apparent formation constants of pentacyclic triterpene acids complexes with derivatized β- and γ-cyclodextrins by reversed phase liquid chromatography[J].J Chromatogr A, 2004, 1049(1): 37–42. 10.1016/S0021-9673(04)01143-4 [DOI] [PubMed] [Google Scholar]
- 17. Fan JP, Zhang RF, Zhang XH, et al. Separation of three triterpene acids in leaves of Diospyros kaki by high perfoamance liquid chromatography using hydroxypropli-β-cyclodexrin as mobile phase modifier[J].J Liq Chromatogr Relat Technol, 2011, 34(14): 1340–1355. 10.1080/10826076.2011.570841 [DOI] [Google Scholar]
- 18. Higuchi T, Connors K. Phase-solubility techniques[J].Adv Anal Chem Instrum, 1965, 4: 117–212. [Google Scholar]
- 19. Barone V, Cossi M. Quantum calculation of molecular energies and energy gradients in solution by a conductor solvent model[J].J Phys Chem A, 1998, 102(11): 1995–2001. 10.1021/jp9716997 [DOI] [Google Scholar]
- 20. Cossi M, Rega N, Scalmani G, et al. Energies, structures, and electronic properties of molecules in solution with the C-PCM solvation model[J].J Comput Chem, 2003, 24(6): 669–681. 10.1002/jcc.10189 [DOI] [PubMed] [Google Scholar]
- 21. Vilseck JZ, Kostal J, Tirado-Rives J, et al. Application of a BOSS-Gaussian interface for QM/MM simulations of Henry and methyl transfer reactions[J]. J Comput Chem, 2015, 36(27): 2064–2074. [DOI] [PMC free article] [PubMed] [Google Scholar]
- 22. Marder SR, Perry JJW, Tiemann BG, et al. Direct observation of reduced bond length alternation in donor/acceptor polyenes[J].J Am Chem Soc, 1993, 115(6): 2524–2526. 10.1021/ja00059a067 [DOI] [Google Scholar]
- 23. Sun H. Ab initio calculations and force field development for computer simulation of polysilanes[J].Macromolecules, 1995, 36(3): 701–712. 10.1021/ma00107a006 [DOI] [Google Scholar]
- 24. Sun H, Mumby SJ, Maple JR, et al. Ab initio calculations on small molecule analogues of polycarbonates[J].J Phys Chem, 1995, 99(16): 5873–5882. 10.1021/j100016a022 [DOI] [Google Scholar]
- 25. Hwang MJ, Stockfisch TP, Hagler AT. Derivation of class I1 force fields. 2. Derivation and characterization of a class I1 force field, CFF93, for the alkyl functional group and alkane molecules[J].J Am Chem Soc, 1994, 116(6): 2515–2525. 10.1021/ja00085a036 [DOI] [Google Scholar]
- 26. Jiang N, Ma J. Can a proton be encapsulated in tetraamido/diamino quaternized macrocycles in aqueous solution and electric field[J]? A European Journal of Chemical Physics and Physical Chemistry, 2011, 12(13):2453–2460. [DOI] [PubMed] [Google Scholar]
- 27. Jiang N, Ma J. Conformational simulations of aqueous solvated alpha-conotoxin GI and its single disulfide analogues using a polarizable force field model[J].J Phys Chem A, 2008, 112(40): 9854–9867. 10.1021/jp8029693 [DOI] [PubMed] [Google Scholar]
- 28. Jiang N, Ma J. Influence of disulfide connectivity, electrostatics, and hydrophobicity on the conformational variations of alpha-conotoxin GI single-disulfide analogues: simulations with polarizable force field[J].J Phys Chem B, 2010, 114(34): 11241–11250. 10.1021/jp102844h [DOI] [PubMed] [Google Scholar]
- 29. Foster JP, Weinhold F. Natural hybrid orbitals[J].J Am Chem Soc, 1980, 102(24): 7211–7218. 10.1021/ja00544a007 [DOI] [Google Scholar]
- 30. Vogt FG, Strohmeier M. 2D solid-state NMR analysis of inclusion in drug-cyclodextrin complexes[J].Mol Pharm, 2012, 9(11): 3357–3374. 10.1021/mp300416w [DOI] [PubMed] [Google Scholar]
- 31. Bani-Yaseen AD, Mo’ala A. Spectral, thermal, and molecular modeling studies on the encapsulation of selected sulfonamide drugs in β-cyclodextrin nano-cavity[J].Spectrochim Acta A Mol Biomol Spectrosc, 2014, 131: 424–431. 10.1016/j.saa.2014.04.136 [DOI] [PubMed] [Google Scholar]
- 32. Junquera E, Aicart E. Thermodynamic analysis of the binding of a hepatoprotectant drug, thioctic acid, by beta-cyclodextrin[J].J Pharm Sci, 1999, 88(6): 626–631. 10.1021/js980458n [DOI] [PubMed] [Google Scholar]
- 33. Jadhav GS, Vavia PR. Physicochemical, in silico and in vivo evaluation of a danazol-beta-cyclodextrin complex[J].Int J Pharm, 2008, 352(1-2): 5–16. 10.1016/j.ijpharm.2007.10.005 [DOI] [PubMed] [Google Scholar]
- 34. Bernad Bernad MJ, Gracia-mora J, Diaz D, et al. Molecular interactions and thermodynamic aspects of the complexation reaction between gentian violet and several cyclodextrins[J].J Incl Phenom Macrocycl Chem, 1999, 34(1): 1–18. 10.1023/A:1008060400874 [DOI] [Google Scholar]
- 35. Hoshino T, Uekama K, Pitha J. Increase in temperature enhances solubility of drugs in aqueous solutions of hydroxypropylcyclodextrins[J].Int J Pharm, 1993, 98(1–3): 239–242. 10.1016/0378-5173(93)90063-L [DOI] [Google Scholar]
- 36. Loukas YL, Vraka V, Gregoriadis G. Novel non-acidic formulations of haloperidol complexed with β-cyclodextrin derivatives[J].J Pharm Biomed Anal, 1997, 16(2): 263–268. 10.1016/S0731-7085(97)00029-0 [DOI] [PubMed] [Google Scholar]
- 37. Wiedman TS. Remington’s pharmaceutical sciences[M]. Mack Publishing Company, 18th edition, Pennsylvania, 1990: 197–206. [Google Scholar]
- 38. Zarzycki PK, Lamparczyk H. The equilibrium constant of β-cyclodextrin-phenolphtalein complex; influence of temperature and tetrahydrofuran addition[J].J Pharm Biomed Anal, 1998, 18(1-2): 165–170. 10.1016/S0731-7085(98)00150-2 [DOI] [PubMed] [Google Scholar]
- 39. Yousaf AM, Kim DW, Cho KH, et al. Effect of the preparation method on crystallinity, particle size, aqueous solubility and dissolution of different samples of the poorly water-soluble fenofibrate with HP-b-CD[J].J Incl Phenom Macrocycl Chem, 2015, 81(3): 347–356. 10.1007/s10847-014-0461-z [DOI] [Google Scholar]
- 40. Prabu S, Sivakumar K, Swaminathan M, et al. Preparation and characterization of host-guest system between inosine and β-cyclodextrin through inclusion mode[J].Spectrochim Acta A Mol Biomol Spectrosc, 2015, 147(2): 151–157. 10.1016/j.saa.2015.03.056 [DOI] [PubMed] [Google Scholar]
- 41. Rajendiran N, Mohandoss T, Saravanan J. Guest:host interactions of lidocaine and prilocaine with natural cyclodextrins: spectral and molecular modeling studies[J].Spectrochim Acta A Mol Biomol Spectrosc, 2014, 132: 387–396. [DOI] [PubMed] [Google Scholar]
- 42. Pinho E, Grootveld M, Soares G, et al. Cyclodextrins as encapsulation agents for plant bioactive compounds[J].Carbohydr Polym, 2014, 101: 121–135. [DOI] [PubMed] [Google Scholar]


