Abstract
Phase-change contrast agents in the form of nanoscale droplets can be activated into microbubbles by ultrasound, extending the contrast beyond the vasculature. This article describes simultaneous optical and acoustical measurements for quantifying the ultrasound activation of phase-change contrast agents over a range of concentrations. In experiments, decafluorobutane-based nanodroplets of different dilutions were sonicated with a high-pressure activation pulse and two low-pressure interrogation pulses immediately before and after the activation pulse. The differences between the pre- and post-interrogation signals were calculated to quantify the acoustic power scattered by the microbubbles activated over a range of droplet concentrations. Optical observation occurred simultaneously with the acoustic measurement, and the pre- and post-microscopy images were processed to generate an independent quantitative indicator of the activated microbubble concentration. Both optical and acoustic measurements revealed linear relationships to the droplet concentration at a low concentration range <108/mL when measured at body temperature. Further increases in droplet concentration resulted in saturation of the acoustic interrogation signal. Compared with body temperature, room temperature was found to produce much fewer and larger bubbles after ultrasound droplet activation.
Keywords: Perfluorocarbon droplet, Acoustic droplet vaporization, Quantification, Phase change, Microbubble, Contrast agent, Temperature, Concentration
INTRODUCTION
The use of microbubbles as a contrast agent for medical ultrasound has enabled a range of applications in medicine (Cosgrove 2006). The routinely adopted diagnostic applications include using microbubbles as a blood pool marker for endocardial border delineation (Elhendy et al. 2004; Kaufmann et al. 2007) and liver vasculature imaging (Cosgrove 2007; Oldenburg et al. 2005; Vilana et al. 2006). Many other diagnostic applications also look promising, such as contrast-enhanced ultrasound imaging of the spleen (Harvey et al. 2005) and kidney (Cosgrove and Chan 2008; Quaia et al. 2003), as well as detection of neovascularization and atherosclerotic plaques (Coli et al. 2008; Feinstein 2006) in the coronary and carotid arteries. Recent studies also promoted the use of microbubbles for quantitative (Sboros and Tang 2010; Tang et al. 2011; Wei et al. 1998), targeted and molecular imaging (Klibanov 2007). In addition to the aforementioned diagnostic applications, microbubbles are also considered for use as gene and drug delivery vehicles (Lentacker et al. 2006; Unger et al. 1998) and thermal ablation enhancers (Coussios et al. 2007; Stride and Coussios 2010) for ultrasound therapy.
Limitations of microbubble-mediated ultrasound techniques include the rapid dispersion and clearance of microbubbles in vivo and the incapability of interrogating or delivering drugs within the interstitial space of solid tumors because of the enhanced permeability and retention effect (Hobbs et al. 1998). To extend their use in the extra-vascular space, there have been studies on phase-change contrast agents (PCCAs) since 1995 (Albrecht et al. 1996; Forsberg et al. 1995). The concept underlying PCCAs is the vaporization of nanoscale droplets into microbubbles by ultrasound (termed acoustic droplet vaporization) after their permeation through blood vessels, for example, into the interstitial space of tumors. During the past two decades, there have been many studies on the application of nanodroplets in vascular imaging (Correas et al. 2001; Kasprzak and Ten Cate 1998), molecular recognition for cancer detection (Lin and Pitt 2013; Sheeran et al. 2013b), drug delivery (Rapoport 2012; Rapoport et al. 2011) and enhanced tumor ablation (Zhang and Porter 2010; Zhang et al. 2011). In addition, droplets have been found to have unique applications, which microbubbles may not, in ultrasound aberration correction (Haworth et al. 2008), vascular occlusion (Samuel et al. 2012; Zhang et al. 2010) and contrast-enhanced photo-acoustic imaging (Strohm et al. 2012; Wilson et al. 2012).
In 2011, a new decafluorobutane-based PCCA was developed that has been found to be not only more uniform and smaller (peak size: 200–300 nm), but also stable. It was also found to be sufficiently labile to vaporization by a clinical ultrasound pulse at body temperature (Sheeran et al. 2011). High-speed microscopic images illustrated that once the droplets were vaporized, the particle usually expanded approximately five times in diameter, with the exception of some large outliers that resulted from bubble fusion, a secondary effect of the ultrasound vaporization pulse, and/or a secondary effect of the pressurization procedure in droplet preparation (Lin and Pitt 2013; Sheeran et al. 2011, 2013a). The same studies also indicated that, with a stronger ultrasound activation pulse, the microbubbles produced tended to shift to a smaller-sized population, and although the ultrasound pressure needed for droplet activation increased with ultrasound frequency, the mechanical index, which is more relevant to clinical implementation, decreased with ultrasound frequency (Sheeran et al. 2011, 2013a).
Some fundamental research on acoustic characterization of the ultrasound activation of droplets has been reported. For example, the degree of inertial cavitation during acoustic droplet vaporization was previously studied (Fabiilli et al. 2009; Giesecke and Hynynen 2003). Evidence from cavitation detection suggested that the phase transition usually occurred before the existence of inertial cavitation. The acoustic signature of the acoustic droplet vaporization was reported in Sheeran et al. (2014). The acoustic signal produced by single-droplet vaporization was found to be distinct from the typical microbubble and tissue scattered echo signal. Results also indicated that monitoring growth of the newly generated microbubbles may allow differentiation of converted droplets from the surrounding stable microbubbles by tracing the change in scattered sound power at fundamental and harmonic frequencies (Reznik et al. 2011). Furthermore, uniform activation of nanodroplets was achieved in vivo, and a 16- to 20-dB increase in contrast was characterized by comparing the linear intensity of two ultrasound images pre- and post-droplet activation in a rat kidney (Puett et al. 2014). Although the relationship between microbubble concentration and scattered acoustic power was described previously (Lampaskis and Averkiou 2010), the relationship between droplet concentration and bubble concentration after vaporization has not been studied previously and needs to be investigated because of the additional complexity and uncertainty of the droplet–bubble conversion. In this study, we establish the relationships between droplet concentration and simultaneous optical and acoustic measurements acquired pre- and post-droplet activation on laboratory phantoms.
METHODS
Droplet preparation
Phase-change contrast agents were produced using the “microbubble condensation” method described by Sheeran et al. (2011). Briefly, lipid-coated, decafluorobutane-filled microbubbles were first produced in 2-mL sealed vials according to the formulation and procedure described (Sheeran et al. 2011). Microbubbles (gaseous state) were condensed to nanodroplets (liquid core) by gently swirling the vials in a −7°C bath while pressurizing 40 mL room air into vials through a syringe connected to a 25G needle. In Figure 1 are microscopic images of the microbubble emulsion before and after condensation at the top and bottom planes of the hemocytometer. Both samples were diluted to 1:20 and allowed to stand for 5 min before the images were acquired to allow for stratification, if it did occur. Figure 1(a, c) illustrates that before condensation, microbubbles were observed only at the top plane because of their buoyancy. Immediately after condensation, a majority of the microbubbles disappeared from the top plane (Fig. 1b). The remaining large microbubbles in Figure 1b were most likely a result of a small number of large outlier droplets that were relatively easily vaporized even without an ultrasound activation pulse. This could be due to the smaller Laplace pressures on the larger droplets. Droplets, being comprised of dense liquid decafluorobutane (1.517 g/mL), settled to the bottom of the hemocytometer (indicated by the arrows in Fig. 1d). By subtracting the microbubble concentration measured after condensation (~5 × 10⁷ bubbles/mL) from that measured before condensation (~6 × 10⁹ bubbles/mL) using the protocol described in Sennoga et al. (2010), the concentration of the droplet emulsion was estimated to be on the order of ~5.5 × 10⁹ droplets/mL. The microbubbles that remained in the droplet emulsion were not separated out in experiments as this would account for the spontaneous vaporization of droplets, which could occur in vivo.
Fig. 1.
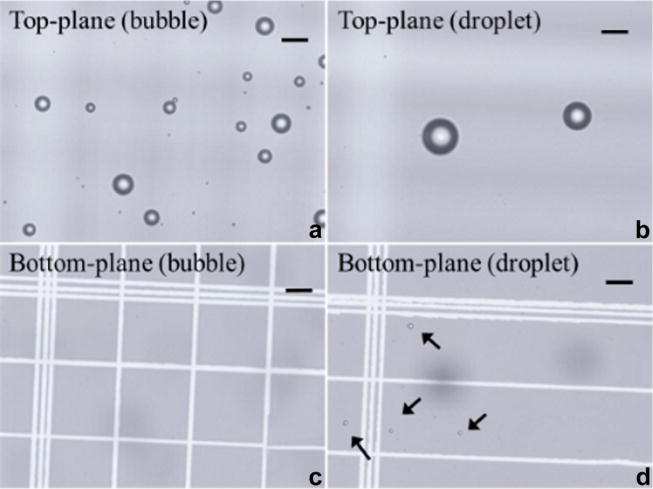
Microscopic images focused at the top and bottom planes of the cytometer containing microbubbles only (a, c) and droplets with few spontaneously activated bubbles (b, d). Bar = 20 μm.
Acoustic measurement
The experimental setup is illustrated in Figure 2. Droplets of various concentrations (1%–30%) were injected through a 200-μm-inner-diameter transparent and sonolucent microcellulose tube. The tube was then immersed in a 37°C water tank and equilibrated to achieve the physiologic temperature. A 10-MHz single-element focused ultrasound transducer (focal length = 40 mm, f-number = 2.01, Panametrics, MA, USA) transmitted a pulse train containing a high-pressure “activation pulse” to vaporize the nanodroplets and two low-pressure “interrogation pulses” before and after the activation pulse to quantify the acoustically activated droplets. The pulse train was focused at the middle plane of the microcellulose tube. The activation pulse consisted of 10 cycles at 10 MHz with a negative peak pressure of 6.0 MPa (mechanical index [MI] = 1.9). The interrogation pulses were stimulated 33.3 μs before and after the activation pulse and consisted of two cycles at 5 MHz with a negative peak pressure of 0.044 MPa (MI = 0.02). The scattered sound field of the pulse train was received by another spherically focused ultrasound transducer (focal length = 49.7 mm, f-number = 1.96, Panametrics, MA, USA) with a resonant frequency of 5 MHz. The receiving transducer, transmission transducer and microscope were angled (~120°) relative to each other to minimize reception of the activation pulse-echo that is reflected from the microscope lens and the water–air interface. For each of the received pulse-echo signals, a 2-μs rectangular window was used to temporally isolate the echo signals scattered only from the contents within the microcellulose tube. The foci of the receiving transducer (850 μm in lateral, 8.75 mm in axial) fully covers the foci of the transmitting transducer (450 μm in lateral, 6.25 mm in axial) so that the entire region through which the sound was scattered by the activated droplets could be detected. Transmission and detection were synchronized, and the acoustic signal detected was bandpass filtered (100 kHz–35 MHz) and amplified (20 dB) before acquisition. For each concentration, 10 repeat measurements were made to produce statistics, and each repeated measurement was made using a fresh set of droplets.
Fig. 2.
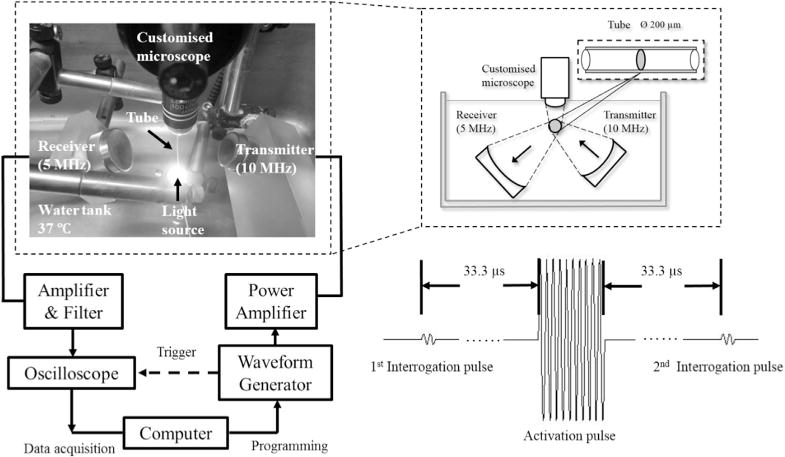
Schematic of experimental setup.
Acoustic signal processing
The power spectral densities (PSDs) of two interrogation pulse echoes were calculated and then integrated over the spectrum to characterize the scattered acoustic power. The difference between the scattered acoustic powers was used to quantify the droplets that were activated by the vaporization pulse. The mean and standard deviation of the 10 repeat measurements were calculated.
Optical observation
As a confirmation of the acoustic measurement, a water immersion objective lens (Olympus LUMPlanFl, M = 100×, NA = 1.0) focused light at the same position as the acoustic foci, through which slow motion videos (120 fps, 0.46 μm per pixel) were recorded on a home-use complementary metal oxide semiconductor (CMOS) camera (Canon IXUS 220 HS) simultaneously with the acoustic measurement to visualize acoustic droplet vaporization. Each video took about 3 s, long enough to cover the entire period of the ultrasound pulse train, including both acoustic droplet activation and acoustic interrogation.
Optical image processing
To quantify acoustic droplet vaporization, frames directly before and after droplet vaporization (Fig. 3a, b) were selected from the video and then subtracted to leave only the newly generated bubble (activated droplet) image (Fig. 3c). The generated bubbles had positive values in the gray-scale subtracted image; however, not all the pixels with positive values corresponded to the generated bubbles because of motion artifacts from the microcellulose tube secondary to water movement. To avoid motion artifacts, a threshold (intensity >0.1) was set for the normalized subtracted image to produce a binary microbubble image. Pixels with a value of one in Figure 3d were counted to estimate the cross-sectional area of the generated microbubbles. The cross-sectional area is used to approximate the concentration of the newly generated bubbles, to cross-validate the acoustic measurement. At low concentrations, it can be assumed that the scattered acoustic power is linear with the concentration of microbubbles (Lampaskis and Averkiou 2010).
Fig. 3.
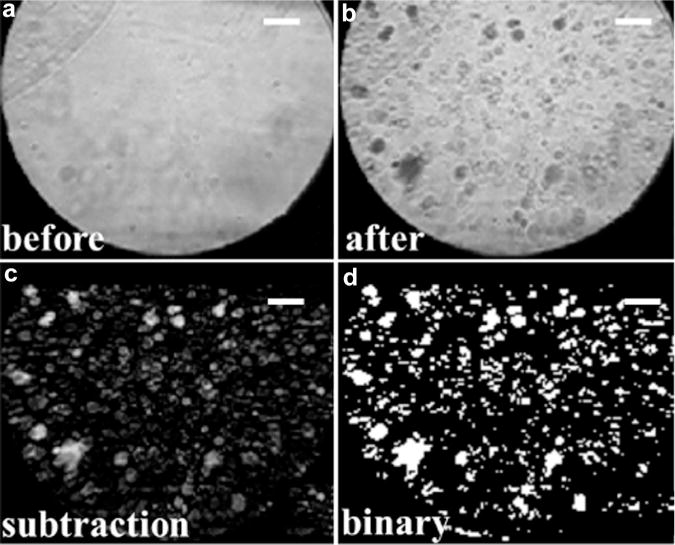
Procedure for optical quantification of acoustic droplet activation (a–d). Bar = 20 μm.
Controls
In addition to acoustic droplet activation measurement, the same arrangement described above was used except the droplet emulsion was replaced by (i) water only and (ii) microbubbles (diluted to 1:80) in the microcellulose tube as controls. The water control and water bath were purified and placed a day before use to equilibrate the gas with atmospheric pressure (Mulvana et al. 2012).
RESULTS
Optical and acoustic measurements
In Figure 4 are the optical images and corresponding acoustic interrogation echo signals acquired before and after the ultrasound “activation pulse” in water, microbubble and droplet emulsions, respectively. For water, no changes were observed both optically and acoustically. Because of the high-pressure activation pulse (6-MPa negative peak pressure at 10 MHz) some microbubbles were destroyed (Fig. 4d) and many droplets were vaporized (Fig. 4f, the black clouds), in agreement with the optical observation. For microbubbles, the amplitude of the post-activation interrogation pulse echo (after the activation pulse) was lower than that of the pre-activation interrogation pulse echo (before the activation pulse) secondary to microbubble destruction (Fig. 4i, j). For droplets, the post-interrogation pulse echo had a higher amplitude than the pre-interrogation pulse echo because of the increased scattering of sound of the newly formed microbubbles (Fig. 4k, l). All measurements indicated that the 33-μs intervals between the interrogation, activation and interrogation pulses were long enough to temporally resolve the individual pulse echo signals received by the detection transducer.
Fig. 4.
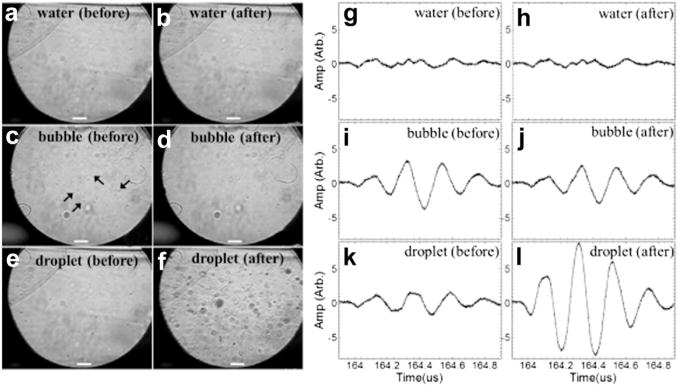
Microscopic images (a–f) and corresponding interrogation echo signals (g–l) acquired before and after the “activation pulse” in droplets and controls. Bar = 20 μm.
Figure 5 illustrates the power spectrum density of the acoustic interrogation “difference signal,” which is defined as the difference between the post- and pre-interrogation pulse echoes. The shadows indicate the standard deviation of the 10 repetitive measurements. Consistent with the results illustrated in Figure 4, the difference signal has a negative value for microbubble emulsion as a result of bubble destruction and a positive value for droplet emulsion as a result of droplet activation.
Fig. 5.
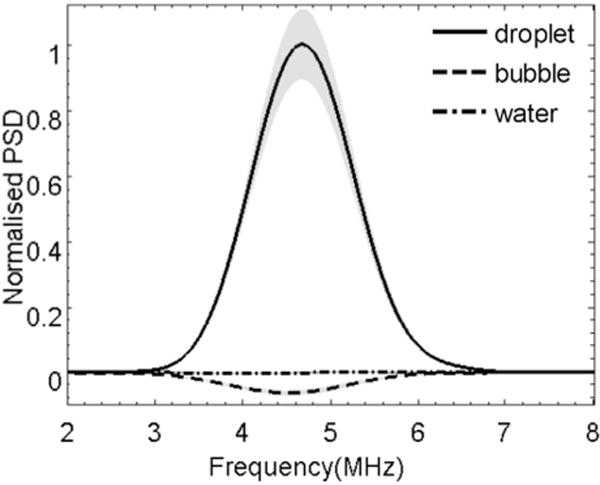
Power spectral density (PSD) of the “difference signal” detected with droplets and control.
Quantification of droplet activation
In Figure 6 are microscopic images of the various dilutions of droplet emulsions acquired immediately after launching the activation pulse and their corresponding optical measurements. The dilution was characterised by the “relative droplet concentration” (relative concentrations of 0, 1%, 1.5% and 2%are illustrated as an example in Fig. 6a–d), where ‘0’ indicates a measurement in water. The y-axis in Figure 6e represents the number of pixels (n) of activated droplets in the subtracted binary image (e.g., as illustrated in Fig. 3d), which indicates the concentration of generated bubbles and was normalized to the result of the most diluted droplets (1%) in the measurement. The results indicate that more droplets were vaporized with increasing droplet concentration, and the concentration of the generated microbubbles correlated linearly with the relative droplet concentration. The solid line represents the linear regression of the experimental data (relative concentrations 0–4%) with a R2 of 0.994, indicating good confidence in the linear relationship. The relative concentrations >4% (stars) were not included in the linear fitting.
Fig. 6.
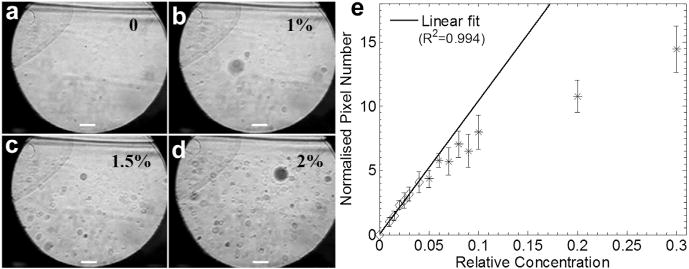
(a–d) Microscopic images of variously diluted droplet emulsions acquired after droplet vaporization. Bar = 20 μm. (e) Optical quantification as an indicator of the concentration of generated bubbles. Data at relative concentrations >0.04 (stars) were not included in the linear fitting.
Figure 7 illustrates the acoustic measurements of droplet activation. Similar to Figure 5, the PSD of the acoustic interrogation difference signal is plotted in Figure 7a for various dilutions of droplets (relative concentrations of 0–2% are illustrated as an example). The y-axis represents the acoustic scattered power normalized to the result of the most diluted droplets (1%). Figure 7a illustrates that the PSD of the difference signal increased with relative droplet concentration as a result of the elevated droplet activation and acoustic scattering. To quantify droplet activation acoustically, the power of the difference signal scattered by the newly generated bubbles was calculated by integrating the PSD over the spectrum (Fig. 7b). The power was again normalized to the 1% diluted droplet emulsion. As the inset in Figure 7b suggests, the power of the difference signal responds linearly to droplet concentrations <2%. With further increase in droplet concentration, although the optical measurement continues to increase linearly (up to 4%), the acoustic signal begins to saturate at relative droplet concentrations >2%.
Fig. 7.
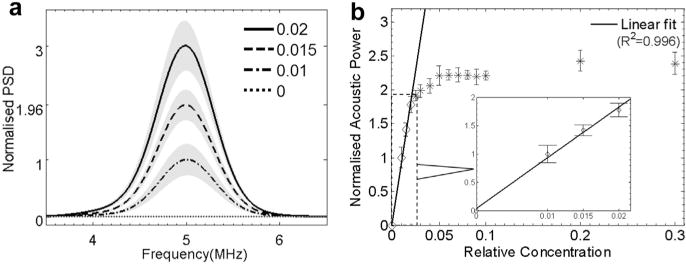
Acoustic measurement of droplet vaporization: (a) power spectral density and (b) power of the interrogation “difference signal.” Data at relative concentrations 0–2% (diamond markers) were used in the linear fitting, as illustrated in the inset in (b).
DISCUSSION
In this study, the acoustic vaporization of sequentially diluted droplets was quantified simultaneously using optical and acoustical measurements.
Optical measurements
To date most optical studies have focused on the observation of individual bubbles after droplet vaporization to determine such parameters as the size of the microbubbles generated and the threshold of droplet activation as a function of various parameters of the acoustic activation pulse (Lin and Pitt 2013; Sheeran et al. 2011, 2013a). Some studies have also looked into the droplet vaporization process, for example, observation of the over-expansion during vaporization and the sequential unforced radial oscillation after vaporization for individual perfluorocarbon microdroplets using a high-speed camera (Sheeran et al. 2014). This work looking at vaporization of individual droplets provided a useful understanding of the phase conversion process. In the present study, the optical measurements made simultaneously with acoustic measurements not only were used for cross-validation of “on/off” droplet activation as in previous studies (Sheeran et al. 2014), but also were analyzed further to generate a quantitative indicator of the volume of the generated microbubbles as a function of droplet concentration (i.e., the entire ensemble of nanodroplets). The microscopic images were acquired immediately before and after acoustic droplet activation and the pre- and post-images were subtracted and thresholded to extract the pixels corresponding to the generated microbubbles (converted droplets). Assuming the individual microbubbles are in focus and not overlapping in the optical images, the total dark pixel number n can be related to the cross-sectional area of the generated bubbles in the slice observed by microscopy. If we assume the bubble concentration in the slice is proportional to the bubble concentration in the vessel, n could be used as an indicator of the concentration of the generated microbubbles within the acoustic focus. The optical measurement indicated a linear relationship with droplet concentration for well-diluted droplets (<4%) (Fig. 6e), but linearity was not observed for the highly concentrated droplets (e.g., >4%). One possible explanation is that because of the out-of-plane effect in the microscopy images, factors such as the clustering or coalescence of the generated bubbles (most likely to occur with high concentrations) could result in underestimation of the bubble volume (e.g., for relative concentrations >4% in Fig. 6e). It should be noted that although it is assumed that the accumulated cross-sectional area (dark pixel number) can be used to estimate the concentration of the generated microbubbles, the exact relationship between this area measure and the number of bubbles is more complex, largely because the analysis is based on accumulated area measurement rather than on individual bubbles. Further studies are required.
Acoustic measurement
In the acoustic measurement, the difference between the two interrogation pulses pre- and post-vaporization was determined to quantify droplet activation. The method of comparing pre- and post-droplet activation was reported previously in Puett et al. (2014) where a customised pulse sequence similar to what was used in this work was also used to form two bubble images pre- and post-vaporization to characterize the increase in contrast increase via droplet activation. As per previously cited work (Reznik et al. 2011; Schad and Hynynen 2010), the power in fundamental and/or harmonic bands was traced for consecutive interrogation pulses after droplet activation to study the growth of the generated bubbles and the threshold of inertial cavitation. In our work, the pre- and post-interrogation echo powers were subtracted in fundamental frequency to quantify the acoustic power scattered from the newly generated microbubbles as a function of droplet concentration. We used the fundamental frequency instead of harmonics primarily because the interrogation signal at the fundamental frequency was much higher than the harmonics. Because the measurement has a natural control signal (pre-vaporization), the tissue background can be subtracted, leaving only the signal sensitive to newly generated bubbles. The acoustic quantification results indicated a linear relationship with droplet concentration for well-diluted droplets (<2%); however, with further increase in droplet concentration, the acoustic measurement saturated. The plateau in Figure 7b may be caused by the non-linearity of acoustic scattering through microbubbles. On the one hand, a greater number of generated microbubbles could deflect more sound into the focus area of the detector, potentially increasing the scattered acoustic power; on the other hand, a greater number of activated droplets could increase the attenuation of the acoustic energy and, therefore, possibly decrease the acoustic power received. The countereffect was most likely responsible for the saturation of the acoustic signal for the highly activated droplet emulsion. The acoustic measurements in this study can be expanded to imaging in diagnostic and therapeutic applications involving the use of nanodroplets. Harmonics detection (Puett et al. 2014; Reznik et al. 2011) may be added in the future to provide more information on droplet activation, for example, characterization of the size distribution of the generated microbubbles.
Temperature dependence
Previous studies have indicated a dependence on temperature for acoustic droplet activation. It has been found that the efficiency of droplet activation increases with temperature and droplet size. The same trend was observed in our optical results, as illustrated in Figure 8, where the measurements conducted at room temperature (21°C) are compared with the measurements conducted at body temperature (37°C). Figure 9 illustrates the acoustic and optical quantification measurements conducted at 21°C. The linear relationship was again observed; however, the linearity appeared to be expanded to the entire range of droplet concentrations as a result of the reduced droplet activation efficacy at 21°C. One may also note that the standard deviation in Figure 9 is much larger. A possible reason is that fewer droplets were vaporized, and most of these were large outlier droplets (Fig. 9). Figures 6e, 7b and 9 together illustrate a temperature dependence of linearity in both acoustic and optical measurements.
Fig. 8.
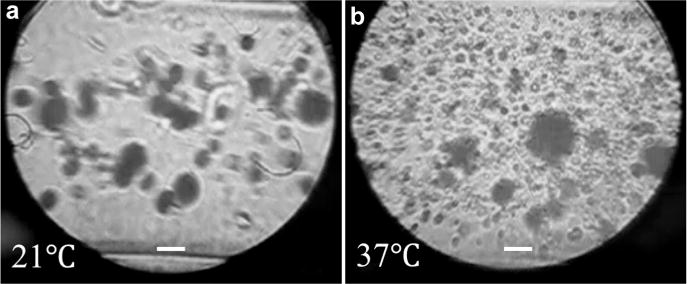
Microscopic images of the acoustically vaporized droplets at different temperatures. (a) Undiluted droplets activated at 21°C. (b) Droplets diluted to 1:3 and activated at 37°C. Bar = 20 μm.
Fig. 9.
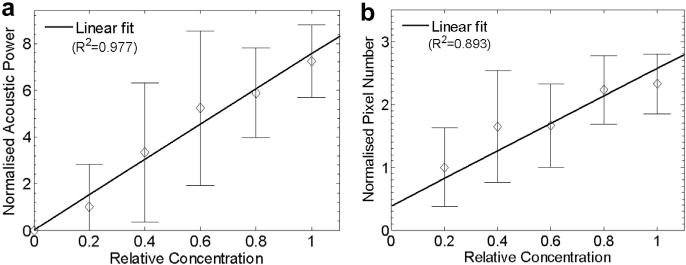
(a) Acoustic and (b) optical quantification of droplet activation at 21°C. Both measurements (50 repetitions) were normalized to the results measured using the droplets with a relative concentration of 0.2 (20%).
Concentration measurement
The effect of droplet concentration has been discussed in some previous work to some degree, for example, for determining the threshold of droplet vaporization (Reznik et al. 2011) and for evaluating the chance of successful detection of the low-frequency acoustic signatures produced by the droplet phase conversion (Sheeran et al. 2014). As an extension of current understanding, this work added new results on establishing direct quantitative links between droplet concentration, volume of generated microbubbles and acoustic power scattered from the generated bubbles. Once the experimental system is calibrated, the method may be used for the rapid and quantitative measurement of nanodroplet concentration in vitro. Considering the microbubble concentration used to generate sufficient contrast in images in clinical use (~105 bubbles/mL), the droplets used in this study (~5.5 × 10⁹ droplets/mL) may be diluted to 1% in practice, assuming 10% of the exposed droplets can be vaporized by the activation pulse (Reznik et al. 2013). It is also useful to note that as the droplet activation efficiency may be reduced in vivo (Puett et al. 2014), for example, because of the attenuation effect, the linear range described in this article may shift toward the high concentrations for in vivo applications. This will be studied in the future, as will the linear relationship for acoustic droplet activation in tissue-mimicking phantoms (Phillips et al. 2013).
CONCLUSIONS
Simultaneous acoustic and optical measurements of the pre- and post-activation of perfluorocarbon-based nanodroplets indicated a linear relationship with droplet concentrations for well-diluted droplets. The subtracted acoustic power became saturated at droplet concentrations greater than ~108 droplets/mL at body temperature. Compared with body temperature, room temperature was found to produce much fewer and larger bubbles after ultrasound droplet activation.
Acknowledgments
The authors are thankful for their fruitful discussion with Professor David O Cosgrove and for help on image processing from Yuanwei Li. Meng-Xing Tang acknowledges funding from the Engineering and Physical Sciences Research Council under Grants EP/K503733/1. Sinan Li acknowledges the studentship from the Department of Bioengineering, Imperial College London. Terry Matsunaga acknowledges the generous support of the National Cancer Institute (CA-185684).
References
- Albrecht T, Cosgrove DO, Correas JM, Rallidis L, Nihoyanopoulos P, Patel N. Renal, hepatic, and cardiac enhancement on Doppler and gray-scale sonograms obtained with EchoGen. Acad Radiol. 1996;3(Suppl 2):S198–S200. doi: 10.1016/s1076-6332(96)80533-2. [DOI] [PubMed] [Google Scholar]
- Coli S, Magnoni M, Sangiorgi G, Marrocco-Trischitta MM, Melisurgo G, Mauriello A, Spagnoli L, Chiesa R, Cianflone D, Maseri A. Contrast-enhanced ultrasound imaging of intraplaque neovascularization in carotid arteriescorrelation with histology and plaque echogenicity. J Am Coll Cardiol. 2008;52:223–230. doi: 10.1016/j.jacc.2008.02.082. [DOI] [PubMed] [Google Scholar]
- Correas JM, Meuter AR, Singlas E, Kessler DR, Worah D, Quay SC. Human pharmacokinetics of a perfluorocarbon ultrasound contrast agent evaluated with gas chromatography. Ultrasound Med Biol. 2001;27:565–570. doi: 10.1016/s0301-5629(00)00363-x. [DOI] [PubMed] [Google Scholar]
- Cosgrove D. Ultrasound contrast agents: An overview. Eur J Radiol. 2006;60:324–330. doi: 10.1016/j.ejrad.2006.06.022. [DOI] [PubMed] [Google Scholar]
- Cosgrove DO. A revolution in liver ultrasound. Eur J Gastroenterol Hepatol. 2007;19:1–2. doi: 10.1097/MEG.0b013e328011ff30. [DOI] [PubMed] [Google Scholar]
- Cosgrove DO, Chan KE. Renal transplants: What ultrasound can and cannot do. Ultrasound Q. 2008;24:77–87. doi: 10.1097/RUQ.0b013e31817c5e46. [DOI] [PubMed] [Google Scholar]
- Coussios CC, Farny CH, Ter Haar G, Roy RA. Role of acoustic cavitation in the delivery and monitoring of cancer treatment by high-intensity focused ultrasound (HIFU) Int J Hyperthermia. 2007;23:105–120. doi: 10.1080/02656730701194131. [DOI] [PubMed] [Google Scholar]
- Elhendy A, O’Leary EL, Xie F, McGrain AC, Anderson JR, Porter TR. Comparative accuracy of real-time myocardial contrast perfusion imaging and wall motion analysis during dobutamine stress echocardiography for the diagnosis of coronary artery disease. J Am Coll Cardiol. 2004;44:2185–2191. doi: 10.1016/j.jacc.2004.08.059. [DOI] [PubMed] [Google Scholar]
- Fabiilli ML, Haworth KJ, Fakhri NH, Kripfgans OD, Carson PL, Fowlkes JB. The role of inertial cavitation in acoustic droplet vaporization. IEEE Trans Ultrason Ferroelectr Freq Control. 2009;56:1006–1017. doi: 10.1109/TUFFC.2009.1132. [DOI] [PMC free article] [PubMed] [Google Scholar]
- Feinstein SB. Contrast ultrasound imaging of the carotid artery vasa vasorum and atherosclerotic plaque neovascularization. J Am Coll Cardiol. 2006;48:236–243. doi: 10.1016/j.jacc.2006.02.068. [DOI] [PubMed] [Google Scholar]
- Forsberg F, Liu JB, Merton DA, Rawool NM, Goldberg BB. Parenchymal enhancement and tumor visualization using a new sonographic contrast agent. J Ultrasound Med. 1995;14:949–957. doi: 10.7863/jum.1995.14.12.949. [DOI] [PubMed] [Google Scholar]
- Giesecke T, Hynynen K. Ultrasound-mediated cavitation thresholds of liquid perfluorocarbon droplets in vitro. Ultrasound Med Biol. 2003;29:1359–1365. doi: 10.1016/s0301-5629(03)00980-3. [DOI] [PubMed] [Google Scholar]
- Harvey C, Lim AP, Lynch M, Blomley MK, Cosgrove D. Applications of ultrasound microbubbles in the spleen. In: Quaia E, editor. Contrast media in ultrasonography. Berlin/Heidelberg: Springer; 2005. pp. 205–219. [Google Scholar]
- Haworth KJ, Fowlkes JB, Carson PL, Kripfgans OD. Toward aberration correction of transcranial ultrasound using acoustic droplet vaporization. Ultrasound Med Biol. 2008;34:435–445. doi: 10.1016/j.ultrasmedbio.2007.08.004. [DOI] [PMC free article] [PubMed] [Google Scholar]
- Hobbs SK, Monsky WL, Yuan F, Roberts WG, Griffith L, Torchilin VP, Jain RK. Regulation of transport pathways in tumor vessels: Role of tumor type and microenvironment. Proc Natl Acad Sci USA. 1998;95:4607–4612. doi: 10.1073/pnas.95.8.4607. [DOI] [PMC free article] [PubMed] [Google Scholar]
- Kasprzak JD, Ten Cate FJ. New ultrasound contrast agents for left ventricular and myocardial opacification. Herz. 1998;23:474–482. doi: 10.1007/BF03043754. [DOI] [PubMed] [Google Scholar]
- Kaufmann BA, Wei K, Lindner JR. Contrast echocardiography. Curr Problems Cardiol. 2007;32:51–96. doi: 10.1016/j.cpcardiol.2006.10.004. [DOI] [PubMed] [Google Scholar]
- Klibanov A. Ultrasound molecular imaging with targeted microbubble contrast agents. J Nucl Cardiol. 2007;14:876–884. doi: 10.1016/j.nuclcard.2007.09.008. [DOI] [PubMed] [Google Scholar]
- Lampaskis M, Averkiou M. Investigation of the relationship of nonlinear backscattered ultrasound intensity with microbubble concentration at low MI. Ultrasound Med Biol. 2010;36:306–312. doi: 10.1016/j.ultrasmedbio.2009.09.011. [DOI] [PubMed] [Google Scholar]
- Lentacker I, De Geest BG, Vandenbroucke RE, Peeters L, Demeester J, De Smedt SC, Sanders NN. Ultrasound-responsive polymer-coated microbubbles that bind and protect DNA. Langmuir. 2006;22:7273–7278. doi: 10.1021/la0603828. [DOI] [PubMed] [Google Scholar]
- Lin CY, Pitt WG. Acoustic droplet vaporization in biology and medicine. BioMed Res Int. 2013;2013:13. doi: 10.1155/2013/404361. [DOI] [PMC free article] [PubMed] [Google Scholar]
- Mulvana H, Stride E, Tang M-X, Hajnal J, Eckersley RJ. The influence of gas saturation on microbubble stability. Ultrasound Medicine Biol. 2012;38:1097–1100. doi: 10.1016/j.ultrasmedbio.2012.02.008. [DOI] [PubMed] [Google Scholar]
- Oldenburg A, Hohmann J, Foert E, Skrok J, Hoffmann CW, Frericks B, Wolf KJ, Albrecht T. Detection of hepatic metastases with low MI real time contrast enhanced sonography and SonoVue®. Ultraschall Med. 2005;26:277–284. doi: 10.1055/s-2005-858526. [DOI] [PubMed] [Google Scholar]
- Phillips LC, Puett C, Sheeran PS, Dayton PA, Wilson Miller G, Matsunaga TO. Phase-shift perfluorocarbon agents enhance high intensity focused ultrasound thermal delivery with reduced near-field heating. J Acoust Soc Am. 2013;134:1473–1482. doi: 10.1121/1.4812866. [DOI] [PMC free article] [PubMed] [Google Scholar]
- Puett C, Sheeran PS, Rojas JD, Dayton PA. Pulse sequences for uniform perfluorocarbon droplet vaporization and ultrasound imaging. Ultrasonics. 2014;54:2024–2033. doi: 10.1016/j.ultras.2014.05.013. [DOI] [PubMed] [Google Scholar]
- Quaia E, Siracusano S, Bertolotto M, Monduzzi M, Mucelli R. Characterization of renal tumours with pulse inversion harmonic imaging by intermittent high mechanical index technique: Initial results. Eur Radiol. 2003;13:1402–1412. doi: 10.1007/s00330-002-1751-1. [DOI] [PubMed] [Google Scholar]
- Rapoport N. Phase-shift, stimuli-responsive perfluorocarbon nanodroplets for drug delivery to cancer. Wiley Interdiscip Rev Nanomed Nanobiotechnol. 2012;4:492–510. doi: 10.1002/wnan.1176. [DOI] [PMC free article] [PubMed] [Google Scholar]
- Rapoport N, Nam KH, Gupta R, Gao Z, Mohan P, Payne A, Todd N, Liu X, Kim T, Shea J, Scaife C, Parker DL, Jeong EK, Kennedy AM. Ultrasound-mediated tumor imaging and nanotherapy using drug loaded, block copolymer stabilized perfluorocarbon nanoemulsions. J Controlled Release. 2011;153:4–15. doi: 10.1016/j.jconrel.2011.01.022. [DOI] [PMC free article] [PubMed] [Google Scholar]
- Reznik N, Shpak O, Gelderblom EC, Williams R, de Jong N, Versluis M, Burns PN. The efficiency and stability of bubble formation by acoustic vaporization of submicron perfluorocarbon droplets. Ultrasonics. 2013;53:1368–1376. doi: 10.1016/j.ultras.2013.04.005. [DOI] [PubMed] [Google Scholar]
- Reznik N, Williams R, Burns PN. Investigation of vaporized submicron perfluorocarbon droplets as an ultrasound contrast agent. Ultrasound Med Biol. 2011;37:1271–1279. doi: 10.1016/j.ultrasmedbio.2011.05.001. [DOI] [PubMed] [Google Scholar]
- Samuel S, Duprey A, Fabiilli ML, Bull JL, Brian Fowlkes J. In vivo microscopy of targeted vessel occlusion employing acoustic droplet vaporization. Microcirculation. 2012;19:501–509. doi: 10.1111/j.1549-8719.2012.00176.x. [DOI] [PMC free article] [PubMed] [Google Scholar]
- Sboros V, Tang MX. The assessment of micro-vascular flow and tissue perfusion using ultrasound imaging. Proc Inst Mech Eng H. 2010;224:273–290. doi: 10.1243/09544119JEIM621. [DOI] [PubMed] [Google Scholar]
- Schad KC, Hynynen K. In vitro characterization of perfluorocarbon droplets for focused ultrasound therapy. Phys Med Biol. 2010;55:4933. doi: 10.1088/0031-9155/55/17/004. [DOI] [PubMed] [Google Scholar]
- Sennoga CA, Mahue V, Loughran J, Casey J, Seddon JM, Tang M, Eckersley RJ. On sizing and counting of microbubbles using optical microscopy. Ultrasound Med Biol. 2010;36:2093–2096. doi: 10.1016/j.ultrasmedbio.2010.09.004. [DOI] [PubMed] [Google Scholar]
- Sheeran PS, Luois S, Dayton PA, Matsunaga TO. Formulation and acoustic studies of a new phase-shift agent for diagnostic and therapeutic ultrasound. Langmuir. 2011;27:10412–10420. doi: 10.1021/la2013705. [DOI] [PMC free article] [PubMed] [Google Scholar]
- Sheeran PS, Matsunaga TO, Dayton PA. Phase-transition thresholds and vaporization phenomena for ultrasound phase-change nanoemulsions assessed via high-speed optical microscopy. Phys Med Biol. 2013a;58:4513. doi: 10.1088/0031-9155/58/13/4513. [DOI] [PMC free article] [PubMed] [Google Scholar]
- Sheeran PS, Matsunaga TO, Dayton PA. Phase change events of volatile liquid perfluorocarbon contrast agents produce unique acoustic signatures. Phys Med Biol. 2014;59:379. doi: 10.1088/0031-9155/59/2/379. [DOI] [PMC free article] [PubMed] [Google Scholar]
- Sheeran PS, Streeter JE, Mullin LB, Matsunaga TO, Dayton PA. Toward ultrasound molecular imaging with phase-change contrast Agents: An In vitro proof of principle. Ultrasound Med Biol. 2013b;39:893–902. doi: 10.1016/j.ultrasmedbio.2012.11.017. [DOI] [PMC free article] [PubMed] [Google Scholar]
- Stride EP, Coussios CC. Cavitation and contrast: The use of bubbles in ultrasound imaging and therapy. Proc Inst Mech Eng H. 2010;224:171–191. doi: 10.1243/09544119JEIM622. [DOI] [PubMed] [Google Scholar]
- Strohm EM, Gorelikov I, Matsuura N, Kolios MC. Acoustic and photo-acoustic characterization of micron-sized perfluorocarbon emulsions. J Biomed Opt. 2012;17:096016. doi: 10.1117/1.JBO.17.9.096016. [DOI] [PubMed] [Google Scholar]
- Tang MX, Mulvana H, Gauthier T, Lim AKP, Cosgrove DO, Eckersley RJ, Stride E. Quantitative contrast-enhanced ultrasound imaging: A review of sources of variability. Interface Focus. 2011;1:520–539. doi: 10.1098/rsfs.2011.0026. [DOI] [PMC free article] [PubMed] [Google Scholar]
- Unger EC, McCreery TP, Sweitzer RH, Caldwell VE, Wu Y. Acoustically active lipospheres containing paclitaxel: A new therapeutic ultrasound contrast agent. Invest Radiol. 1998;33:886–892. doi: 10.1097/00004424-199812000-00007. [DOI] [PubMed] [Google Scholar]
- Vilana R, Bianchi L, Varela M, Nicolau C, Sanchez M, Ayuso C, Garc ıa M, Sala M, Llovet JM, Bruix J, Bru C. Is microbubble-enhanced ultrasonography sufficient for assessment of response to percutaneous treatment in patients with early hepatocellular carcinoma? Eur Radiol. 2006;16:2454–2462. doi: 10.1007/s00330-006-0264-8. [DOI] [PubMed] [Google Scholar]
- Wei K, Jayaweera AR, Firoozan S, Linka A, Skyba DM, Kaul S. Quantification of myocardial blood flow with ultrasound-induced destruction of microbubbles administered as a constant venous infusion. Circulation. 1998;97:473–483. doi: 10.1161/01.cir.97.5.473. [DOI] [PubMed] [Google Scholar]
- Wilson K, Homan K, Emelianov S. Biomedical photoacoustics beyond thermal expansion using triggered nanodroplet vaporization for contrast-enhanced imaging. Nat Commun. 2012;3:618. doi: 10.1038/ncomms1627. [DOI] [PubMed] [Google Scholar]
- Zhang M, Fabiilli ML, Haworth KJ, Fowlkes JB, Kripfgans OD, Roberts WW, Ives KA, Carson PL. Initial investigation of acoustic droplet vaporization for occlusion in canine kidney. Ultrasound Med Biol. 2010;36:1691–1703. doi: 10.1016/j.ultrasmedbio.2010.06.020. [DOI] [PMC free article] [PubMed] [Google Scholar]
- Zhang M, Fabiilli ML, Haworth KJ, Padilla F, Swanson SD, Kripfgans OD, Carson PL, Fowlkes JB. Acoustic droplet vaporization for enhancement of thermal ablation by high intensity focused ultrasound. Acad Radiol. 2011;18:1123–1132. doi: 10.1016/j.acra.2011.04.012. [DOI] [PMC free article] [PubMed] [Google Scholar]
- Zhang P, Porter T. An in vitro Study of a phase-shift nanoemulsion: A potential nucleation agent for bubble-enhanced HIFU tumor ablation. Ultrasound Med Biol. 2010;36:1856–1866. doi: 10.1016/j.ultrasmedbio.2010.07.001. [DOI] [PubMed] [Google Scholar]


