

Abstract
Coherence between electromyographic (EMG) signals has been used to identify correlated neural inputs to motor units (MUs) innervating different muscles. Simulations using a motor-unit model (Fuglevand et al. 1992) were performed to determine the ability of coherence between two multi-unit EMGs (mEMG) to detect correlated MU activity and the range of correlation strengths in which mEMG coherence can be usefully employed. Coherence between motor-unit and mEMG activities in two muscles was determined as we varied the strength of a 30-Hz periodic common input, the number of correlated MU pairs and variability of MU discharge relative to the common input. Pooled and mEMG coherence amplitudes positively and negatively accelerated, respectively, toward the strongest and most widespread correlating inputs. Furthermore, the relation between pooled and mEMG coherence was also nonlinear and was essentially the same whether correlation strength varied by changing common input strength or its distribution. However, the most important finding is that while the mEMG coherence saturates at the strongest common input strengths, this occurs at common input strengths greater than found in most physiological studies. Thus, we conclude that mEMG coherence would be a useful measure in many experimental conditions and our simulation results suggest further guidelines for using and interpreting coherence between mEMG signals.
Keywords: Motor units, EMG, Coherence, Muscle, Common input
Introduction
Electromyography (EMG) has been widely used by neurophysiologists to infer how the central nervous system controls muscle activity during motor behaviors. A number of studies have recorded EMG from multiple muscles and used coherence analysis, i.e., correlation analysis in the frequency domain, to understand their coordination (Farmer et al. 2007; Hansen et al. 2002; Johnston et al. 2005; Kilner et al. 1999; Winges et al. 2006). The main objective of these studies is to assess the extent and behavioral relevance of periodic common input to motor neurons across muscles. However, these studies often differ with respect to the recording technique and type of EMG signal analyzed, i.e., single motor unit (MU) or multi-unit (e.g., interference) EMG, which may influence their results and interpretation.
Each type of EMG recording has advantages and disadvantages. The use of single MU recording is preferable when considering its higher signal-to-noise ratio and temporal resolution relative to those associated with multi-unit recordings. However, recording the activity of single MUs often requires a large number of experimental sessions to obtain a sufficiently large number of MUs (Johnston et al. 2005; McIsaac and Fuglevand 2008; Semmler et al. 2003, 2004; Winges et al. 2006, 2008; Winges and Santello 2004). This results in considerable time and subject involvement, and the interpretation of such data relies on the assumption that the main features of the neural drive are invariant across sessions. Furthermore, stable recordings are easier to obtain using tasks involving low force amplitudes to facilitate reliable discrimination of motor-unit action potentials (MUAPs). Thus, considerable laboratory constraints are often imposed, e.g., requiring subjects to maintain a constant MU discharge rate and/or force amplitude under visual or auditory feedback. Lastly, single-unit recording often requires invasive procedures, e.g., indwelling needle or wire electrodes.
Multi-unit EMG (mEMG) recordings can be performed through use of non-invasive surface electrodes. Each mEMG signal describes the simultaneous activity of multiple, concurrently active MUs, providing information concerning the global activity of the muscle without requiring a large number of recording sessions. Furthermore, task dependency of muscle activity can be more easily addressed through mEMGs as there is no need to maintain the recording of the same MU across different tasks to enable the discrimination of single units. However, mEMG signals, especially when recorded by surface electrodes, are subject to the effects of various physiological factors such as the conduction velocity of the muscle fibers (Day and Hulliger 2001; Keenan et al. 2006) as well as the summation and cancellation of individual MU potentials (Keenan et al. 2005). These effects may obscure the contribution of individual units and limit the extent to which inferences about neural mechanisms (e.g., correlated neural activity of MUs within and/or across muscles) can be made from mEMGs. Yet, simulations and theoretical analysis by Christakos (1994, 1997) revealed that coherence between individual units and summed activity (unit-to-aggregate coherence) can be used to estimate the incidence and strength of unit-to-unit correlations within a population. Christakos also showed that the coherence between the summed activity of two populations (aggregate-to-aggregate coherence) provides a very sensitive measure of the presence of unit-to-unit correlations within them, with the caveat that the sensitivity of this measure of correlation can saturate and the extent and strength of unit-to-unit coherence potentially be overestimated.
In view of the potential advantages and limitations of aggregate-to-aggregate coherence, we conducted simulations to determine the dependence of the coherence between the mEMGs of two motor-unit pools on the strength and distribution of a common periodic input to the two pools. Our goals were threefold. First, we wished to determine the ability of coherence between mEMGs to detect correlated MU activity and extend the work of Christakos by determining the range of correlation strengths in which mEMG coherence can be usefully employed. Second, as mEMG signals result from the superposition of action potential waveforms, we also examined the influence of parameters that influence action potential waveforms on mEMG coherence. Third, we wanted to determine the influence of rectification, a commonly used preprocessing technique, on mEMG coherence.
Thus, we used a motor-unit model (Fuglevand et al. 1992) to generate MUAP trains of two small populations of MUs from two muscles. The MUAP trains generated by each MU were then linearly summated to generate a mEMG signal in each muscle. The main experimental conditions used to address our first goal consisted of the following steps: (1) imposing a periodic correlating input across variable numbers of MU pairs, (2) modulating the strength of the correlating input, and (3) changing the variability of MU discharge timing in response to the input. To address our second goal, the effects of parameters that affect action potential waveform (Fuglevand et al. 1992), electrode to MU territory distance and conduction velocity, were also studied. Lastly, coherences between rectified and unrectified mEMG signals were compared to the pooled coherence (Amjad et al. 1997) computed from all pairs of MUAP trains to address our third goal. Our results showed that mEMG coherences provide sensitive measures of MU correlation through the physiological range of correlated input. Preliminary results of this study have been published as an abstract (Santello et al. 2005) and as part of a book chapter (Johnston et al. 2009).
Materials and methods
MU model and mEMG
We used a MU model developed by Fuglevand et al. (1992, 1993) to simulate the recording of MUAPs through bipolar surface electrodes. Specifically, we used (1) the size-ordered pool of motoneurons whose recruitment and discharge frequencies are determined by the level of excitation applied to the pool and (2) the MUAP model to determine the MUAP trains and corresponding mEMG from the Fuglevand model. This allowed us to generate MUAPs produced by active MUs, selecting the parameters of the EMG recording electrodes and muscle fibers (Table 1) to generate appropriate MUAP shapes and amplitudes (Fig. 1a).
Table 1.
Parameters of motor-unit model
| Sides of square EMG electrode | 2 mm |
| EMG electrode spatial resolution | 0.5 mm |
| Inter-electrode spacing | 20 mm |
| Dipole current | 388 nA |
| Dipole spacing | 1 mm |
| Radial conductivity | 0.063 S/m |
| Longitudinal conductivity | 0.33 S/m |
| End-plate—electrode distance | 40 mm |
| End-plate—fiber termination | 200 mm |
| Fiber radius | 28 μm |
| Total number of fibers per motor unit | 2,500 |
| Spatial distribution of motor-unit fibers (uniform) | 20 fibers/mm2 |
| Diameter of motor-unit territory detected by EMG | 12.6 mm |
Fig. 1.
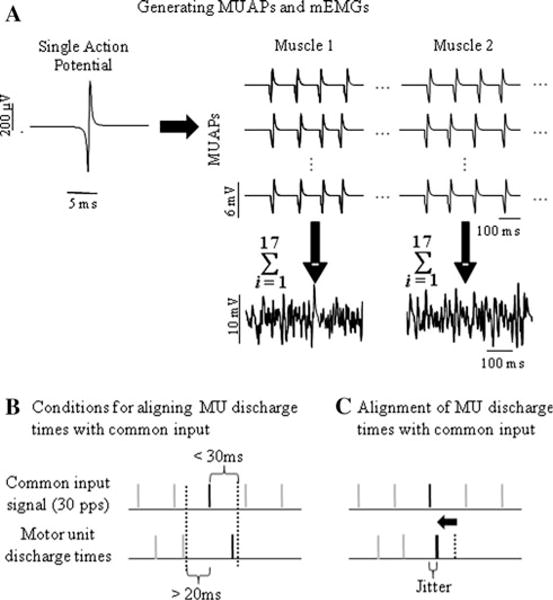
Examples of (a) single MUAP and MUAP trains from two muscles with their respective mEMGs (uncorrelated MUAP’s at a mean discharge rate of 8 Hz). b The timings of individual MUAPs of units that received common input could be reset if they fell within 30 ms following a common input spike, and the previous MUAP occurred more than 20 ms before the common input spike. c If these conditions were met, the MUAP was shifted to align with the common input spike but only if this spike is one of the fraction of spikes chosen for re-alignment. The arrow denotes an adjustment to the timing of one action potential (dashed bar) made based on the criteria shown in (b). Note that jitter is introduced when aligning the target action potential with the common input spike time
With the MU model, we created a population of 120 MUs for each motor neuron pool whose recruitment thresholds were distributed according to their twitch properties (Fuglevand et al. 1993; Santello and Fuglevand 2004). To allow for comparison with studies of single MU EMG that often use tasks involving low static forces, we chose a relatively low and constant level of excitation (i.e., simulated net excitatory input to the motor neuron) of 5% of the maximum level that would have recruited all 120 units. This led to the recruitment of 17 MUs that discharged at slightly different rates depending on their threshold relative to the level of excitation provided (see Fig. 2 in Fuglevand et al. 1993). Since the chosen excitation level was very low, the mean discharge rate for all MUs across all simulations (see below) was 8.2 pulses per second (pps) and was only slightly higher than the minimum discharge rate of 8 pps. The discharge times of each MU were first generated according to the above firing rate model. Pseudorandom fluctuations of each firing time were introduced by adding a value from a truncated normal distribution produced by a random number generator (Matlab, The MathWorks, Natick, MA). The standard deviation (SD) of this distribution was set to 25 ms, and the distribution was truncated to a width of 100 ms. This algorithm randomized the occurrence of individual firing times and provided mean interspike intervals (ISIs) across all simulations of 122 ms while preventing the occurrence of un-physiological ISIs (<~20 ms).
Fig. 2.
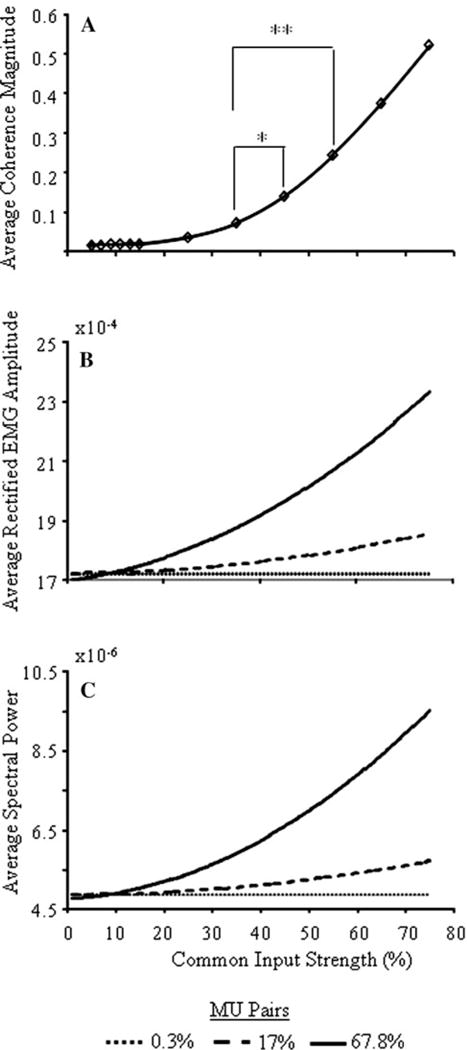
a Average unit-to-unit coherence magnitudes at the common input frequency as a function of common input strength. b and c show average rectified mEMG amplitude and spectral power (computed over all frequencies), respectively, as a function of common input strength and 0.3, 17 and 67.8% correlated MU pairs (dotted, dashed, solid lines, respectively). * and ** indicates p < 0.05 and 0.01, respectively
The above procedures were performed to simulate single MU EMG recordings from two muscles each with 17 active MUs. Multi-unit EMG recordings were generated by linear summation of all actions potentials across all 17 MUs within each muscle. Single- and multi-unit signals were sampled at a frequency of 1 kHz.
Periodic common neural input
Common synaptic input to two or more neurons is capable of producing correlated discharge in their spike trains (Binder and Powers 2001; Kirkwood and Sears 1978; Moore et al. 1970; Sears and Stagg 1976). In our simulations, we produced correlated discharge in subsets of motoneurons by providing a periodic common excitatory input to each motoneuron in the subset. The discharge rate for the motoneuron in the Fuglevand model is a function of net excitatory input. Since specific synaptic mechanisms and intrinsic membrane properties are not included in this motoneuron model (see Lowery and Erim 2005; Taylor and Enoka 2004a, b), common synaptic input was represented as an increased probability of discharge at the period of the common input. Excitatory post-synaptic potentials (EPSPs) have been shown to produce an increase in the probability of discharge in proportion to EPSP amplitude (Cope et al. 1987; Fetz and Gustafsson 1983; Kirkwood and Sears 1982), and so the strength of common input was varied by increasing the probability of discharge in each motoneuron.
The increased discharge probability for a neuron with common input occurs within a brief time window, corresponding to the rising phase of an EPSP, though this window can broaden with smaller EPSP amplitudes and in the presence of uncorrelated noise in the neuron (Cope et al. 1987; Fetz and Gustafsson 1983; Kirkwood and Sears 1982). In our model, the increased probability of motoneuron discharge following common input occupied a narrow time window consistent with these studies. Based on the assumption that EPSPs increase the probability of discharge by raising membrane potential as the interspike potential trajectory approaches threshold (Ashby and Zilm 1982; Fetz and Gustafsson 1983; Knox 1974), common input should elicit discharge during the last portion of the ISI. Consistent with this conclusion, EPSPs and short current pulses applied to rhythmically firing neurons are capable of directly eliciting spikes and shortening the ISI by more than 40%, depending on EPSP/pulse amplitude (Reyes and Fetz 1993a, b). Accordingly, common input could induce discharge over ~25% of the late part of the ISIs of the MUs in our simulations.
The strength and timing of common input relative to a motor unit’s own activity determine (a) how many action potentials across two units occur at similar times relative to the common input signal and (b) the variability in the timing of discharges around the common input frequency. The strength of correlation between two MUs, as indicated by coherence, will depend on the interaction of these two factors. While coherence can be readily determined between two spike trains, one often wishes to examine correlated MU activity across two populations of simultaneously active MUs, in which case the mEMG from each muscle is used. The coherence magnitude between two mEMG signals will be dependent on the factors (a) and (b) above, as well as on (c) how many MUs are targeted by the common neural input. Below we describe the procedures used to simulate periodic common input to two populations of MUs based on the principles just presented.
Simulations
Periodic common input was simulated by creating a reference train with firing times at the frequency of the simulated common input (30 pps; Fig. 1b). We chose to simulate a common input frequency of 30 Hz, which occurs within the range of frequencies at which MU correlation and cortical-EMG correlation occur (Baker et al. 1999; Conway et al. 1995; Farmer et al. 1993) and can be clearly distinguished from the mean MU discharge rate of 8.2 Hz in these simulations.
Next, the firing times of each MUAP generated by the above model for each motor unit receiving common input were compared to the firing times of the common input reference train. If a MU firing time occurred within 30 ms after a common input event (i.e., as the motor unit approached threshold), and the previous MU firing time occurred more than 20 ms before the same common input event (providing a refractory period), the MU firing time was shifted back to the same firing time as that of the common input event within a normally distributed SD (i.e., jitter; physiological factor b above; Fig. 1c). However, this occurred in only a fraction of the eligible MU firing times according to a uniformly distributed pseudorandom number population (i.e., according to a probability representing common input strength; physiological factor a above; Fig. 1b).
The 30-ms window in which common input could advance MU discharge was selected in consideration of the effects of synaptic input on neuron discharge cited above, and the variability that has been observed in the discharge of human MUs at low frequencies (e.g., Matthews 1996). Selected values of jitter ranged from small values consistent with short-term synchrony and typical rise times of EPSPs, to larger values that included the possibility of broader correlation peaks and synchronized presynaptic inputs (Kirkwood et al. 1982). Note that the addition of periodic common input to the MUAP trains did not alter the mean of the ISIs (122 ± 2 ms across all conditions). Lastly, specific numbers of MUs from each muscle were chosen to “receive” common input, representing different distributions of common input to the two motor-unit pools (computed as the percentage of correlated MU pairs out of the 17 × 17 = 289 possible MU pairings across muscles; physiological factor c above;).
The main objective of the present study was to quantify the relation between coherence computed between two mEMG signals and coherence pooled across the activities of single MUs as a function of physiological parameters of the periodic common neural input (i.e., jitter, common input strength and distribution) and to determine whether mEMG coherence can be usefully employed in experimental settings. A related question examined was the extent to which the characteristics of the MUAPs may affect such relation. Specifically, the shape of the waveforms of MUAPs that underlie the mEMG signal is influenced by volume conduction, which is affected by many factors including the location of the MUs relative to the surface electrodes and the muscle fiber conduction velocities. To address these issues we performed the following three simulations (Table 2).
Table 2.
Values of model parameters for each simulation
| Simulation 1 | Simulation 2 | Simulation 3 | |
|---|---|---|---|
| Common input strength (%) | 25 75 | 5 7 9 11 13 15 25 35 45 55 65 75 | 25 |
| MU pairs receiving common input (%) | 0.3 8.7 17 34.6 67.8 100 | 0.3 17 67.8 | 0.3 8.7 17 34.6 67.8 100 |
| Jitter (ms) | 0.83 1.67 2.5 3.33 | 1.67 | 0.83 1.67 2.5 3.33 |
| ETD (mm) | 9.0E-03 | 9.0E-03 | 9.0E-3 18.0E-3 |
| CV (m/s) | 4 | 4 | 4 2.5 |
Simulation #1
The goal of this simulation was to determine the extent to which jitter, common input strength and distribution affected the ability of both pooled and mEMG coherence to accurately reflect common input at the level of single MU pairs.
Simulation #2
This simulation addressed the same questions as in simulation #1; however, we kept jitter level constant and tested a larger number of common input strengths. We also applied a common preprocessing method to the two mEMG signals, i.e., rectification, to determine the extent to which this procedure changed the degree of correlation observed between the two muscles.
Simulation #3
The objective of simulation # 3 was to determine the extent to which changes in MU territory distance (ETD) and conduction velocity (CV) influence coherence computed across the two mEMG signals.
In addition to computing mEMG and pooled coherence, we determined the average unit-to-unit coherence at 30 Hz at different common input strengths in simulation #2 in order to relate the common input strengths used to those suggested by the results of prior experimental studies (e.g., Farmer et al. 1993; Kilner et al. 2002; Semmler et al. 2002). We also used simulation #2 results to determine the dependence of rectified mEMG amplitude and spectral power on common input strength and distribution for comparison with prior studies.
Each simulation consisted of 10 trials, each lasting 30 s, per condition.
Analysis
Coherence is used to determine the linear relation between two signals in the frequency domain. Its magnitude is similar to the coefficient of determination in linear statistics, as the value of coherence at a given frequency is bounded between 0 and 1, indicating no linear relationship and a perfect linear relationship, respectively, at that frequency. Coherence analysis has been used to determine the frequency of correlated rhythmic activity between two MUs and reflects the influence of a common periodic input to their motor neuron pools (Farmer et al. 1993; Johnston et al. 2005; Semmler et al. 2002).
Coherence analysis of mEMG signals
The MUs started discharging at different latencies from the onset of simulation, since each firing event resulted from a particular random number which was different for each MU in each of the two muscles. Analysis was performed on trains of MUAPs starting at the time when all MUs (n = 17) were active. The mean of each mEMG signal was subtracted from the entire 30 s trial. Coherence was then computed between the mEMG signals of each muscle using the cross-spectrum fxy and auto-spectra fxx, fyy, of each mEMG signal. These measures were estimated from 0.512 s of non-overlapping segments of data (i.e., 512 point Hanning windows), resulting in a bin resolution of 1.95 Hz. The estimate of coherence magnitude, |Rxy(λ)|2, was determined by,
| (1) |
where λ is the frequency at which coherence is calculated. The confidence limit for a zero value of the coherence estimate was computed using the test provided by Rosenberg et al. (1989),
| (2) |
where α is the confidence level (α = 0.05) and L is the number of disjoint segments (i.e., total trial duration/data segment duration). If the estimated coherence at a particular frequency exceeds the confidence limit, the hypothesis of non-correlated activity at that frequency is rejected. Using this equation, we computed the percentage of trials with coherence magnitudes significantly different from 0.
Coherence analysis of MUAP trains
The offset of each MUAP train was removed by subtracting the mean of each 0.512 s segment (i.e., equivalent to the window size used to calculate the spectrum; see above) from that segment of data. To allow for comparison with the coherence estimate obtained between the two mEMG signals, we computed pooled coherence using all MU pair combinations within each condition (e.g., jitter level, common input strength, etc.). Pooled coherence (Amjad et al. 1997) can be considered a weighted average of k individual coherence estimates, each computed from Li data segments, and is computed by:
| (3) |
Note that the calculation for pooled coherence of MU pairs is based on event trains, whereas coherence between mEMGs is computed on the composite signals resulting from superposition of action potential waveforms.
Simulation provided the opportunity to sample the entire set of active MUs and directly compare the pooled coherence of all pairs with the mEMG coherence. Although this procedure was efficient, the MU pairs used to compute pooled coherence were not statistically independent which is usually assumed when computing pooled coherence. We examined the consequences of this unconventional application of pooled coherence by performing a separate set of simulations in which the Fourier transforms of individual MUs at one frequency were represented by complex random numbers. Common input was simulated by addition of a random number to each of the numbers representing units with correlated input. Simulations were run, in which (1) the numbers for each of 289 pairs were generated independently to provide independent coherence estimates and (2) one random number was used as common input and added to each of the 289 pairs of numbers to provide coherence estimates from one active pool. Pooled coherence estimates were formed from both simulations. Computing pooled coherence from the members of one active pool resulted in an increase in the variance across estimates, although pooled coherence magnitude was not affected. For this reason, comparison of the variability across estimates of our measures will not be discussed.
Statistical analysis
One objective of this study was to assess the extent to which coherence measured between the two mEMGs can be used to infer the pattern and magnitude of correlated neural activity among individual MU pairs. We pursued this objective by performing regression analysis of the 30 Hz coherence magnitudes measured from pairs of mEMGs vs. pooled coherence computed from all MU pairs. For each of the relations described below, we fit both linear and nonlinear models to the data and determined the best fit to be the model resulting in the largest coefficient of determination (r2). In most cases, the nonlinear model resulted in the best fit; thus, our results focus on the degree to which the linear model also fit the data.
Analyses of variance (ANOVA) were performed to test the dependence of coherence magnitudes on the several factors in the simulations. Since coherence magnitudes are not normally distributed, coherence measures were normalized by computing the Fisher z-transform, i.e., before ANOVAs were performed. A one-way ANOVA was performed to determine whether unit-to-unit z-transformed coherence magnitudes significantly differed as a result of common input strength. Separate two-way ANOVAs with the factors common input strength (12 levels) and common input distribution (3 levels) were used to examine their effects on mEMG amplitude and spectral power. Additionally, three separate ANOVAs were computed for each simulation to examine the effects of the following factors on the z-transformed coherence magnitude: (Simulation #1) common input strength (2 levels), common input distribution (6 levels), Signal type (2 levels) and Jitter (4 levels); (Simulation #2) common input strength (12), common input distribution (3), and Signal type (3); and (Simulation #3) Jitter (4) and CV (2), ETD (2), and common input distribution (6). The significance level of p < 0.05 was used for all statistical analyses.
Results
The simulations revealed three main findings. First, both pooled and mEMG coherence magnitudes changed non-linearly as a function of the strength and distribution of common input. However, mEMG and pooled coherence amplitudes negatively and positively accelerated, respectively, toward the strongest and most widespread correlating inputs. Second, a nonlinear function related pooled and mEMG coherence magnitudes, such that mEMG coherence magnitudes accounted for up to 99% of the variance of pooled coherence. This relation was consistent regardless of whether the correlation varied with the strength or extent of common input. Third, rectified mEMG coherence magnitude was less sensitive than that of unrectified mEMG, as it increased more slowly with common input strength and detected fewer trials with significant coherence.
Unit-to unit coherence, mEMG power and amplitude
To compare the strengths of common input used in these simulations to levels that might be expected in experimental studies, we computed the average unit-to-unit coherence magnitudes at the common input frequency of 30 Hz (Fig. 2a) as a function of common input strength. The average unit-to-unit coherence magnitudes increased monotonically as a function of common input strength, ranging from 0.012 at 5% to 0.52 at 75% common input strength. Coherence magnitudes were negligibly small at common input strengths <25%, and z-transformed coherence amplitudes did not differ significantly in this range. Significant differences did emerge between 25 and 75% common input strength (most comparisons: p < 0.001). Coherence values from 25% (0.035) to 55% (0.24) common input strength span the range of unit-to-unit coherence magnitudes observed in most experimental studies (e.g., Farmer et al. 1993; Kilner et al. 2002; Semmler et al. 2002), thus we consider these levels of common input strength to be representative of physiological levels encountered in experimental studies.
Figure 2b and c show significant effects of both common input strength and distribution (both p < 0.001) on the average rectified mEMG amplitude and spectral power, respectively. Neither mEMG amplitude nor spectral power changed when common input strength was less than 15%, regardless of the distribution of common input. At 15% common input strength, mEMG amplitude and spectral power began to increase as common input increased with the rate of increase depending on the distribution of common input (i.e., common input distribution × strength interaction; p < 0.001). EMG power and amplitude were little affected by the lowest distribution of common input (0.3%). Relatively small numbers of correlated MU pairs (17%) were required, though, to produce detectable increases in EMG power and amplitude at common input strengths representative of physiological levels (25–55%), and these changes were pronounced when 67.8% of the MU pairs were correlated. These results are consistent with those of Yao et al. (2000), who found increases in rectified mEMG amplitude and spectral power in simulations of MU synchrony.
Figure 3 shows examples of motor-unit and mEMG autospectra as well as MU, pooled and mEMG coherence for common input strengths of 25 and 75% (with 17% correlated MU pairs and jitter at 1.67 ms). All MUs have a peak in the power spectrum at approximately 8 Hz, i.e., the discharge rate of the units. The power spectra of units receiving 25% common input strength do not have evident peaks at the common input frequency of 30 Hz, whereas, those with 75% common input strength exhibit prominent peaks at 30 Hz and its harmonics. Note that the effects of our simulated common input on the shape of the auto-spectra are expected given the sharply defined common input frequency. Significant coherence is observed at the common input frequency of 30 Hz when computed between each pair of MUs, with a fivefold increase in the coherence magnitude when increasing the common input strength from 25 to 75%. Note also that the magnitude of the pooled coherence (across all trials for these two conditions) corresponds fairly well to that computed on the individual MU pairs, particular at 75% common input strength.
Fig. 3.
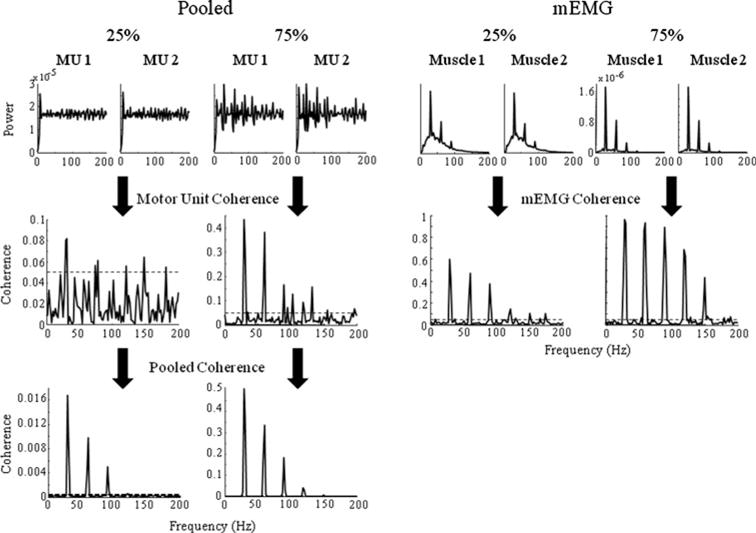
Examples of single MU and unrectified mEMG autospectra (top row, left and right panels, respectively), MU and mEMG coherence (middle row) and pooled coherence (bottom row) for common input strengths of 25 and 75% (left and right panels, respectively). Horizontal lines denote 95% confidence limits (limits for pooled coherence are 1.75e × 10−4). Note the different scales for the y-axes
Regardless of the strength of common input, the auto-spectra of the two mEMG signals show the largest power at the common input frequency as well as its harmonics. The power is greatly increased, however, when common input strength is 75%. Furthermore, the mEMG shows strong coherence in both common input strength conditions and exhibits less modulation with respect to common input strength than did the pooled coherence.
Simulation #1
Figure 4a–d show the coherence magnitudes (averaged over all trials) of both the pooled and mEMG signals as a function of jitter and distribution of common input at two common input strengths (25 and 75%). The relation between mEMG coherence magnitudes and the distribution of common input depends on the common input strength, i.e., at 25 and 75% common input strength the relations are linear (r2 = 0.99) and nonlinear (r2 = 0.94 vs. 0.74 for linear relation), respectively (Fig. 4a and b). The nonlinear relation at 75% common input strength negatively accelerates as the distribution of common input increases. Increasing jitter tends to decrease coherence magnitude, as seen with jitter levels of 3.33 ms at 25% common input strength (Fig. 4a) and in the middle range of correlated MU pairs (i.e., 8.7–34.6%) when common input strength is 75% (Fig. 4b).
Fig. 4.
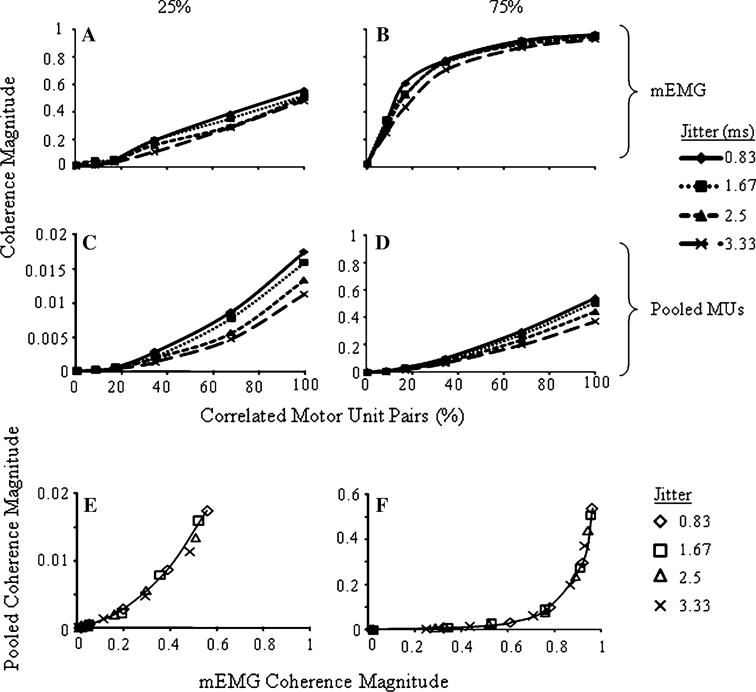
mEMG coherence magnitudes at the common input frequency averaged across trials for all distributions of common input and jitter levels at (a) 25 and (b) 75% common input strength. c and d show the same for pooled coherence magnitudes at 25 and 75% common input strengths, respectively. Note the different scale for the y-axis in (c). Lines illustrate trends only and are not best fit lines. e and f show the relation between mEMG and pooled coherence magnitudes at the common input frequency (averaged across trials) as a function of jitter and including all distributions of common input for 25 and 75% common input strength, respectively. Lines indicate the best fit functions for the condition of 0.83 jitter
Unlike mEMG coherence magnitude, pooled coherence exhibits a strong linear relation to the distribution of common input, regardless of its strength (Fig. 4c and d; r2 > 0.95). In fact, the relations, as well as the absolute magnitudes, for pooled coherence at 75% common input strength (Fig. 4d) appear similar to that of mEMG at 25% common input strength (Fig. 4a). Jitter also has a small but clearer negative effect on pooled coherence magnitude that is evident when 17% or more of the MU pairs are correlated. Furthermore, maximum pooled coherence magnitude at 75% strength only reaches 0.54, much less than the corresponding value of mEMG coherence (0.96). Signal type, common input strength and distribution each had significant effects on coherence magnitude (all p < 0.001), but effects of jitter were not significant.
The relations between mEMG and pooled coherence magnitudes across changing distributions of common input and jitter are shown in Fig. 4e and f for common input strengths of 25 and 75%, respectively. Jitter does not have an influence on the relation between pooled and mEMG coherence in either common input strength condition. Note that mEMG coherence increases more rapidly than pooled coherence, i.e., at a common input strength of 25%, mEMG and pooled coherence achieve maxima that are two-thirds and approximately one-thirtieth, respectively, of that achieved at 75% input strength. Also note that at 25% common input strength the relation between mEMG and pooled coherence approximates a linear function.
Simulation #2
Coherence magnitude increases as a function of common input strength for mEMG and pooled coherence except at the smallest distribution of common input, 0.3% (Fig. 5a–c). For all signal types, a nonlinear model fits the relation between coherence magnitudes and increasing common input strength the best. However, for the unrectified and rectified mEMG (Fig. 5a and b, respectively), coherence magnitudes increase more linearly with increasing common input strength, particularly when 67% of MU pairs receive common input, than does coherence of the pooled MU activity (Table 3). Yet, the coherence magnitudes of the rectified mEMG are smaller and less linear when 17% of the MUs are correlated than that of the unrectified mEMG. Furthermore, rectified and unrectified mEMG coherence is sensitive to the number of correlated MU pairs over different ranges, as seen by comparing the increases between 0.3 and 17% and between 17 and 67.8%.
Fig. 5.
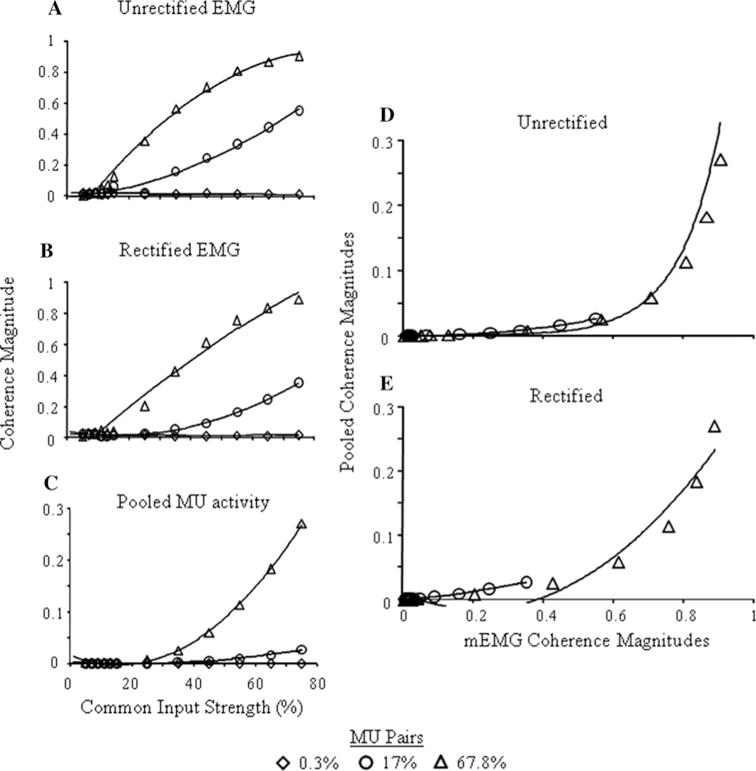
Average coherence magnitudes at the common input frequency are shown for a unrectified mEMG, b rectified mEMG and c pooled MU activity. Relations between pooled and d unrectified and e rectified mEMG are also shown. Coherence magnitudes are shown for all common input strengths and for 0.3, 17 and 67.8% correlated MU pairs. Lines indicate best fit functions. Note the different scales for the y-axes
Table 3.
Linear and nonlinear relations between (1) the unrectified mEMG, rectified mEMG and pooled coherence magnitudes at the common input frequency vs. common input strength and (2) pooled vs. rectified and unrectified mEMG for conditions in which 17 and 68.7% of motor-unit pairs receive common input (see Fig. 5)
| Signal type | MU pairs (%) | Function of common input strength
|
Relations with pooled coherence
|
||
|---|---|---|---|---|---|
| Linear | Nonlinear | Linear | Nonlinear | ||
| Unrectified mEMG | 17 |
y = 7.7E-03x − 0.07 r2 = 0.96 |
y = 8E-05x2 + 1.7E-03x − 0.01 r2 = 0.99 |
y = 0.04x − 0.002 r2 = 0.90 |
y = 0.1x2− 0.01x + 0.0003 r2 = 0.999 |
| 67.8 |
y = 0.01x − 0.06 r2 = 0.96 |
y = −2E-04×2 + 0.03× − 0.18 r2 = 0.99 |
y = 0.20x − 0.02 r2 = 0.71 |
y = 0.0002e8.35x r2 = 0.96 |
|
| Rectified mEMG | 17 |
y = 4.2E-03x − 0.04 r2 = 0.86 |
y = 1E-04x2 − 3.2E-03x + 0.04 r2 = 0.999 |
y = 0.08x − 0.002 r2 = 0.99 |
y = 0.09×2 + 0.05x − 0.001 r2 = 0.998 |
| 67.8 |
y = 0.01x − 0.11 r2 = 0.98 |
y = −4E-05×2 + 0.02x − 0.14 r2 = 0.98 |
y = 0.22x − 0.02 r2 = 0.80 |
y = 0.54x2 − 0.23x + 0.01 r2 = 0.96 |
|
| Pooled MU activity | 17 |
y = 3E-04x − 0.004 r2 = 0.81 |
y = 8E-06×2 − 3E-04x + 0.002 r2 = 0.99 |
||
| 67.8 |
y = 3.4E-03x − 0.05 r2 = 0.86 |
y = 8E-05x2 − 2.4E-03x + 0.02 r2 = 0.999 |
|||
Coherence is a function of common input strength and pooled coherence is a function of mEMG coherence in these regression-fit equations
Pooled coherence magnitude is nonlinearly related to the strength of common input when 17% and 67.8% of the MU pairs are correlated (Fig. 5c; Table 3). Note that there is very little change in pooled coherence magnitude as the distribution of common input increases from 0.3 to 17%, whereas this change is larger as the distribution changes from 17 to 67.8%. The effects of signal type, common input strength and distribution on coherence magnitudes were all statistically significant (p < 0.001).
Figure 5d and e show the relations between pooled and (1) unrectified and (2) rectified mEMG coherence magnitudes, respectively, at the common input frequency of 30 Hz as common input strength is varied for conditions in which 3, 17 and 67.8% of MU pairs are correlated. The relations follow similar trends as observed across the different distributions of common input evident in Fig. 4. The nonlinear relations between rectified mEMG and rectified mEMG vs. pooled coherence magnitudes are most evident when 67.8% of the active MUs receive common input and larger values of coherence are achieved with stronger common inputs. The range of coherence values is smaller when 17% of the MUs receive correlated input, particularly for the pooled coherence, and thus a linear fit was as good a descriptor of the relation between pooled and the mEMG signals as a nonlinear one (Table 3). At 0.3%, there is little change in coherence magnitudes in any of the three signal types and thus there are only very weak relations between them.
The percentages of trials with coherence magnitudes significantly greater than 0 were examined as indicators of the ability of coherence of the rectified and unrectified mEMG signal types to detect correlated input (Fig. 6, dotted and dashed lines, respectively). For both mEMG measures, only 10 to 20% of trials exhibited significant coherence when 0.3% of the MU pairs were correlated. For the unrectified mEMG, when the distribution of common input increased to 17%, the percentage of trials with significant coherence increased steeply (from 10 to 100%) as common input strength grew from 15 to 35%. For common input strength of 35% and greater, all trials showed significant coherence magnitudes. When 67.8% MU pairs receive common input, the percentage of significant trials increases sharply between 9 and 15% common input strength, with significant coherence occurring in all trials at common input strengths of 25% and greater. For the rectified mEMG, the relation between percentage of significant trials and common input strength is shifted rightward indicating that coherence between rectified mEMG signals is less sensitive and less suited for detecting low levels of correlated input than unrectified mEMG signals.
Fig. 6.
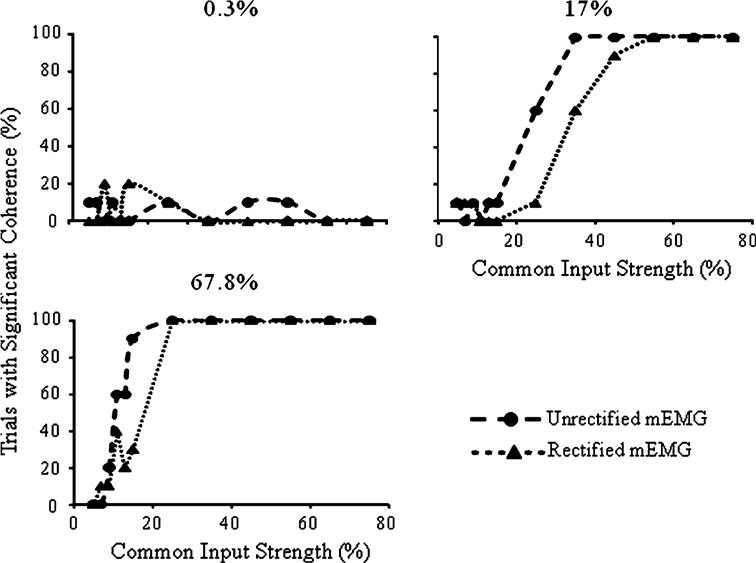
Percentage of trials with significant 30 Hz coherence for the unrectified and rectified mEMG signals (dashed and dotted lines, respectively) for simulations with 0.3, 17 and 67.8% correlated MU pairs
Simulation #3
Simulation #3 assessed the effect of changes in MUAP waveform on unrectified mEMG coherence magnitude, as influenced by changes in fiber CV and the distance from electrode to MU territory (ETD). Across all conditions, the mEMG coherence magnitude increased with increasing distribution of common input and tended to decrease with increasing jitter. The increase in magnitude as a function of distribution of common input occurs slightly faster with a conduction velocity of 4 m/s; however, these differences were very small. There were no consistent differences between the two ETD conditions or interactions between ETD and CV. Statistical analysis revealed a main effect for distribution of common input (p < 0.001), but not for jitter, ETD or CV.
Discussion
The surface mEMG signal is determined by the linear summation of multiple action potentials generated by the active MUs detected by electrodes placed on the skin over the muscle. Many factors, including, but not limited to, signal cancellation, influence the accuracy to which neural strategies can be extracted from such a signal (for review see Farina et al. 2004). In fact, both the amplitude and frequency content of mEMG, measures often used to infer these neural strategies (e.g., recruitment, discharge rate, use of specific fiber types, etc.), have been shown to be influenced by these other factors (Day and Hulliger 2001; Keenan et al. 2005, 2006, 2007) leading to misinterpretation.
Coherence has been used to determine the existence of correlated input to two or more motor neuron pools, its frequency content, as well as its strength which depends on how many MUs receive common input and the strength of the common input. The interpretation of coherence between two mEMGs is complicated not only by recording characteristics, effects of volume conduction on the waveform of MU action potentials, and the summation of these potentials, but also the nonlinear relation between the coherence of event trains of individual unit pairs and the coherence of their aggregate activities (Christakos 1997). Thus, the present study was performed to determine (1) the ability of coherence between mEMGs to detect correlated MU activity and the range of correlation strengths in which mEMG coherence can be usefully employed, (2) the influence of parameters that influence action potential waveforms on mEMG coherence and (3) the influence of rectification on mEMG coherence. We discuss our results addressing each of these goals in turn below.
Pooled and unrectified mEMG coherence
Pooled and unrectified mEMG coherence measures differ in their relations to the strength and extent of common input. The unrectified mEMG coherence increased non-linearly with respect to both the strength and distribution of common input, with decreasing sensitivity as the strength and distribution of correlated inputs grew. These results are consistent with those presented by Christakos (1997) who showed that coherence magnitudes based on aggregate measures of unit activity are disproportionately large at small values of unit-to-unit coherence and exhibit reduced sensitivity, including saturation, as values of unit-to-unit coherence increase. Christakos’ simulations differed from ours in several respects, including use of event trains rather than analog signals, the method of creating correlated sets of event trains and the numbers of units in the unit populations. Since the coherence between event trains is preserved in linear transformations of the event trains (Christakos et al. 1984), departures from Christakos’ results due to the creation of aggregate signals by summation of MUAPs of similar amplitude in our simulations would not be expected. However, the resulting patterns of correlation did differ from those observed by Christakos, i.e., we found smaller coherence magnitudes at physiological levels of correlation (unit-to-unit correlations of 0.04 to 0.25, for common inputs of 25% to 55%) and that nonlinearity is less severe than noted by Christakos (1997). This difference may be due to the many fewer units used in our simulation and that the correlations were generated to mimic those produced in motoneuron pools by physiological mechanisms. Our results also suggest that under these conditions, mEMG coherence magnitudes begin to saturate at common input strengths greater than found in most experimental studies. Nonetheless, the nonlinear characteristic of mEMG coherence should be considered carefully when attempting to (1) infer the distribution/strength of correlated input or (2) assess the modulation of correlated input as a function of changes in given experimental conditions, e.g., object compliance or ramp vs. isometric force production (Baker et al. 1999; Kilner et al. 2002).
Provided that the nonlinear dependence of mEMG coherence on MU correlation is considered, analysis of the relation between mEMG and pooled coherence computed at the frequency of common input suggests that mEMG coherence could be used to derive information about the magnitude of common neural input in populations of MUs whose activity make up the EMG signal. Specifically, up to 99% of the variance in the unrectified mEMG coherence could be accounted for by a nonlinear relation to the pooled coherence. In assessing modulation of correlated input, the nonlinearity of mEMG coherence suggests that this measure is more or less useful than pooled coherence depending on the level of correlated input. At moderate strengths of correlation, mEMG coherence would be more sensitive to modulation of correlated input than pooled coherence, but mEMG coherence would be less sensitive when common input is strong. Although mEMG coherence starts to saturate at the strongest common inputs, this occurs at common input strengths greater than found in most physiological studies (>55%), indicating that mEMG coherence would be a useful measure in many experimental situations.
Influence of action potential waveforms
The correlating event train in our simulations had a fixed frequency of 30 Hz. A periodic input would be expected to have finite bandwidth in experimental situations. Simulations of motoneuron spike trains demonstrate decreasing coherence values as the bandwidth of correlating inputs widens (Lowery et al. 2007). Consequently, smaller unit-to-unit coherence magnitudes would be expected for correlating inputs with wider bandwidths, and the relations between common input strength and different coherence measures should be examined under these conditions. In this regard, we should note the insensitivity of coherence magnitude to fiber CV and electrode-to-unit distances found in simulation #3, which is in contrast with expectations based on the results of Keenan et al. (2007). They found large changes in temporal cross-correlations between simulated mEMGs with variation of recording parameters. A broad-band (random) correlating input was used in their simulations, and the contrast between their results and ours, and the dependence of unit-to-unit coherence on correlating input bandwidth just noted, suggests that recording parameters may have more influence with correlating signals having broader bandwidth. This point remains to be determined.
Effects of mEMG rectification
Rectification is a nonlinear operation commonly applied to mEMG signals prior to analysis, which results in shifts of its autospectra to lower frequencies effectively increasing the firing rate information in the signal (Myers et al. 2003; Yao et al. 2007; however, see Farina et al. 2004). It has been suggested that rectification is an appropriate (Yao et al. 2007) and even necessary (Myers et al. 2003) step prior to assessing cortico-muscular coherence. However, Neto and Christou (2010) recently concluded that rectification obscures identification of the frequency of common input to two mEMG signals. Our results indicate that rectification reduces coherence magnitudes and the ability to detect the frequency of common input in two mEMG signals at smaller common input strengths. However, coherence at the frequency of common input was detected at most physiological input strengths and the smaller coherence magnitudes of the rectified mEMG grow in a more linear fashion with the strength and extent of common input. Given this relation to these parameters, rectified mEMG may be easier to interpret than unrectified mEMG when examining the relative modulation in coherence with respect to task variables. Moreover, it may be somewhat more suitable for detecting modulation at greater correlation strengths than unrectified mEMG. However, unrectified mEMG still exhibits a greater sensitivity at lower strengths and distribution of correlated MU pairs than the rectified mEMG. These results suggest that examining both rectified and unrectified mEMG may provide more accurate information than either measure used in isolation.
Limitations and unresolved issues
The current study was intended to extend the insights provided by Christakos’ (1994 Christakos’ (1997) work by simulating a smaller MU population and examining both the influence of the shape of the MUAP waveform and the preprocessing technique of mEMG rectification on the relation between mEMG and pooled coherence. As with all simulation studies, the applications of our results are necessarily limited to the scenario we simulated (e.g., small differences in discharge rates, uniform action potential amplitudes, fixed common input frequency, etc.). Furthermore, we used a probabilistic model for our simulations, which did not incorporate any membrane biophysics that have been shown to influence motor neuron discharge correlations (Lowery and Erim 2005; Taylor and Enoka 2004a, b). Such a model based on conductance formulation may capture more accurately any ISI fluctuations associated with common synaptic input. Future work will address many of these outstanding issues.
Acknowledgments
The authors would like to thank Dr. Andrew Fuglevand for consulting on the motor-unit simulation procedures. This work was partially supported by NIH grants R01 AR47301-01A2 (MS) and R01 NS22454-20 (TMH).
Contributor Information
Jamie A. Johnston, Faculty of Kinesiology, University of Calgary, Calgary, AB, Canada
Gabriele Formicone, Edumedia Labs LLC, Chandler, AZ 85249, USA.
Thomas M. Hamm, Division of Neurobiology, Barrow Neurological Institute, Phoenix, AZ 85013, USA
Marco Santello, School of Biological and Health Systems Engineering, Arizona State University, 501 East Tyler Mall, ECG Building, Suite 346, Tempe, AZ 85287-0404, USA.
References
- Amjad AM, Halliday DM, Rosenberg JR, Conway BA. An extended difference of coherence test for comparing and combining several independent coherence estimates: theory and application to the study of motor units and physiological tremor. J Neurosci Methods. 1997;73:69–79. doi: 10.1016/s0165-0270(96)02214-5. [DOI] [PubMed] [Google Scholar]
- Ashby P, Zilm D. Relationship between EPSP shape and cross-correlation profile explored by computer simulation for studies on human motoneurons. Exp Brain Res. 1982;47:33–40. doi: 10.1007/BF00235883. [DOI] [PubMed] [Google Scholar]
- Baker SN, Kilner JM, Pinches EM, Lemon RN. The role of synchrony and oscillations in the motor output. Exp Brain Res. 1999;128:109–117. doi: 10.1007/s002210050825. [DOI] [PubMed] [Google Scholar]
- Binder MD, Powers RK. Relationship between simulated common synaptic input and discharge synchrony in cat spinal motoneurons. J Neurophysiol. 2001;86:2266–2275. doi: 10.1152/jn.2001.86.5.2266. [DOI] [PubMed] [Google Scholar]
- Christakos CN. Analysis of synchrony (correlations) in neural populations by means of unit-to-aggregate coherence computation. Neurosci. 1994;58:43–57. doi: 10.1016/0306-4522(94)90155-4. [DOI] [PubMed] [Google Scholar]
- Christakos CN. On the detection and measurement of synchrony in neural populations by coherence analysis. J Neurophysiol. 1997;78:3453–3459. doi: 10.1152/jn.1997.78.6.3453. [DOI] [PubMed] [Google Scholar]
- Christakos CN, Rost I, Windhorst U. The use of frequency domain techniques in the study of signal transmission in skeletal muscle. Pflugers Archiv-European J Physiol. 1984;400:100–105. doi: 10.1007/BF00670543. [DOI] [PubMed] [Google Scholar]
- Conway BA, Halliday DM, Farmer SF, Shahani U, Maas P, Weir AI, Rosenberg JR. Synchronization between motor cortex and spinal motoneuronal pool during the performance of a maintained motor task in man. J Physiol (Lond) 1995;489:917–924. doi: 10.1113/jphysiol.1995.sp021104. [DOI] [PMC free article] [PubMed] [Google Scholar]
- Cope TC, Fetz EE, Matsumura M. Cross-correlation assessment of synaptic strength of single Ia fibre connections with triceps surae motoneurones in cats. J Physiol (Lond) 1987;390:161–188. doi: 10.1113/jphysiol.1987.sp016692. [DOI] [PMC free article] [PubMed] [Google Scholar]
- Day SJ, Hulliger M. Experimental simulation of cat electromyogram: evidence for algebraic summation of motor-unit action-potential trains. J Neurophysiol. 2001;86(5):2144–2158. doi: 10.1152/jn.2001.86.5.2144. [DOI] [PubMed] [Google Scholar]
- Farina D, Merletti R, Enoka RM. The extraction of neural strategies from the surface EMG. J Appl Physiol. 2004;96(4):1486–1495. doi: 10.1152/japplphysiol.01070.2003. [DOI] [PubMed] [Google Scholar]
- Farmer SF, Bremner FD, Halliday DM, Rosenberg JR, Stephens JA. The frequency content of common synaptic inputs to motoneurones studied during voluntary isometric contraction in man. J Physiol. 1993;470:127–155. doi: 10.1113/jphysiol.1993.sp019851. [DOI] [PMC free article] [PubMed] [Google Scholar]
- Farmer SF, Gibbs J, Halliday DM, Harrison LM, James LM, Mayston MJ, Stephens JA. Changes in EMG coherence between long and short thumb abductor muscles during human development. J Physiol. 2007;579(2):389–402. doi: 10.1113/jphysiol.2006.123174. [DOI] [PMC free article] [PubMed] [Google Scholar]
- Fetz EE, Gustafsson B. Relation between shapes of post-synaptic potentials and changes in firing probability of cat motoneurones. J Physiol (Lond) 1983;341:387–410. doi: 10.1113/jphysiol.1983.sp014812. [DOI] [PMC free article] [PubMed] [Google Scholar]
- Fuglevand AJ, Winter DA, Patla AE, Stashuk D. Detection of motor unit action potentials with surface electrodes: influence of electrode size and spacing. Biol Cybern. 1992;67:143–153. doi: 10.1007/BF00201021. [DOI] [PubMed] [Google Scholar]
- Fuglevand AJ, Winter DA, Patla AE. Models of recruitment and rate coding organization in motor-unit pools. J Neurophysiol. 1993;70:2470–2488. doi: 10.1152/jn.1993.70.6.2470. [DOI] [PubMed] [Google Scholar]
- Hansen S, Hansen NL, Christensen LO, Petersen NT, Nielsen JB. Coupling of antagonistic ankle muscles during co-contraction in humans. Exp Brain Res. 2002;146(3):282–292. doi: 10.1007/s00221-002-1152-3. [DOI] [PubMed] [Google Scholar]
- Johnston JA, Winges SA, Santello M. Periodic modulation of motor-unit activity in extrinsic hand muscles during multidigit grasping. J Neurophysiol. 2005;94:206–218. doi: 10.1152/jn.01134.2004. [DOI] [PMC free article] [PubMed] [Google Scholar]
- Johnston JA, Winges SA, Santello M. Neural control of hand muscles during prehension. In: Sternad D, editor. Progress in motor control—a multidisciplinary perspective. Springer; New York: 2009. pp. 577–596. [DOI] [PubMed] [Google Scholar]
- Keenan KG, Farina D, Maluf KS, Merletti R, Enoka RM. Influence of amplitude cancellation on the simulated surface electromyogram. J Appl Physiol. 2005;98(1):120–131. doi: 10.1152/japplphysiol.00894.2004. [DOI] [PubMed] [Google Scholar]
- Keenan KG, Farina D, Merletti R, Enoka RM. Influence of motor unit properties on the size of the simulated evoked surface EMG potential. Exp Brain Res. 2006;169(1):37–49. doi: 10.1007/s00221-005-0126-7. [DOI] [PubMed] [Google Scholar]
- Keenan KG, Farina D, Meyer FG, Merletti R, Enoka RM. Sensitivity of the cross-correlation between simulated surface EMGs for two muscles to detect motor unit synchronization. J Appl Physiol. 2007;102(3):1193–1201. doi: 10.1152/japplphysiol.00491.2006. [DOI] [PubMed] [Google Scholar]
- Kilner JM, Baker SN, Salenius S, Jousmaki V, Hari R, Lemon RN. Task-dependent modulation of 15–30 Hz coherence between rectified EMGs from human hand and forearm muscles. J Physiol. 1999;516(2):559–570. doi: 10.1111/j.1469-7793.1999.0559v.x. [DOI] [PMC free article] [PubMed] [Google Scholar]
- Kilner JM, Alonso-Alonso M, Fisher R, Lemon RN. Modulation of synchrony between single motor units during precision grip tasks in humans. J Physiol. 2002;541:937–948. doi: 10.1113/jphysiol.2001.013305. [DOI] [PMC free article] [PubMed] [Google Scholar]
- Kirkwood PA, Sears TA. The synaptic connexions to intercostal motoneurones as revealed by the average common excitation potential. J Physiol (Lond) 1978;275:103–134. doi: 10.1113/jphysiol.1978.sp012180. [DOI] [PMC free article] [PubMed] [Google Scholar]
- Kirkwood PA, Sears TA. The effects of single afferent impulses on the probability of firing of external intercostal motoneurones in the cat. J Physiol (Lond) 1982;322:315–336. doi: 10.1113/jphysiol.1982.sp014039. [DOI] [PMC free article] [PubMed] [Google Scholar]
- Kirkwood PA, Sears TA, Tuck DL, Westgaard RH. Variations in the time course of the synchronization of intercostal motoneurones in the cat. J Physiol. 1982;327:105–135. doi: 10.1113/jphysiol.1982.sp014223. [DOI] [PMC free article] [PubMed] [Google Scholar]
- Knox CK. Cross-correlation functions for a neuronal model. Biophys J. 1974;14:567–582. doi: 10.1016/S0006-3495(74)85936-9. [DOI] [PMC free article] [PubMed] [Google Scholar]
- Lowery MM, Erim Z. A simulation study to examine the effect of common motoneuron inputs on correlated patterns of motor unit discharge. J Comput Neurosci. 2005;19:107–124. doi: 10.1007/s10827-005-0898-6. [DOI] [PubMed] [Google Scholar]
- Lowery MM, Myers LJ, Erim Z. Coherence between motor unit discharges in response to shared neural inputs. J Neurosci Methods. 2007;163:384–391. doi: 10.1016/j.jneumeth.2007.03.011. [DOI] [PubMed] [Google Scholar]
- Matthews PB. Relationship of firing intervals of human motor units to the trajectory of post-spike after-hyperpolarization and synaptic noise. J Physiol (Lond) 1996;492:597–628. doi: 10.1113/jphysiol.1996.sp021332. [DOI] [PMC free article] [PubMed] [Google Scholar]
- McIsaac TL, Fuglevand AJ. Common synaptic input across motor nuclei supplying intrinsic muscles involved in the precision grip. Exp Brain Res. 2008;188(1):159–164. doi: 10.1007/s00221-008-1432-7. [DOI] [PMC free article] [PubMed] [Google Scholar]
- Moore GP, Segundo JP, Perkel DH, Levitan H. Statistical signs of synaptic interaction in neurons. Biophys J. 1970;10:876–900. doi: 10.1016/S0006-3495(70)86341-X. [DOI] [PMC free article] [PubMed] [Google Scholar]
- Myers LJ, Lowery M, O’Malley M, Vaughan CL, Heneghan C, St Clair Gibson A, Harley YX, Sreenivasan R. Rectification and non-linear pre-processing of EMG signals for cortico-muscular analysis. J Neurosci Methods. 2003;124(2):157–165. doi: 10.1016/s0165-0270(03)00004-9. [DOI] [PubMed] [Google Scholar]
- Neto OP, Christou EA. Rectification of EMG signal impairs the identification of oscillatory input to the muscle. J Neurophysiol. 2010;103:1093–1103. doi: 10.1152/jn.00792.2009. [DOI] [PMC free article] [PubMed] [Google Scholar]
- Reyes AD, Fetz EE. Two modes of interspike interval shortening by brief transient depolarizations in cat neocortical neurons. J Neurophysiol. 1993a;69:1661–1672. doi: 10.1152/jn.1993.69.5.1661. [DOI] [PubMed] [Google Scholar]
- Reyes AD, Fetz EE. Two modes of interspike interval shortening by brief transient depolarizations in cat neocortical neurons. J Neurophysiol. 1993b;69(5):1661–1672. doi: 10.1152/jn.1993.69.5.1661. [DOI] [PubMed] [Google Scholar]
- Rosenberg JR, Amjad AM, Breeze P, Brillinger DR, Halliday DM. The fourier approach to the identification of function coupling between neuronal spike trains. Prog Biophys Molec Biol. 1989;53:1–31. doi: 10.1016/0079-6107(89)90004-7. [DOI] [PubMed] [Google Scholar]
- Santello M, Fuglevand AJ. Role of across-muscle motor unit synchrony for the coordination of forces. Exp Brain Res. 2004;159:501–508. doi: 10.1007/s00221-004-1975-1. [DOI] [PMC free article] [PubMed] [Google Scholar]
- Santello M, Formicone G, Johnston JA, Hamm TH. Assessment of across-muscle coherence using multi-vs. single-unit signals. Soc Neurosci. 2005 doi: 10.1007/s00221-010-2455-4. Abstr 399.3. [DOI] [PMC free article] [PubMed] [Google Scholar]
- Sears TA, Stagg D. Short-term synchronization of intercostal motoneurone activity. J Physiol (Lond) 1976;263:357–381. doi: 10.1113/jphysiol.1976.sp011635. [DOI] [PMC free article] [PubMed] [Google Scholar]
- Semmler JG, Kornatz KW, Dinenno DV, Zhou S, Enoka RM. Motor unit synchronization is enhanced during slow lengthening contractions of a hand muscle. J Physiol. 2002;545:681–695. doi: 10.1113/jphysiol.2002.026948. [DOI] [PMC free article] [PubMed] [Google Scholar]
- Semmler JG, Kornatz KW, Enoka RM. Motor-unit coherence during isometric contractions is greater in a hand muscle of older adults. J Neurophysiol. 2003;90(2):1346–1349. doi: 10.1152/jn.00941.2002. [DOI] [PubMed] [Google Scholar]
- Semmler JG, Sale MV, Meyer FG, Nordstrom MA. Motor-Unit Coherence and its relation with synchrony are influenced by training. J Neurophysiol. 2004;92(6):3320–3331. doi: 10.1152/jn.00316.2004. [DOI] [PubMed] [Google Scholar]
- Taylor AM, Enoka RM. Quantification of the factors that influence discharge correlation in model motor neurons. J Neurophysiol. 2004a;91:796–814. doi: 10.1152/jn.00802.2003. [DOI] [PubMed] [Google Scholar]
- Taylor AM, Enoka RM. Optimization of input patterns and neuronal properties to evoke motor neuron synchronization. J Comput Neurosci. 2004b;16:139–157. doi: 10.1023/B:JCNS.0000014107.16610.2e. [DOI] [PubMed] [Google Scholar]
- Winges SA, Santello M. Common input to motor units of digit flexors during multi-digit grasping. J Neurophysiol. 2004;92:3210–3220. doi: 10.1152/jn.00516.2004. [DOI] [PubMed] [Google Scholar]
- Winges SA, Johnston JA, Santello M. Muscle-pair specific distribution and grip type modulation of neural common input to extrinsic digit flexors. J Neurophysiol. 2006;96:1258–1266. doi: 10.1152/jn.00327.2006. [DOI] [PMC free article] [PubMed] [Google Scholar]
- Winges SA, Kornatz KW, Santello M. Common input to motor units of intrinsic and extrinsic hand muscles during two-digit object hold. J Neurophysiol. 2008;99(3):1119–1126. doi: 10.1152/jn.01059.2007. [DOI] [PMC free article] [PubMed] [Google Scholar]
- Yao W, Fuglevand AJ, Enoka RM. Motor-unit synchronization increases EMG amplitude and decreases force steadiness of simulated contractions. J Neurophysiol. 2000;83:441–452. doi: 10.1152/jn.2000.83.1.441. [DOI] [PubMed] [Google Scholar]
- Yao B, Salenius S, Yue GH, Brown RW, Liu JZ. Effects of surface EMG rectification on power and coherence analyses: an EEG and MEG study. J Neurosci Methods. 2007;159(2):215–223. doi: 10.1016/j.jneumeth.2006.07.008. [DOI] [PubMed] [Google Scholar]