

Abstract
Free fatty acid receptor 2 (FFAR2, also known as GPR43) is a G-protein-coupled receptor activated by short-chain fatty acids that are produced by gut microbiota through fermentation of nondigestible carbohydrates. FFAR2 functions as a metabolic sensor and is expressed in metabolically active tissues, such as adipose tissue. Earlier studies proved the connection between FFAR2 and adipocyte differentiation in mice. The aim of this study was to investigate the implication of FFAR2 receptor in adipogenesis in human chorion-derived mesenchymal stem cells (cMSCs). The short-chain fatty acid, propionate, and phenylacetamide a selective FFAR2 agonist resulted in a marked suppression of lipid droplet accumulation during the adipogenic differentiation of cMSCs. Western blot studies revealed that FFAR2 was detectable at any time point of the differentiation period. The direct involvement of FFAR2 in the differentiation into adipocytes was proven by the downregulation of its gene expression in cMSCs by lentiviral messenger RNA (mRNA) silencing transduction particles. Our results showed that a significant suppression in lipid accumulation upon FFAR2 agonist treatments was elicited by FFAR2-silencing. Based on these results we suggest that propionate inhibits the formation of adipocytes from MSCs and acts on adipogenesis predominantly via FFAR2.
Keywords: : free fatty acids, cMSC, FFAR2 (GPR43), adipose tissue differentiation
Introduction
The fundamental role of adipocytes is to store energy in the form of triacylglycerol when the energy intake is higher than the expenditure and to mobilize the stored lipid content when energy is required [1–3]. Overweight and obesity, an excessive fat accumulation, are the results of the long-term increased intake of energy-rich foods and the lack of physical activity that is the characteristic of modern lifestyle [4,5]. According to the World Health Organization, the worldwide prevalence of obesity more than doubled in the last 30 years including childhood obesity, therefore to face one of the most serious public health challenges it is necessary to understand the mechanism and regulation of adipogenesis (www.who.int/mediacentre/factsheets/fs311/en).
Mesenchymal stem cells (MSCs) are defined as cells capable of expansion, self-renewal, and differentiation into osteocytic, chondrocytic, and adipocytic lineages when stimulated under specific conditions [2,6–8]. They can be found in many fetal and adult tissues, including adipose tissue [9,10], bone marrow [11,12], and umbilical cord [8,13]. However, their use for research purposes is restricted either by the invasive procedures by which they are obtained or by their low yields and limited proliferative capacity. On the other hand, human placenta is a rich source of multipotent stem cells, it can be easily obtained at the end of gestation when the placenta is delivered and usually discarded, and its use is not restricted by ethical issues [6–8]. MSCs are considered as an alternative source for cell therapy and regenerative medicine, and they can also serve as a good model for adipogenesis [14].
Recent investigations have demonstrated that the gut microbiota is involved in obesity through producing short chain fatty acids (SCFAs) such as acetate, propionate, and butyrate, the fermentation products of dietary fibers [4,15]. SCFAs not only serve as energy sources for the host but also act as signaling molecules through G-protein-coupled receptors exerting multiple effects on metabolic regulation [5]. In the family of the free fatty acid binding receptors (FFARs), two receptors—FFAR2 and FFAR3, also known as G-protein-coupled receptor 43 (GPR43) and G-protein-coupled receptor 41 (GPR41)—have been recently described to be activated by SCFAs [4,16]. Acetate and propionate are the most potent agonists of FFAR2, whereas propionate proved to be the most active agent affecting FFAR3 [17,18].
Both receptors exhibit similar tissue localization [19–25], however, FFAR3 is exclusively expressed in some regions of the sympathetic nervous system [26,27] and only FFAR2, but not FFAR3, is expressed in adipocytes [15,28,29]. Contrary to the previous findings it has been recently reported that in white adipose tissue of mice FFAR2 activation by SCFAs suppresses adipose-insulin signaling, which inhibits fat accumulation and promotes the metabolism of lipids and glucose in other tissues [29].
Although the implication of FFAR2 receptor in adipogenesis has been established in mice, its physiological significance remained uncovered in humans. In this study we use human chorion-derived mesenchymal stem cells (cMSCs) as an experimental model and demonstrate that FFAR2 activation by its endogenous ligand propionate and by a synthetic phenylacetamide ligand FFAR2 agonist decreases the capability of cMSCs to differentiate into adipocyte lineage and consequently inhibits fat accumulation.
Materials and Methods
Chemicals and antibodies
All chemicals were obtained from Sigma-Aldrich (Saint Louis, MO) unless otherwise indicated. Antibodies used in this study are listed in the Supplementary Table S1 (Supplementary Data are available online at www.liebertpub.com/scd).
Ethic statement
Placentas were obtained at the end of gestation from healthy human donors. All procedures were authorized by the Regional and Institutional Ethics Committee of the University of Debrecen, and it was in accordance with the guidelines of the European Union Council and the Hungarian regulations under license number DEOEC-RKEB-2946-2009.
Isolation and characterization of cMSCs
cMSCs were isolated from four different healthy donors as described previously [30,31]. Cell surface markers were determined with flow cytometric analysis (Becton Dickinson BD FACSCalibur and BD Multiset Software v3.0x for Mac OS X, Heidelberg, Germany) by using the appropriate antibodies (Supplementary Table S1) as follows. Cells were considered as MSCs and used for further analysis if they exhibited the cell surface markers CD105, CD73, and CD90 but not CD34, CD45, von Willebrand factor (vWF), and human leukocyte antigen G (HLA-G), and were able to differentiate down the adipogenic, osteogenic, and chondrogenic lineages.
Culturing and differentiation of cMSCs and human adipose-derived MSCs
Human adipose-derived mesenchymal stem cells (hAMSCs) were cultured in low glucose Dulbecco's modified Eagle's medium (DMEM) supplemented with 10% heat-inactivated fetal bovine serum (FBS), 1% penicillin-streptomycin solution and 2 mM l-glutamine in humidified atmosphere of 5% CO2 at 37°C. Two days after reaching confluence (day 0), the culturing medium was replaced with differentiation-inducing medium containing high glucose DMEM with 10% FBS, 1% penicillin-streptomycin solution, 2 mM l-glutamine, 20 mM HEPES (pH 7.4), and inducers such as 1 μM dexamethasone, 200 μM indomethacin, and 0.5 mM 3-isobutyl-1-methylxanthine (IBMX) dissolved in dimethyl sulfoxide (DMSO) and 10 μM insulin (Humulin R; Eli Lilly). cMSCs were seeded in 96-well microplates and differentiation was induced with a differentiation-inducing medium alone or supplemented with acetate, propionate or a synthetic phenylacetamide FFAR2 agonist (Calbiochem, San Diego, CA) dissolved in DMSO in concentrations between 3.3 × 10⁻⁵–3.3 × 10⁻³ M for acetate and propionate and 10−7–1.1 × 10⁻⁵ M for FFAR2 agonist. Cells were maintained in this medium up to 14 days and the medium was changed at days 0, 3, 7, 10, and 14 of differentiation. After the establishment of optimal conditions 3.3 mM propionate and 3.7 μM FFAR2 agonist were used in the subsequent experiments and samples were analyzed on days 0, 3, 7, 10, and 14 of differentiation.
hAMSCs were isolated from pericardial adipose tissue and were cultured in DMEM-F12 medium supplemented with 10% FBS, 1% penicillin-streptomycin solution, and 2 mM l-glutamine in humidified atmosphere of 5% CO2 at 37°C. Cells were seeded into six-well microplates and differentiated according to the protocol described previously [31]. Medium was changed and samples were analyzed on days 0, 7, and 14 of differentiation.
Oil Red O staining
Cells were washed in phosphate-buffered saline (PBS) and then fixed in 4% formaldehyde for 15 min at room temperature. After washing twice in distilled water, cells were stained in freshly diluted Oil Red O (ORO) solution (in 0.3% final concentration) for 30 min at room temperature. After being washed three times in distilled water, samples were mounted in Mowiol 4-88 anti-fade solution and visualized by a Leica DM IL LED microscope (Leica, Microsystems, Mannheim, Germany).
Nile Red staining
cMSCs were seeded and treated in 96-well microplates. After removing the supernatants, cells were washed in PBS, fixed in 4% formaldehyde for 10 min at room temperature, and washed again. Staining was carried out with 10 μg/mL Nile Red solution in dark for 30 min at room temperature. After being washed twice in PBS, fluorescence intensity was measured at 485/538 nm in a microplate fluorimeter (Fluoroscan Ascent FL; Thermo Fisher Scientific, Waltham, MA). Data acquisition and processing were done using the Ascent Software Ver. 2.6. Protein concentrations were determined by BCA protein assay kit (Thermo Scientific, Schwerte, Germany) at 540 nm in an enzyme-linked immunosorbent assay (ELISA) Reader (Labsystem Multiscan MS, Mountain View, CA). The fluorescence intensity was normalized to the protein concentration of each sample and was expressed in arbitrary unit/μg protein. To visualize the Nile Red staining, cells were cultured and treated in 24-well plates, stained as described above and were analyzed with a Leica SP8 confocal microscope (Leica, Microsystems).
RNA isolation, reverse transcription, and quantitative polymerase chain reaction
Total RNA was extracted with TRI Reagent (Molecular Research Center, Inc., Cincinnati, OH) following the manufacturer's protocol. Isolated RNA were treated with RNase free DNase (Promega Co., Madison, WI) and reverse transcription (RT) were conducted with qPCRBIO cDNA Synthesis Kit (PCR Biosystems Ltd., London, UK). Diluted complementary DNA (cDNA) were amplified in RT-coupled quantitative polymerase chain reaction (RT-qPCR) with qPCRBIO SyGreen Lo-ROX Supermix (PCR Biosystems Ltd.) using Light-Cycler 480 system (Roche Applied Science, Penzberg, Germany). The gene expression levels were normalized to 18S as a reference housekeeping gene product. The primer pairs used in the RT-PCR experiments are listed in Supplementary Table S2.
Cell viability assay
The percentage of viable cells was quantified by MTT assay. Cells were treated in 96-well microplates as described above and on day 14 of differentiation supernatants were discarded and cells were exposed to 0.5 mg/mL MTT [3-(4,5-dimethylthiazol-2-yl) 2,5-diphenyltetrazolium] solution. The solution was replaced with DMSO after incubation for 1 h at 37°C, and the absorbance was measured at 570 nm using a microplate reader (Labsystem Multiscan MS). The acquisition and processing of the data were performed with the Ascent Software, version 2.6.
FFAR2 gene silencing in cMSCs
cMSCs were infected by incubation with FFAR2-specific lentiviral transduction particles (construct TRCN0000357229 of Sigma-Aldrich) at a multiplicity of infection of 5 in the presence of 8 μg/mL hexadimethrine bromide. Cells transduced with empty TRC pLKO.1 (Einstein shRNA Core Facility) and TRC2 pLKO.5-puro nontarget small hairpin RNA (nt shRNA) control transduction particles (Sigma-Aldrich) were applied in control experiments. The virus-containing supernatant was removed after 48 h and the transduced cells were selected in the presence of puromycin (3 μg/mL) according to the manufacturer's protocol. The efficiency of FFAR2 silencing was verified by western blot analysis.
Western blot analysis
Western blotting was done as described previously [32]. Briefly, cells were lysed in RIPA buffer and 30 μg of protein lysates were analyzed by western blot using primary antibodies and the anti-rabbit IgG peroxidase conjugate or the anti-mouse IgG HRP-linked secondary antibodies (Supplementary Table S1). The immunoreactive bands were detected by Super Signal West Pico chemiluminescent substrate (Thermo Fisher Scientific) and imaged with FluorChem® FC2 Imager (Alpha Innotec, Kasendorf, Germany) and ChemiDoc™ Touch Imaging System (BIO-RAD, Hercules, CA). Densitometry of the proteins of interest was performed by Image J. 1.46 (NIH, Bethesda, MD). The data were normalized to an internal control protein, and were plotted as relative numbers as described in figure legends.
Statistical analysis
Normalized data were analyzed by either unpaired t-test or one-way analysis of variance (ANOVA) for two groups or two-way ANOVA for more than two groups. Dunnett's or Tukey's multiple comparison tests were used as post hoc tests for one-way or two-way ANOVA. Parametric statistical tests were used if the requirements of such tests were met. Calculations were conducted with the GraphPad for Windows software. All normalized variables used in statistical analyses were found to obey normal distribution. Data presented in this work represent mean ± standard deviation, n means the number of independent experiments.
Results
cMSCs differentiate to adipocytes
The minimal criteria to define MSCs are plastic adherence, expression of a specific surface antigen pattern and the ability to differentiate into osteocytic, chondrocytic, and adipocytic lineages [10]. The capacity of human cMSC to differentiate into adipocytes was verified in the presence of a medium containing the mixture of adipogenic inducers such as dexamethasone, indomethacin, IBMX, and insulin as described in the previous section. During the 14-day-long differentiation period, stem cells lost their fibroblastic morphology and accumulated triglyceride in their cytoplasm as shown by ORO (Fig. 1A) and Nile Red stainings (Fig. 1B) at day 14. Intracellular lipid content was quantified based on the fluorescence intensity of the Nile Red dye. Figure 1C demonstrates that significant amount of triglyceride accumulated as early as day 3 of differentiation, which increased further up to sixfold at the end of the course of adipogenesis (P < 0.001). Beside triglyceride formation that is closely related to an increased rate of de novo lipogenesis, numerous proteins are coordinately expressed during differentiation [2]. Two of them, the peroxisome proliferator-activated receptor-γ (PPARγ)—the master regulator of the adipogenesis program—and the “satiety” hormone leptin made by adipocytes were examined by RT-qPCR. By the end of differentiation the expression levels of these marker genes increased up to 3.52-fold and 7.83-fold, respectively (Supplementary Fig. S1A, B). These results were confirmed by western blot analysis showing that the amount of leptin (Fig. 1D) and PPARγ (Fig. 3D, left upper panel) proteins increased throughout the differentiation procedure. Since most of the previous studies on free fatty acid signaling were performed in adipose tissue, we also applied hAMSCs for comparison. Extensive lipid droplet formation at day 14 proved that these cells were also differentiated into adipocytes (Supplementary Fig. S1C).
FIG. 1.
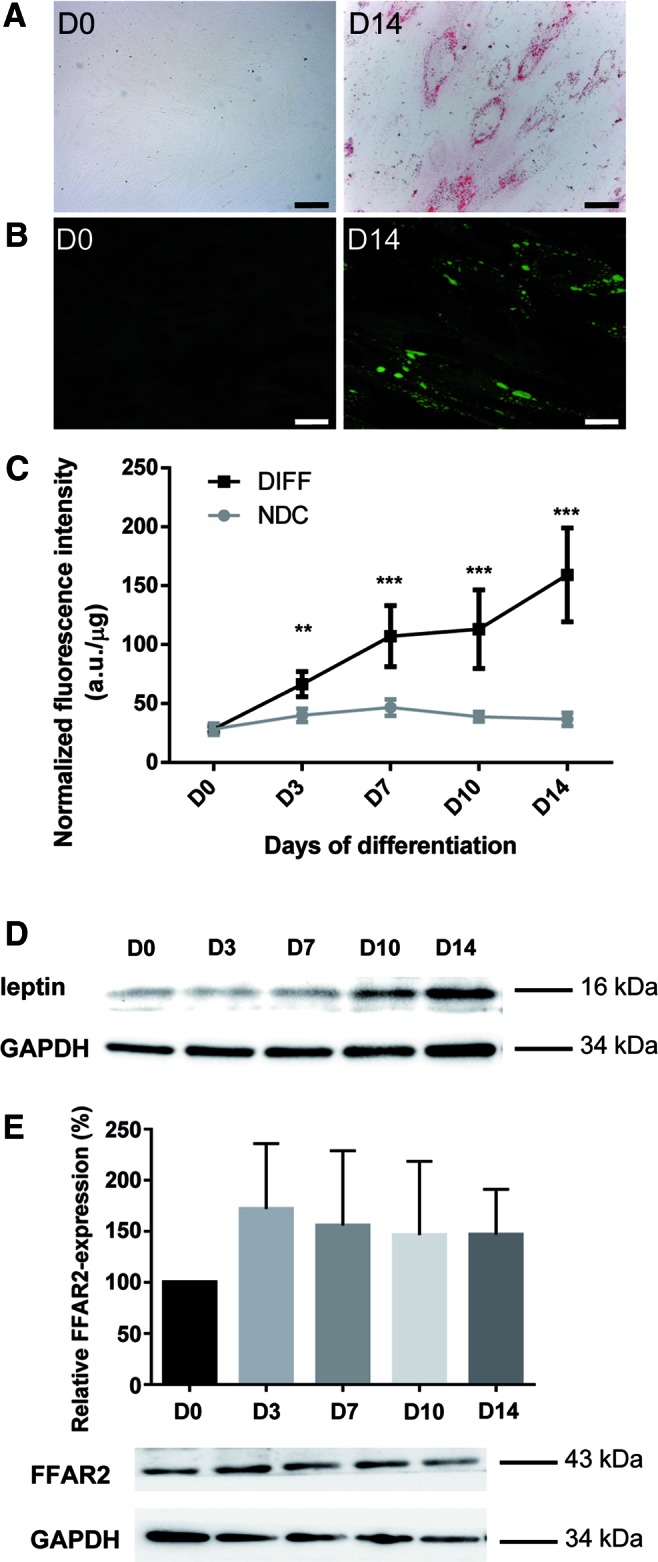
Chorion-derived MSCs differentiate to adipocytes. Neutral lipid accumulation was detected by (A) Oil Red O (red color) or (B) Nile Red (green fluorescence) staining in cMSCs from four different donors of placenta at the beginning (D0) and at the end (D14) of the 14-day long adipogenic differentiation protocol. Representative pictures of four independent experiments are shown (scale bar = 50 μm). The time course of cMSC differentiation (DIFF) into adipocytes was followed by measuring the fluorescence intensity of the Nile Red stained cells from four different donors in five independent experiments (C). Data were normalized to the protein mass of the samples and are given in a.u./μg. Normalized intensities were compared to the nondifferentiated control samples (NDC) by one-way ANOVA with Dunnett's multiple comparison test as a pos hoc test (n = 4, **P < 0.01, ***P < 0.001). The protein levels of leptin and FFAR2 were detected at days 0, 3, 7, 10, and 14 of adipogenic differentiation (D0, D3, D7, D10, D14) in cMSCs from two different donors by western blot analysis with Ob(leptin) and FFAR2-specific antibodies, respectively (D, E). GAPDH was used as an internal control. Following the densitometry of the stained bands FFAR2 data were normalized to GAPDH, and were plotted as percentage of the initial (D0) levels (E) (one-way ANOVA with Dunnett's and Tukey multiple comparison post hoc tests, n = 2). ANOVA, analysis of variance; a.u., arbitrary unit; cMSCs, chorion-derived mesenchymal stem cells; FFAR, free fatty acid receptor; MSCs, mesenchymal stem cells. Color images available online at www.liebertpub.com/scd
FIG. 3.

Propionate and the FFAR2 agonist phenylacetamide suppress cMSC adipogenic differentiation. Relative cell viability of nondifferentiated, differentiated (DIFF), and differentiated cMSCs either in the presence of propionate (PROP, 3.3 × 10⁻³ M) or phenylacetamide (FFAR2 agonist 3.7 × 10⁻⁶ M) was determined by MTT assay at the end of the 14 days differentiation protocol (A). Relative viability assay was performed on cMSCs originated from three donors with five parallels (one-way ANOVA with Dunnett's multiple comparison post hoc test, n = 3, *P < 0.05). Neutral lipid accumulation was detected by Oil Red O staining on differentiating cMSCs from two donors at day 3, 7, 10, and 14 of differentiation without additions (DIFF), or upon 3.3 × 10⁻³ M propionate (PROP) and 3.7 × 10⁻⁶ M FFAR2 agonist treatment (FFAR2 agonist). Representative pictures of two independent experiments are shown (B). Lipid droplets were measured based on the fluorescence intensity of the Nile Red stained cells at day 0, 3, 7, 10, and 14 of differentiation (D0, D3, D7, D10, D14) upon 3.3 × 10⁻³ M propionate (PROP) and 3.7 × 10⁻⁶ M FFAR2 agonist treatment (FFAR2 agonist) and were compared to the differentiated group without any treatment (DIFF). Experiments were done on cMSCs from four donors with eight parallels. Fluorescence data were normalized to the protein mass of the sample and compared to the differentiated samples (two-way ANOVA with Dunnett's multiple comparison post hoc test, n = 4, ***P < 0.001) (C). Western blot analysis of PPARγ- and FFAR2 expression was conducted at days 0, 3, 7, 10, and 14 of adipogenic differentiation in nontreated differentiated cMSCs (DIFF) or upon 3.3 × 10⁻³ M propionate (PROP) and 3.7 × 10⁻⁶ M FFAR2 agonist treatments (FFAR2 agonist) (D). Two independent experiments were performed from one donor for PPARγ and two different donors were used for FFAR2. GAPDH was used as an internal control. The results of a representative experiment are shown in the panel. PPARγ, peroxisome proliferator-activated receptor-γ. Color images available online at www.liebertpub.com/scd
The expression of FFAR2 receptor in cMSCs
FFAR2 is known to be activated upon binding propionate that appears to be the most potent agonist for the receptor [17]. To reveal the possible target of our treatments, the FFAR2 protein levels were examined throughout the 14-day long cMSC differentiation by western blot analysis. The FFAR2 protein can be detected at any time point of the differentiation period with somewhat lower level at day 0 (Fig. 1E). Receptor expression was more pronounced from day 3 without any significant difference throughout the whole period suggesting that the differentiation itself does not influence the abundance of FFAR2. In comparison, in hAMSCs an increased FFAR2 expression was detected by day 14 relative to the undifferentiated control (Supplementary Fig. S1D). The expression of FFAR3—the other SCFA-binding receptor—was also studied in cMSC by RT-qPCR and in both cMSC and hAMSC by western blot analysis, too. The FFAR3 expression was below detection level in all of the investigated MSCs by any of the applied methods (Supplementary Fig. S1E and western blots not shown) suggesting that FFAR2 is the major receptor of SCFAs in these cell lines.
cMSC adipogenic differentiation is suppressed by propionate and by an FFAR2 agonist
The short-chain fatty acids acetate and propionate—the endogenous ligands for FFAR2 and FFAR3—have been reported to stimulate adipogenesis through FFAR2 but not through FFAR3 in mouse 3T3-L1 cells [33]. To reveal the role of the FFAR2 receptor in human cMSCs, lipid accumulation was determined at day 14 of differentiation in the presence of increasing concentrations of acetate, propionate, or phenylacetamide, a synthetic FFAR2 agonist (Fig. 2). After 14 days of differentiation, there was no significant effect of acetate on the lipid content of the differentiated cMSCs as compared to the differentiated untreated group (Fig. 2A). In contrast, propionate and the FFAR2 agonist significantly reduced the fluorescence intensity in a concentration-dependent manner. The suppression of lipid accumulation in differentiating cMSCs was 31% at 3.3 × 10⁻³ M propionate and 61% at 3.7 × 10⁻⁶ M FFAR2 agonist (Fig. 2B, C). Interestingly, the effects of acetate and propionate on adipogenesis were different and propionate showed a similar effect to the highly specific FFAR2 agonist. To confirm our initial observations we used 3.3 × 10⁻³ M propionate and 3.7 × 10⁻⁶ M FFAR2 agonist in our next experiments, while the acetate effect was not pursued further on.
FIG. 2.

Effects of SCFAs acetate and propionate and an FFAR2 agonist on cMSC adipogenesis. Lipid accumulation was determined by measuring the fluorescence intensity of the Nile Red stained cells from three different donors with five parallels at day 14 of differentiation in the absence (DIFF) or presence of increasing concentrations of the FFAR2 ligands acetate (A) and propionate (B) and FFAR2 agonist phenylacetamide (C). Representative results of three independent experiments are shown. Data were normalized to the protein mass of the samples and the normalized fluorescence intensities were compared to the differentiated controls (DIFF) by one-way ANOVA with Dunnett's multiple comparison test as a pos hoc test (n = 3, **P < 0.01, ***P < 0.001). SCFAs, short chain fatty acids.
First we tested whether propionate or the FFAR2 agonist had any effect on the number of viable cMSCs (Fig. 3A). MTT assays revealed that during differentiation the relative viability of the cells decreased to 50.25%, 39.53%, and 54.03% without additions and in the presence of propionate or FFAR2 agonist, respectively, as compared to the nondifferentiated control cell cultures (Fig. 3A). Nevertheless, there was no significant difference between the differentiated control and FFAR2 agonist treated groups, and only a slight change was measured in the case of the propionate treated group (P < 0.05) suggesting that cell loss was a consequence of the differentiation process rather than the treatments. All of the differentiated groups differed significantly (P < 0.001) from the nondifferentiated controls.
To study the effects of propionate or FFAR2 agonist treatments on the 2-week long cMSC adipogenesis, lipid accumulation was visualized by ORO (Fig. 3B) or quantified by Nile Red (Fig. 3C) stainings on every third day of the 14-day long procedure. Lipid-producing cells were detected as early as day 3 of differentiation and a significant reduction in staining intensity was also observed in both of the treated groups from day 7 as compared to the differentiated controls. These effects became more pronounced as the differentiation proceeded and by days 10 and 14 markedly less lipids accumulated in the propionate treated (44.47% and 42.19% decrease, respectively; P < 0,001) or FFAR2 agonist treated cells (42.99% and 50.16% decrease, respectively; P < 0.001; Fig. 3C). Overall, these results confirm that propionate and FFAR2 agonist suppress adipogenesis in cMSCs.
As previously we found that cMSCs express PPARγ (Fig. 3D) and FFAR2 proteins (Figs. 1E and 3D) throughout adipogenic differentiation we investigated the effect of propionate and FFAR2 agonist treatment on the expression of these two markers. Our western blot results showed significantly lower levels of PPARγ upon both treatments at days 10 and 14 compared to their nontreated differentiated counterparts (Fig. 3D) in correlation with the pronounced reduction in lipid accumulation (Fig. 3B, C). These data suggest a negative regulatory role of propionate and FFAR2 agonist on adipogenesis. We found no significant changes in FFAR2 protein level upon propionate treatment while FFAR2 agonist resulted in a slight decrease of the FFAR2 expression in the second half of the adipogenic differentiation procedure (Fig. 3D).
FFAR2 receptor is the mediator of the propionate action in cMSC
Since the FFAR2 receptor for propionate was found to be expressed in cMSCs and it has been demonstrated to be involved in adipogenesis, we aimed to unravel its role in the signaling pathway responsible for SCFA action. FFAR2 gene expression was downregulated by lentiviral transduction particles in cMSCs and the effect of silencing was examined on the process of adipogenesis. The efficiency of the shRNA based silencing was demonstrated at day 14 of differentiation by western blot analysis that revealed a ∼92% reduction in the FFAR2 protein level in contrast to the control nt shRNA transduction that had no effect on FFAR2 (Fig. 4A). To determine whether the reduction of FFAR2 protein level influences lipid accumulation during adipogenesis, we examined the lipid contents after propionate or the highly specific FFAR2 agonist treatments. First, the lipid accumulation of cMSCs transduced with empty TRC pLKO.1 (no shRNA) and TRC2 pLKO.5-puro nontarget shRNA control transduction particles (nt shRNA) was determined. We found 39.1% and 21.4% (P < 0.01) decrease in lipid content at the beginning (day 0) and 31.2% and 32.7% decrease (P < 0.01 and P < 0.001) at the end (day 14) of differentiation, respectively, relative to the nontreated controls (Supplementary Fig. S2). Our control experiments suggest that the lentiviral infection alone had a significant effect on adipogenic differentiation. However, as there was no difference between the effects of no shRNA and nt shRNA transductions on lipid accumulation at any time of differentiation, we deemed it appropriate to use nt shRNA as a proper control for the quantitative evaluation of the effect of FFAR2-silencing on cMSCs. Our results show that FFAR2 agonist treatment significantly decreased the lipid accumulation at day 14 of differentiation in the nt shRNA treated group (22.27% decrease, P < 0.05) compared to their differentiated counterparts (Fig. 4B). On the other hand, after FFAR2 silencing upon the same treatment the lipid droplet formation showed no significant change relative to the FFAR2 silenced, differentiated group (Fig. 4B). These data suggest that the FFAR2 receptor exerts inhibitory effects on adipogenesis and the endogenous or pharmacological ligands, propionate and synthetic phenylacetamide FFAR2 agonist, may reduce triglyceride formation acting through the FFAR2 receptor Nevertheless, MTT assay revealed that the relative cell viability decreased to 66.9% (P < 0.001) in the FFAR2 silenced group compared to the nontarget shRNA treated, nondifferentiated groups suggesting a possible role of FFAR2 receptor in cell survival (Fig. 4C). Shi et al. described that the overexpression of FFAR2 in HEK283T cells induced apoptosis through ERK signaling [22]. Therefore, the presence of the proapoptotic cleaved poly-(ADP-ribose) polymerase (cPARP) protein and the activation of ERK signaling were determined in control, nontarget control, and FFAR2-silenced cMSC at day 14 of adipogenic differentiation. The absence of cleaved cPARP excludes the activation of apoptosis in any of the samples (Supplementary Fig. S3A). Neither the protein expression level of ERK nor the relative phosphorylation level of ERK (at Thr202/Tyr204) changed (Supplementary Fig. S3B) suggesting that FFAR2 silencing does not trigger ERK-mediated apoptotic signaling in differentiated cMSCs. The relative viability of all the nondifferentiated groups significantly deviated from their differentiated FFAR2 agonist-treated (Fig. 4C) counterparts. Taken together, there were no significant differences in cell viability between the differentiated and FFAR2 agonist treated groups within any of the analyzed subgroups (Fig. 4C) indicating that the effects of silencing cannot be attributed to the changes in cell survival caused by the lentiviral silencing method.
FIG. 4.
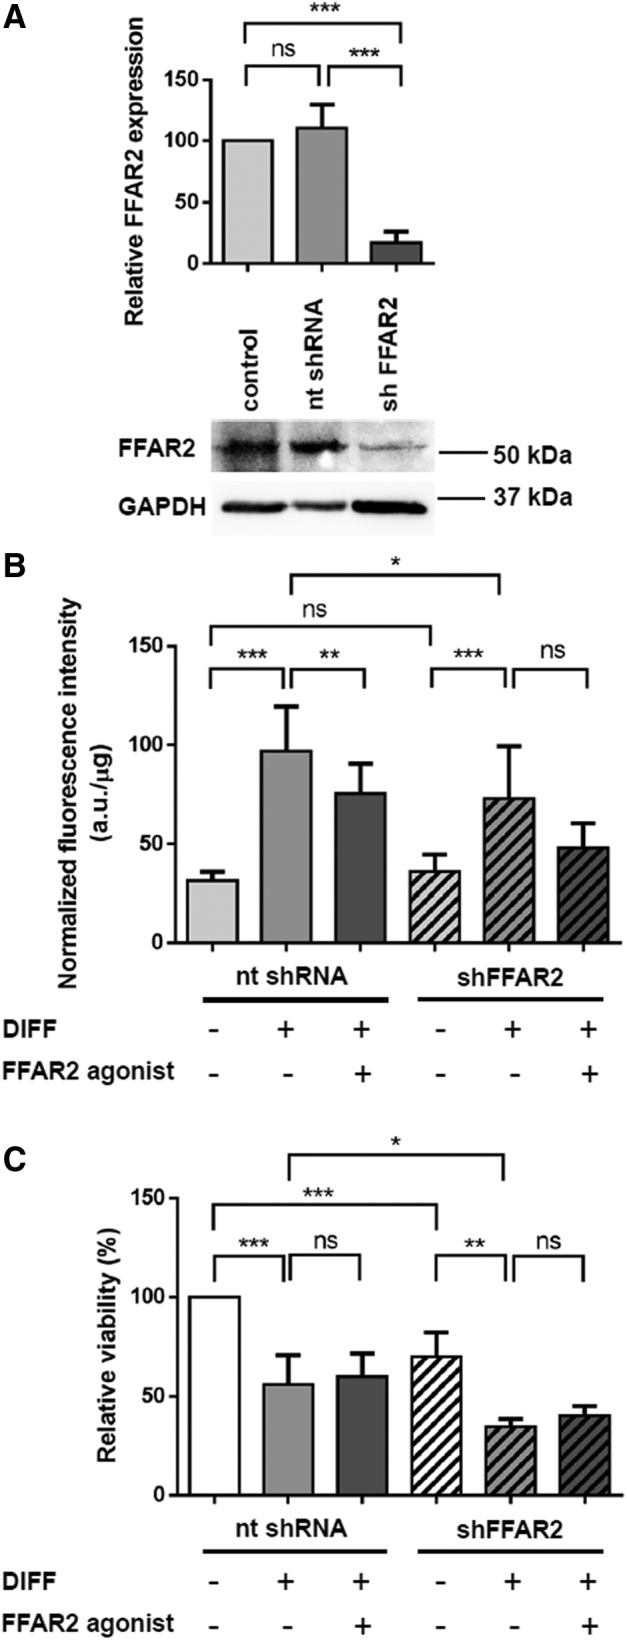
Effect of FFAR2 silencing on the process of adipogenesis in cMSCs. (A) cMSCs were transduced with FFAR2-specific and nontarget control shRNA transduction particles and the efficiency of the silencing was verified at day 14 of differentiation by western blot analysis with two different FFAR2-specific antibodies (Supplementary Table S1). Two independent experiments were performed with cMSCs from two donors. The lower panel shows one representative result obtained with Anti-FFAR2/GPR43 antibody. GAPDH was used as an internal control. Protein levels of FFAR2 were normalized to the intensity of GAPDH and were calculated for ctr: not transduced control, nt shRNA: nontarget shRNA, shFFAR2: shFFAR2-silenced samples and were analyzed by the Student t-test (n = 4, ***P < 0.001). (B) Lipid accumulation of FFAR2 silenced (shFFAR2) cMSCs was determined by measuring the fluorescence intensity of the Nile Red stained cells at day 14 of differentiation (DIFF) upon FFAR2 agonist treatment and was compared to the nontarget control (nt shRNA). Fluorescence data were normalized to the protein mass of the samples and are given in a.u./μg. Normalized intensities were analyzed by one-way ANOVA with Tukey's multiple comparison post hoc statistical test (n = 2, *P < 0.05, **P < 0.01, ***P < 0.001, ns). (C) Relative cell viability was measured by MTT assay at the end of the 14 days differentiation protocol upon FFAR2 agonist treatment in nontarget control and FFAR2 silenced cMSCs originated from one donor. Two independent experiments were performed with three parallels (one-way ANOVA with Tukey's multiple comparison post hoc test, n = 2, **P < 0.01, ***P < 0.001). GPR43, G-protein-coupled receptor 43; n.s., not significant change; shRNA, small hairpin RNA.
Discussion
Acetate and propionate were previously shown to stimulate fat accumulation in mice 3T3-L1-derived adipocytes [33]. However, no relationship between FFAR2 and adipocyte differentiation has been found in human adipose tissue-derived stromal vascular cells [28]. In contrast with these observations, here we report that propionate and FFAR2 agonist suppress the adipogenesis in human chorion-derived MSCs through the FFAR2 receptor. To answer the question whether FFAR2 is involved in human adipogenesis, we used cMSCs as a model system. These cells exhibit the same morphological features as adipose-derived MSCs with similar self-renewal and differentiation capacity and on the other hand the placenta can be easily obtained at the end of gestation without any invasive intervention [7,9]. In our experiments, both the chorion- and adipose-derived MSCs lost their fibroblastic morphology and accumulated cytoplasmic triglyceride during the 14-day long differentiation proving their capability to differentiate into adipocytes. PPARγ [34] and leptin [35] are established markers for adipogenic differentiation of hAMSC. The fact that an increase was detected in their expression during the course of the differentiation of both cMSC and hAMSC justifies the application of adipogenic differentiated cMSC as a valid model for the investigation of SCFA signaling.
FFAR2 was reported to be highly expressed in mouse and human adipose tissues but the levels of FFAR2 messenger RNA (mRNA) were much lower or undetectable in the stromal-vascular fraction (SVF), a rich source of MSCs [28,29,33]. Li et al. found that FFAR2 mRNA was not detectable in porcine SVF before or during adipocyte differentiation [36]. Based on our western blot analysis, the short-chain fatty acid receptor FFAR2 is expressed in undifferentiated cMSCs, and its protein level increases and varies slightly without any significant tendency throughout the differentiation period while FFAR3 was not detected at any time point. As Hong et al. [33] previously demonstrated, FFAR2 is implicated in the process of adipogenesis in mice and the short-chain fatty acid acetate and propionate stimulate fat accumulation in 3T3-L1-derived adipocytes mainly through FFAR2. In accordance with this finding, FFAR2-deficient mice is protected from high-fat diet induced obesity and showed higher energy expenditure than their wild-type counterparts [37]. In contrast, Kimura et al. demonstrated that the FFAR2-deficient mice are obese on normal diet and short-chain fatty acid-mediated activation of FFAR2 suppresses insulin signaling in adipocytes, which inhibits fat accumulation in adipose tissue and promotes the metabolism of unincorporated lipids and glucose in other tissues [29]. These discrepancies among the publications may stem from the differences of diet or from the mice strains with different age, gender, or genetic background or may be caused by the different SCFA concentrations used in the experiments. Acetate and propionate concentrations vary in wide ranges from 0.1 μM up to millimolar values in these studies. We found that the effective concentrations of FFAR2 ligands that result in significant change in lipid accumulation of cMSCs are in millimolar concentration for propionate and in micromolar range for the FFAR2 agonist. Total SCFAs are reported to be 100 mM in gut lumen that decreases to 100 μM in peripheral blood, but plasma levels of acetate could increase up to millimolar concentrations after alcohol consumption [5,38]. The propionate levels in human circulation are reported to be between 5 and 88 μM [39] and only a few inherited diseases caused by specific enzyme defect result in the accumulation of higher doses of propionate [40]. In our study, 3 mM acetate failed to affect the fat content in the differentiated cMSCs while the same amount of propionate, which is considerably above the physiological level in the blood, but relevant in the gut lumen, significantly decreased it. The same concentration of butyrate was cytotoxic for the cMSCs (data not shown). The effects of propionate are similar to the FFAR2 agonist, but according to our data acetate and propionate—the physiological ligands of FFAR2—act differently. Our results are not in agreement with published results [33] showing that acetate and propionate stimulate fat accumulation in 3T3-L1-derived adipocytes, however, are well in line with a previous study describing distinct effects on 3T3-L1 adipogenesis [41] that suggests the selective sensitivity of stem cells toward SCFAs.
The available information on the role of FFAR2 in human adipogenesis is limited. The data obtained with human adipose tissue-derived stromal-vascular cells treated with 10 μM acetate and propionate suggested the absence of any relationship between FFAR2 and adipocyte differentiation [28]. Nevertheless, we demonstrated in human cMSCs that adipogenic differentiation is suppressed by propionate that acts as an endogenous ligand for FFAR2 and the synthetic FFAR2 agonist phenylacetamide had the same effect. The inhibitory mechanism might be related to an inhibitory G protein (Gi) linked to FFAR2 and upon agonist activation it could result in a decrease in the adipogenic differentiation [29,42]. As the FFAR3 was reported to be expressed neither in human nor in mice adipose tissues or in SVF cells [33], and we found neither the mRNA nor the protein of FFAR3 in cMSC and hAMSC, we assume that these effects were mediated exclusively by FFAR2. Indeed, the action of FFAR2 agonist phenylacetamide activating specifically the FFAR2 receptor was also suppressed by FFAR2 silencing, just as it was the case for propionate treatment. Taken together our results confirm the role of FFAR2 in human adipogenesis.
In conclusion, our results revealed the inhibitory role of FFAR2 in fat accumulation in human cMSCs and its role in the propionate-induced inhibition of adipogenic differentiation. MSCs have been identified in numerous tissues and virtually all of the tissues may contain MSCs in various proportions. The suppression of adipogenesis by the bacterial product short-chain fatty acid propionate could be a possible mechanism of regulating the energy homeostasis and inhibiting the undesirable formation of adipocytes throughout the body. Since FFAR2 is considered to be a key component of the body's nutrient sensing mechanism, targeting these receptors may offer novel therapies for the management of obesity and other metabolic disorders.
Supplementary Material
Acknowledgments
This work was supported by grants from the National Research, Development and Innovation Office (NKFIH PD104878, FK 125043, K108308, GINOP-2.3.2-15-2016-00006, GINOP-2.3.3-15-2016-00021, EFOP-3.6.2-16-2017-00006), by the Hungarian Academy of Sciences, MTA-DE Cell Biology and Signaling Research Group, and by the University of Debrecen (RH/751/2015). The authors are indebted to Mrs. Ágota Kelemenné Szántó, Mrs. Andrea Tankáné Farkas, and Mrs. Andrea Docsa for their technical assistance. We thank Ms. Lilla Nagy and Dr. Tamás Szerafin for providing hAMSCs and Dr. Krisztina Tar (University of Debrecen) and Dr. Marion Schmidt (Albert Einstein College of Yeshira University, Bronx, NY) for the pLKO.1 vector. We thank Dr. Laszlo Virag (University of Debrecen) for providing the hMSCs.
Author Disclosure Statement
No competing financial interests exist.
References
- 1.Jung UJ. and Choi MS. (2014). Obesity and its metabolic complications: the role of adipokines and the relationship between obesity, inflammation, insulin resistance, dyslipidemia and nonalcoholic fatty liver disease. Int J Mol Sci 15:6184–6223 [DOI] [PMC free article] [PubMed] [Google Scholar]
- 2.Tang QQ. and Lane MD. (2012). Adipogenesis: from stem cell to adipocyte. Annu Rev Biochem 81:715–736 [DOI] [PubMed] [Google Scholar]
- 3.Bjorndal B, Burri L, Staalesen V, Skorve J. and Berge RK. (2011). Different adipose depots: their role in the development of metabolic syndrome and mitochondrial response to hypolipidemic agents. J Obes 2011:490650. [DOI] [PMC free article] [PubMed] [Google Scholar]
- 4.Kimura I, Inoue D, Hirano K. and Tsujimoto G. (2014). The SCFA receptor GPR43 and energy metabolism. Front Endocrinol (Lausanne) 5:85. [DOI] [PMC free article] [PubMed] [Google Scholar]
- 5.Kasubuchi M, Hasegawa S, Hiramatsu T, Ichimura A. and Kimura I. (2015). Dietary gut microbial metabolites, short-chain fatty acids, and host metabolic regulation. Nutrients 7:2839–2849 [DOI] [PMC free article] [PubMed] [Google Scholar]
- 6.Igura K, Zhang X, Takahashi K, Mitsuru A, Yamaguchi S. and Takashi TA. (2004). Isolation and characterization of mesenchymal progenitor cells from chorionic villi of human placenta. Cytotherapy 6:543–553 [DOI] [PubMed] [Google Scholar]
- 7.Antoniadou E. and David AL. (2016). Placental stem cells. Best Pract Res Clin Obstet Gynaecol 31:13–29 [DOI] [PubMed] [Google Scholar]
- 8.Kim MJ, Shin KS, Jeon JH, Lee DR, Shim SH, Kim JK, Cha DH, Yoon TK. and Kim GJ. (2011). Human chorionic-plate-derived mesenchymal stem cells and Wharton's jelly-derived mesenchymal stem cells: a comparative analysis of their potential as placenta-derived stem cells. Cell Tissue Res 346:53–64 [DOI] [PubMed] [Google Scholar]
- 9.Dai R, Wang Z, Samanipour R, Koo KI. and Kim K. (2016). Adipose-derived stem cells for tissue engineering and regenerative medicine applications. Stem Cells Int 2016:6737345. [DOI] [PMC free article] [PubMed] [Google Scholar]
- 10.Maria AT, Maumus M, Le Quellec A, Jorgensen C, Noel D. and Guilpain P. (2016). Adipose-derived mesenchymal stem cells in autoimmune disorders: state of the art and perspectives for systemic sclerosis. Clin Rev Allergy Immunol 52:234–259 [DOI] [PubMed] [Google Scholar]
- 11.Gregory CA, Prockop DJ. and Spees JL. (2005). Non-hematopoietic bone marrow stem cells: molecular control of expansion and differentiation. Exp Cell Res 306:330–335 [DOI] [PubMed] [Google Scholar]
- 12.Saleh M, Shamsasanjan K, Movassaghpourakbari A, Akbarzadehlaleh P. and Molaeipour Z. (2015). The impact of mesenchymal stem cells on differentiation of hematopoietic stem cells. Adv Pharm Bull 5:299–304 [DOI] [PMC free article] [PubMed] [Google Scholar]
- 13.Romanov YA, Balashova EE, Volgina NE, Kabaeva NV, Dugina TN. and Sukhikh GT. (2016). Isolation of multipotent mesenchymal stromal cells from cryopreserved human umbilical cord tissue. Bull Exp Biol Med 160:530–534 [DOI] [PubMed] [Google Scholar]
- 14.Hu C, Cao H, Pan X, Li J, He J, Pan Q, Xin J, Yu X, Li J, et al. (2016). Adipogenic placenta-derived mesenchymal stem cells are not lineage restricted by withdrawing extrinsic factors: developing a novel visual angle in stem cell biology. Cell Death Dis 7(3):e2141. [DOI] [PMC free article] [PubMed] [Google Scholar]
- 15.Ichimura A, Hasegawa S, Kasubuchi M. and Kimura I. (2014). Free fatty acid receptors as therapeutic targets for the treatment of diabetes. Front Pharmacol 5:236. [DOI] [PMC free article] [PubMed] [Google Scholar]
- 16.Layden BT, Angueira AR, Brodsky M, Durai and V.Lowe WL., Jr. (2013). Short chain fatty acids and their receptors: new metabolic targets. Transl Res 161:131–140 [DOI] [PubMed] [Google Scholar]
- 17.Le Poul E, Loison C, Struyf S, Springael JY, Lannoy V, Decobecq ME, Brezillon S, Dupriez V, Vassart G, et al. (2003). Functional characterization of human receptors for short chain fatty acids and their role in polymorphonuclear cell activation. J Biol Chem 278:25481–25489 [DOI] [PubMed] [Google Scholar]
- 18.Brown AJ, Goldsworthy SM, Barnes AA, Eilert MM, Tcheang L, Daniels D, Muir AI, Wigglesworth MJ, Kinghorn I, et al. (2003). The orphan G protein-coupled receptors GPR41 and GPR43 are activated by propionate and other short chain carboxylic acids. J Biol Chem 278:11312–11319 [DOI] [PubMed] [Google Scholar]
- 19.McNelis JC, Lee YS, Mayoral R, van der Kant R, Johnson AM, Wollam J. and Olefsky JM. (2015). GPR43 potentiates beta-cell function in obesity. Diabetes 64:3203–3217 [DOI] [PMC free article] [PubMed] [Google Scholar]
- 20.Priyadarshini M. and Layden BT. (2015). FFAR3 modulates insulin secretion and global gene expression in mouse islets. Islets 7:e1045182. [DOI] [PMC free article] [PubMed] [Google Scholar]
- 21.Pivovarova O, Hornemann S, Weimer S, Lu Y, Murahovschi V, Zhuk S, Seltmann AC, Malashicheva A, Kostareva A, et al. (2015). Regulation of nutrition-associated receptors in blood monocytes of normal weight and obese humans. Peptides 65:12–19 [DOI] [PubMed] [Google Scholar]
- 22.Shi G, Sun C, Gu W, Yang M, Zhang X, Zhai N, Lu Y, Zhang Z, Shou P, Zhang Z. and Ning G. (2014). Free fatty acid receptor 2, a candidate target for type 1 diabetes, induces cell apoptosis through ERK signaling. J Mol Endocrinol 53:367–380 [DOI] [PubMed] [Google Scholar]
- 23.Sina C, Gavrilova O, Forster M, Till A, Derer S, Hildebrand F, Raabe B, Chalaris A, Scheller J, et al. (2009). G protein-coupled receptor 43 is essential for neutrophil recruitment during intestinal inflammation. J Immunol 183:7514–7522 [DOI] [PubMed] [Google Scholar]
- 24.Zhao M, Zhu W, Gong J, Zuo L, Zhao J, Sun J, Li N. and Li J. (2015). Dietary fiber intake is associated with increased colonic mucosal GPR43+ polymorphonuclear infiltration in active Crohn's disease. Nutrients 7:5327–5346 [DOI] [PMC free article] [PubMed] [Google Scholar]
- 25.Tolhurst G, Heffron H, Lam YS, Parker HE, Habib AM, Diakogiannaki E, Cameron J, Grosse J, Reimann F. and Gribble FM. (2012). Short-chain fatty acids stimulate glucagon-like peptide-1 secretion via the G-protein-coupled receptor FFAR2. Diabetes 61:364–371 [DOI] [PMC free article] [PubMed] [Google Scholar]
- 26.Nohr MK, Egerod KL, Christiansen SH, Gille A, Offermanns S, Schwartz TW. and Moller M. (2015). Expression of the short chain fatty acid receptor GPR41/FFAR3 in autonomic and somatic sensory ganglia. Neuroscience 290:126–137 [DOI] [PubMed] [Google Scholar]
- 27.Won YJ, Lu VB, Puhl HL, 3rd and Ikeda SR. (2013). beta-Hydroxybutyrate modulates N-type calcium channels in rat sympathetic neurons by acting as an agonist for the G-protein-coupled receptor FFA3. J Neurosci 33:19314–19325 [DOI] [PMC free article] [PubMed] [Google Scholar]
- 28.Dewulf EM, Ge Q, Bindels LB, Sohet FM, Cani PD, Brichard SM. and Delzenne NM. (2013). Evaluation of the relationship between GPR43 and adiposity in human. Nutr Metab (Lond) 10:11. [DOI] [PMC free article] [PubMed] [Google Scholar]
- 29.Kimura I, Ozawa K, Inoue D, Imamura T, Kimura K, Maeda T, Terasawa K, Kashihara D, Hirano K, et al. (2013). The gut microbiota suppresses insulin-mediated fat accumulation via the short-chain fatty acid receptor GPR43. Nat Commun 4:1829. [DOI] [PMC free article] [PubMed] [Google Scholar]
- 30.Robaszkiewicz A, Erdelyi K, Kovacs K, Kovacs I, Bai P, Rajnavolgyi E. and Virag L. (2012). Hydrogen peroxide-induced poly(ADP-ribosyl)ation regulates osteogenic differentiation-associated cell death. Free Radic Biol Med 53:1552–1564 [DOI] [PubMed] [Google Scholar]
- 31.Abdul-Rahman O, Kristof E, Doan-Xuan QM, Vida A, Nagy L, Horvath A, Simon J, Maros T, Szentkiralyi I, et al. (2016). AMP-activated kinase (AMPK) activation by AICAR in human white adipocytes derived from pericardial white adipose tissue stem cells induces a partial beige-like phenotype. PLoS One 11:e0157644. [DOI] [PMC free article] [PubMed] [Google Scholar]
- 32.Lontay B, Kiss A, Gergely P, Hartshorne DJ. and Erdodi F. (2005). Okadaic acid induces phosphorylation and translocation of myosin phosphatase target subunit 1 influencing myosin phosphorylation, stress fiber assembly and cell migration in HepG2 cells. Cell Signal 17:1265–1275 [DOI] [PubMed] [Google Scholar]
- 33.Hong YH, Nishimura Y, Hishikawa D, Tsuzuki H, Miyahara H, Gotoh C, Choi KC, Feng DD, Chen C, et al. (2005). Acetate and propionate short chain fatty acids stimulate adipogenesis via GPCR43. Endocrinology 146:5092–5099 [DOI] [PubMed] [Google Scholar]
- 34.Ambele MA, Dessels C, Durandt C. and Pepper MS. (2016). Genome-wide analysis of gene expression during adipogenesis in human adipose-derived stromal cells reveals novel patterns of gene expression during adipocyte differentiation. Stem Cell Res 16:725–734 [DOI] [PubMed] [Google Scholar]
- 35.Kollmer M, Buhrman JS, Zhang Y. and Gemeinhart RA. (2013). Markers Are shared between adipogenic and osteogenic differentiated mesenchymal stem cells. J Dev Biol Tissue Eng 5:18–25 [DOI] [PMC free article] [PubMed] [Google Scholar]
- 36.Li G, Yao W. and Jiang H. (2014). Short-chain fatty acids enhance adipocyte differentiation in the stromal vascular fraction of porcine adipose tissue. J Nutr 144:1887–1895 [DOI] [PubMed] [Google Scholar]
- 37.Bjursell M, Admyre T, Goransson M, Marley AE, Smith DM, Oscarsson J. and Bohlooly YM. (2011). Improved glucose control and reduced body fat mass in free fatty acid receptor 2-deficient mice fed a high-fat diet. Am J Physiol Endocrinol Metab 300:E211–E220 [DOI] [PubMed] [Google Scholar]
- 38.Ge H, Li X, Weiszmann J, Wang P, Baribault H, Chen JL, Tian H. and Li Y. (2008). Activation of G protein-coupled receptor 43 in adipocytes leads to inhibition of lipolysis and suppression of plasma free fatty acids. Endocrinology 149:4519–4526 [DOI] [PubMed] [Google Scholar]
- 39.Cummings JH, Pomare EW, Branch WJ, Naylor CP. and Macfarlane GT. (1987). Short chain fatty acids in human large intestine, portal, hepatic and venous blood. Gut 28:1221–1227 [DOI] [PMC free article] [PubMed] [Google Scholar]
- 40.Baumgartner MR, Horster F, Dionisi-Vici C, Haliloglu G, Karall D, Chapman KA, Huemer M, Hochuli M, Assoun M, et al. (2014). Proposed guidelines for the diagnosis and management of methylmalonic and propionic acidemia. Orphanet J Rare Dis 9:130. [DOI] [PMC free article] [PubMed] [Google Scholar]
- 41.Alex S, Lange K, Amolo T, Grinstead JS, Haakonsson AK, Szalowska E, Koppen A, Mudde K, Haenen D, et al. (2013). Short-chain fatty acids stimulate angiopoietin-like 4 synthesis in human colon adenocarcinoma cells by activating peroxisome proliferator-activated receptor gamma. Mol Cell Biol 33:1303–1316 [DOI] [PMC free article] [PubMed] [Google Scholar]
- 42.Bindels LB, Dewulf EM. and Delzenne NM. (2013). GPR43/FFA2: physiopathological relevance and therapeutic prospects. Trends Pharmacol Sci 34:226–232 [DOI] [PubMed] [Google Scholar]
Associated Data
This section collects any data citations, data availability statements, or supplementary materials included in this article.