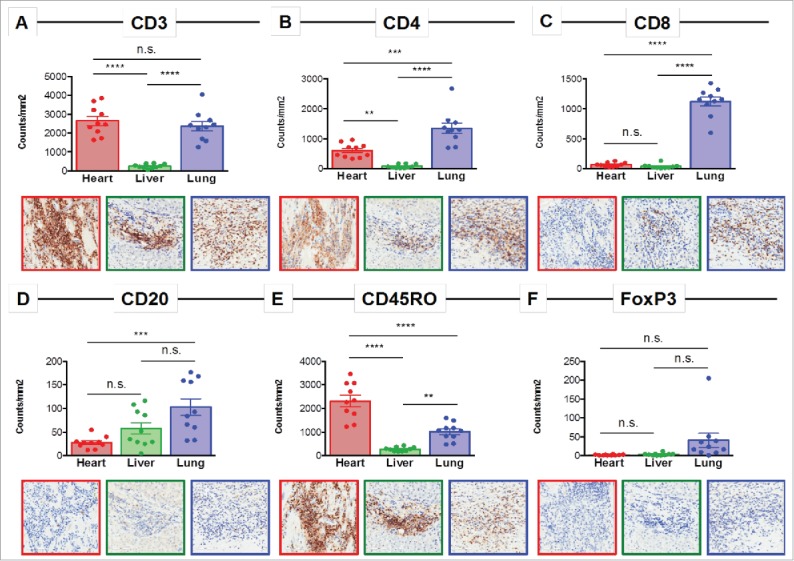
Figure 2.

Immune profiling of the inflamed heart reveals a CD4-dominated T cell infiltrate. Representative immunohistochemistry images and quantification of 10 regions for (A) CD3, (B) CD4, (C) CD8, (D) CD20, (E) CD45RO, and (F) FoxP3 in the heart, liver, and lung. n.s. = not significant; ** = p < 0.01; *** = p < 0.001; **** = p < 0.0001.
