Abstract
Cancer cells exploit the expression of the programmed death-1 (PD-1) ligand 1 (PD-L1) to subvert T-cell mediated immunosurveillance1,2. The success of therapies that disrupt PD-L1 mediated tumour tolerance has highlighted the need to understand the molecular regulation of PD-L1 expression1. Using a genome-wide CRISPR/Cas9 screen we identified the uncharacterized protein CMTM6 to be a critical regulator of PD-L1 in a broad range of cancer cells. CMTM6 is a ubiquitously expressed, protein that binds PD-L1 and maintains its cell surface expression. CMTM6 is not required for PD-L1 maturation but co-localizes with PD-L1 at the plasma membrane and in recycling endosomes where it prevents PD-L1 from being targeted for lysosome-mediated degradation. Using a quantitative approach to profile the entire plasma membrane proteome we find that CMTM6 displays remarkable specificity for PD-L1. Importantly, CMTM6 depletion decreases PD-L1 without compromising cell surface expression of MHC Class I. CMTM6 depletion, via the reduction of PD-L1, significantly alleviates the suppression of tumour specific T-cell activity in vitro and in vivo. These findings provide novel insights into the biology of PD-L1 regulation, identify a previously unrecognised master regulator of this critical immune checkpoint and highlight a new potential therapeutic target to overcome immune evasion by tumour cells.
The interaction between PD-1 on T-cells and PD-L1 on tumour cells, inhibits activation, expansion and effector functions of antigen specific CD8+ T cells and helps cancer cells evade immune destruction1,2. PD-L1 expression may be induced in response to inflammatory cytokines such as interferon- γ (IFN-γ) secreted by immune cells within the tumour microenvironment or can be driven by tumour cell intrinsic mechanisms, including amplification of the PD-L1 locus3 and structural variation of the 3’ region of the PD-L1 gene4.
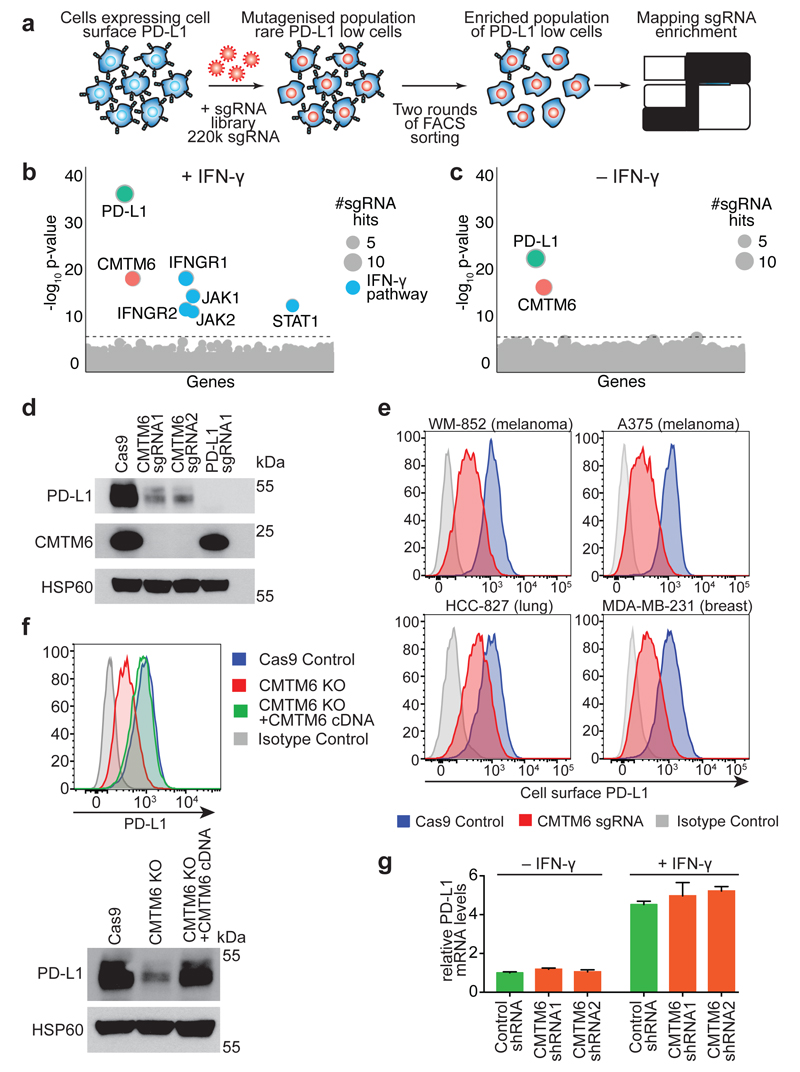
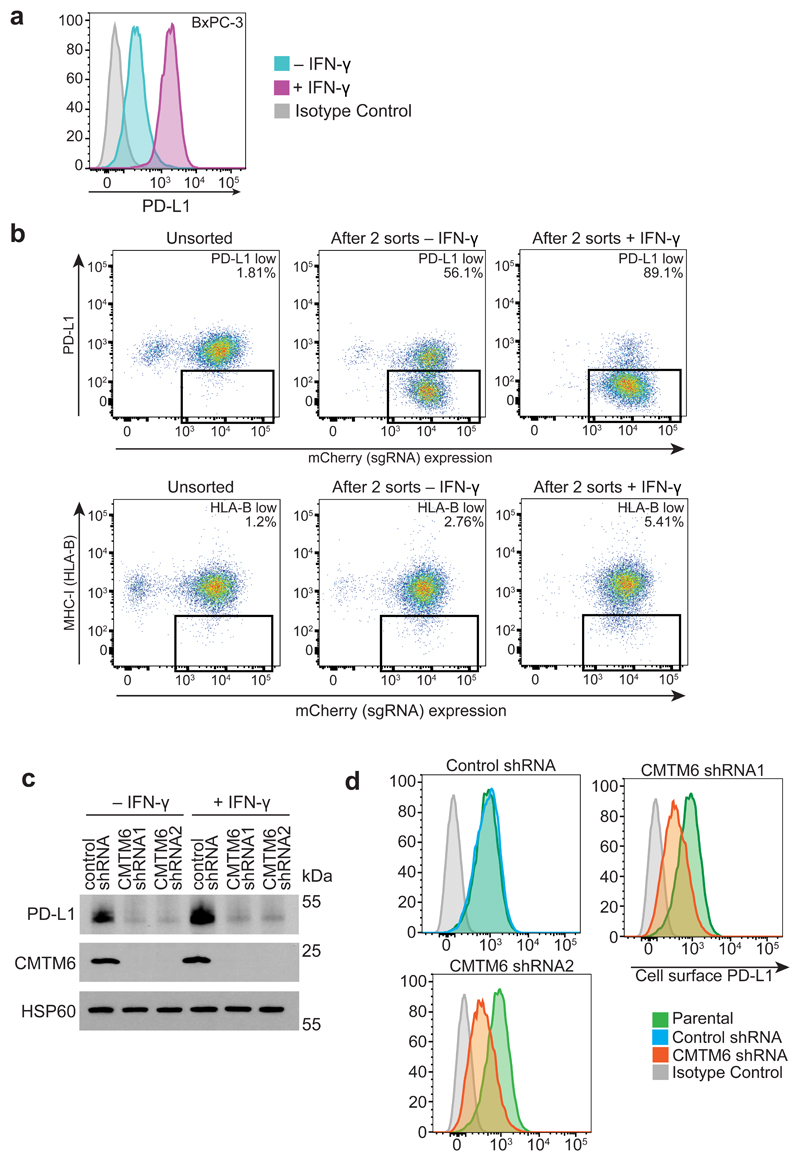
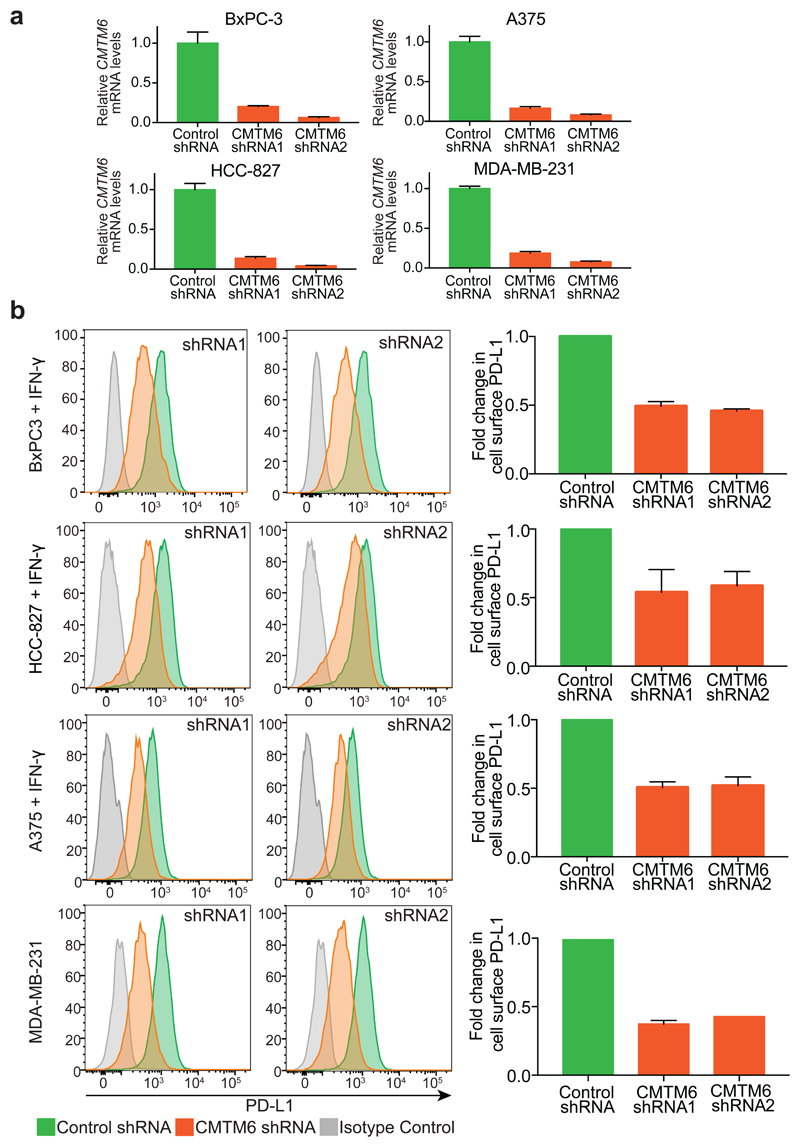
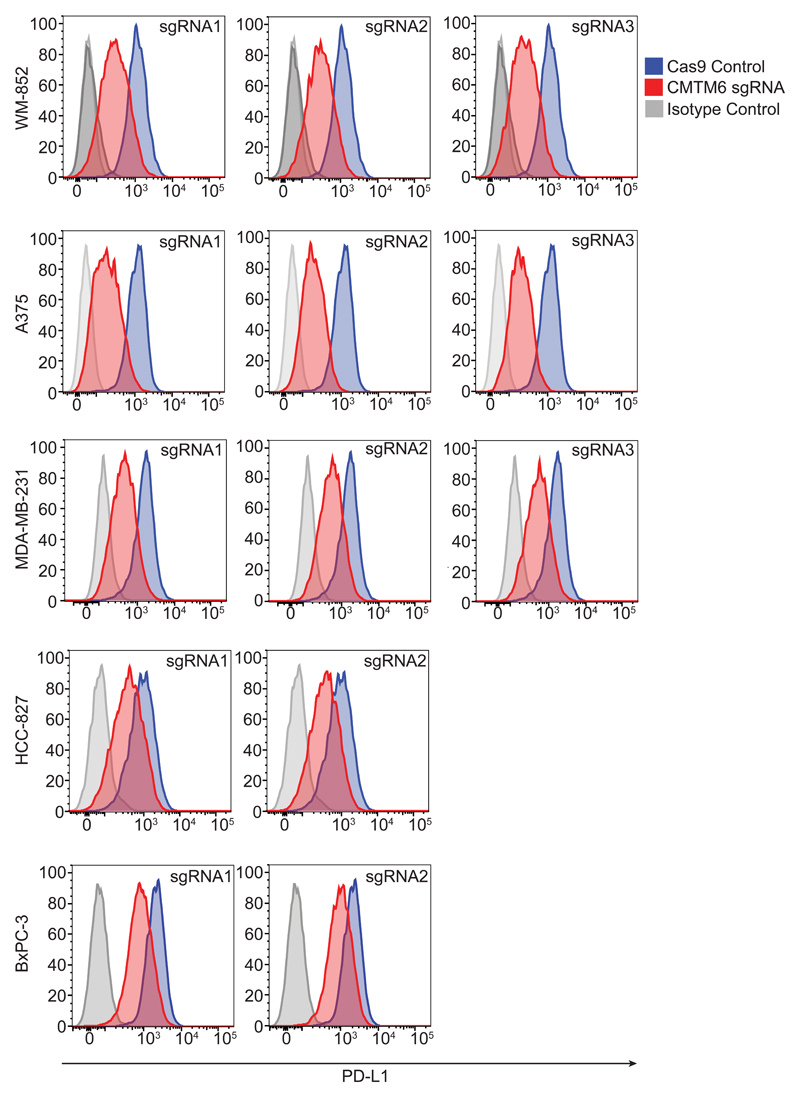
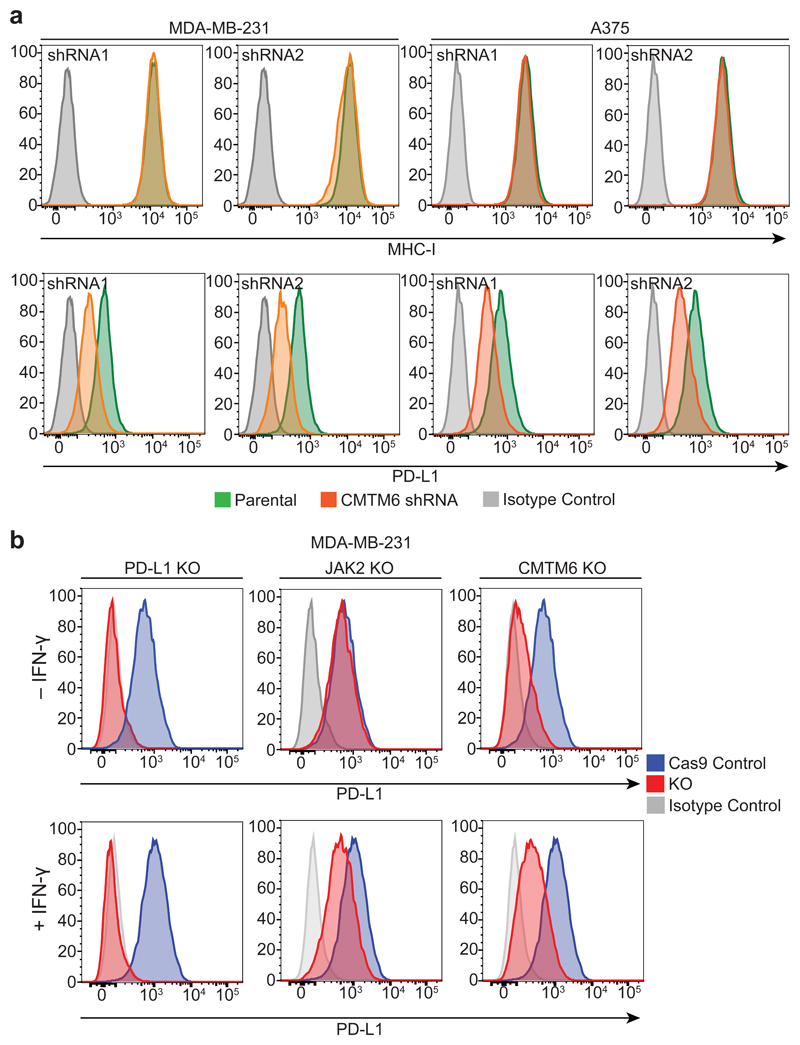
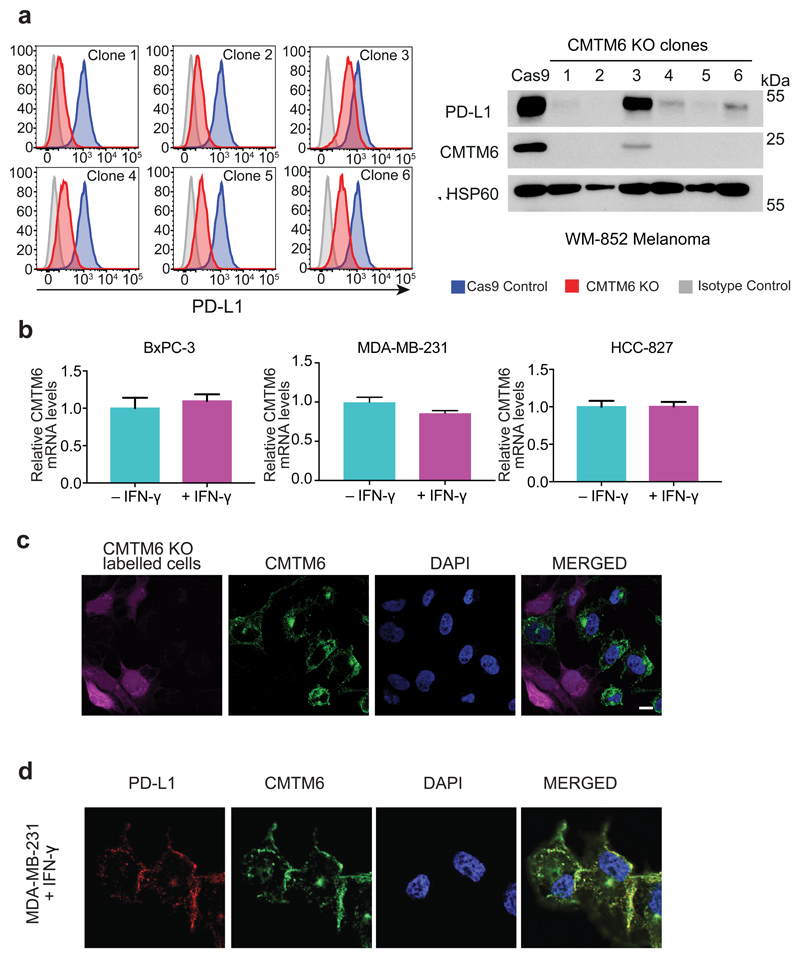
To identify new regulators of both constitutive and induced cell surface PD-L1 expression, we performed a whole genome CRISPR/Cas9 deletion library screen5 in the pancreatic cancer cell line BxPC-3, which displays endogenous PD-L1 that can be further induced with IFN-γ (Figure 1a and Extended Data Fig. 1). Following stimulation with IFN-γ, our screen identified the key components of the IFN-γ pathway as well as CKLF-like MARVEL trans-membrane domain-containing protein 6 (CMTM6) (Figure 1b). In the absence of IFN-γ, CMTM6 was the only identified regulator of PD-L1 expression (Figure 1c). Depletion of CMTM6 using specific sgRNAs or short hairpin RNAs (shRNAs) led to a dramatic reduction in total cellular levels of PD-L1 (Figure 1d and Extended Data Fig. 1c/d). These findings have broad relevance as CMTM6 is a major regulator of PD-L1 expression in cell lines representative of melanoma, breast and lung cancer (Figure 1e and Extended Data Fig. 2&3), diseases that respond to immune checkpoint blockade1,2. Importantly, CMTM6 depletion reduces both constitutive and IFN-γ induced PD-L1 expression without compromising antigen presentation by reducing cell surface MHC class I levels (Extended Data Fig. 4). Exogenous expression of CMTM6 in CMTM6 knockout cells regulates PD-L1 in a dose dependent manner and restores both total and cell surface PD-L1 levels (Figure 1f and Extended Data Fig. 5a). In myeloid lineage cells, CMTM6 depletion specifically downregulates cell surface expression of PD-L1 but not PD-L2 (Extended Data Fig. 6a/b). Interestingly, CMTM6 levels are not influenced by IFN-γ stimulation (Extended Data Fig. 1c, 4b and 5b) and, in contrast to other recently described regulators of PD-L1 expression1,2, CMTM6 does not function as a transcriptional regulator of PD-L1 either in the presence or absence of IFN-γ (Figure 1g).
Figure 1. CMTM6 is a principal regulator of PD-L1 expression in multiple tumour types.
a. A genome-wide CRISPR/Cas9 screen identifies genes essential for cell surface PD-L1 expression. BxPC-3 pancreatic cancer cells expressing Cas9 were mutagenised with a pooled lentiviral sgRNA library and PD-L1 low cells enriched by FACs sorting b&c. Significant hits from screens in cells pre-treated with IFN-γ before sorting (B) and non-IFN-γ treated cells (C). Dotted line indicates Bonferroni-corrected significance threshold. d. Immunoblot in MDA-MB-231 cells expressing Cas9 and sgRNAs targeting either CMTM6 or PD-L1. e. Surface PD-L1 in IFN-γ-treated cells transduced with CMTM6-specific sgRNAs versus parental Cas9 expressing cells. See Extended Data Fig. 3 for full dataset. f. PD-L1 expression in CMTM6 knockout MDA-MB-231 cells ± CMTM6 cDNA analysed by flow cytometry and immunoblot. Representative of 3 experiments. g. qRT-PCR analysis in control and CMTM6-depleted cells treated ± 500IU/ml IFN-γ for 48h. 2 biological replicates (mean, s.e.m.).
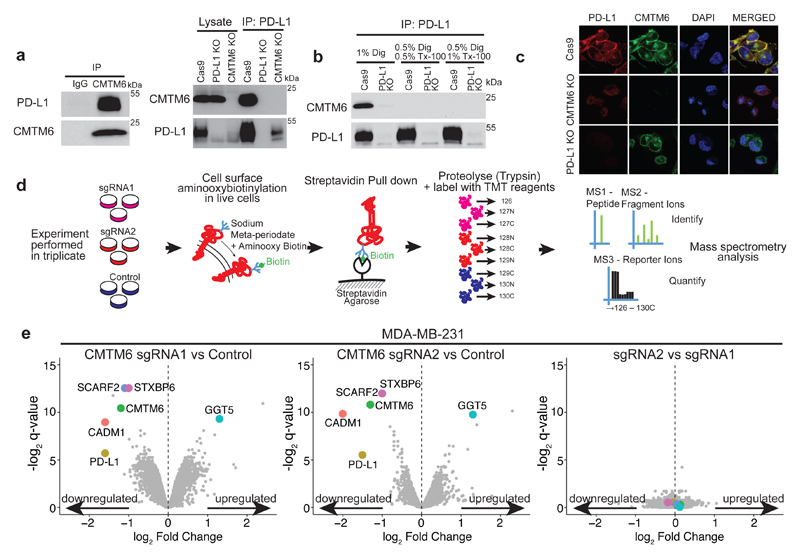
CMTM6 belongs to a family of proteins, primarily encoded by two distinct gene clusters, on chromosome 16 (CMTM1-4) and chromosome 3 (CMTM6-8)6. Whilst largely uncharacterised, CMTM family members contain a MARVEL domain comprising at least three transmembrane helices7. Interestingly, MARVEL domain proteins have been implicated in regulating trafficking of transmembrane and secretory proteins7. To determine whether CMTM6 interacts with PD-L1, we performed reciprocal co-immunoprecipitation experiments using detergent conditions that solubilise the membrane to a variable degree. CMTM6 was readily detected in association with PD-L1; however, this interaction is maintained only under conditions that preserve the integrity of a membrane-associated complex (Figure 2a/b). In agreement with this, CMTM6 co-localises with PD-L1 at the cell surface both in the presence and absence of IFN-γ stimulation (Figure 2c and Extended Data Fig. 5c/d).
Figure 2. CMTM6 shows functional specificity for PD-L1.
a. PD-L1 is readily detected in association with CMTM6. Immunoprecipitation of CMTM6 (left panel) or PD-L1 (right panel) from digitonin lysates of IFN-γ treated MDA-MB-231 cells. Analysis by immunoblot. Lysate = 5% of input. Experiments performed twice. b. Interaction of CMTM6 with PD-L1 is detergent-sensitive. Cells were lysed in 1% digitonin (Dig) and adjusted to the indicated detergent concentrations prior to immunoprecipitation of PD-L1. Experiment performed twice. c. PD-L1 and CMTM6 co-localise at the plasma membrane. PD-L1 knockout, CMTM6 knockout and parental MDA-MB-231 Cas9 cells were fixed, immunostained for PD-L1 and CMTM6 and analysed by confocal microscopy. Scale bar: 10μm. d&e. Quantitative plasma membrane profiling. d. Experimental workflow e. Scatterplots display pairwise comparisons between parental MDA-MB-231 Cas9, CMTM6 sgRNA1 and CMTM6 sgRNA2-expressing cells. Experiment performed in triplicate. q-values determined using LIMMA with Benjamini-Hochberg adjustment for multiple testing.
As CMTM6 is an uncharacterised protein localised at the cell surface, we investigated what other proteins associate with CMTM6 under conditions that preserve its membrane-dependent interactions. CMTM6 was immunoprecipitated from digitonin lysates of IFN-γ treated cells and subjected to mass spectrometry analysis. After eliminating proteins identified in control immunoprecipitates, only a small number of high confidence interacting proteins were identified, of which PD-L1 was one of the top ranked (Extended Data Fig. 6c and supplementary table 1). To gain a comprehensive unbiased overview of plasma membrane proteins whose expression is altered following CMTM6 depletion, we combined plasma membrane enrichment through selective aminoxy-biotinylation (Plasma Membrane Profiling; PMP)8 with Tandem Mass Tag (TMT)-based quantitative proteomics9 (Figure 2d). Following CRISPR/Cas9 mediated disruption of CMTM6 with two independent sgRNAs (Figure 1d), we exploited 10-plex TMT labelling to profile the cell surface proteome of wild-type and CMTM6-depleted MDA-MB-231 breast cancer cells in triplicate. In total, 4935 proteins were quantitated, including 1424 proteins previously reported to localise to the plasma membrane. Notably, PD-L1 was one of only 4 proteins reproducibly decreased more than two-fold from the plasma membrane (Figure 2e and supplementary table 2). Taken together, the absolute requirement for CMTM6 for PD-L1 cell surface expression and the physical association between CMTM6 and PD-L1, establish CMTM6 as a new regulatory target to specifically vary the cell surface expression of this critical immune checkpoint molecule.
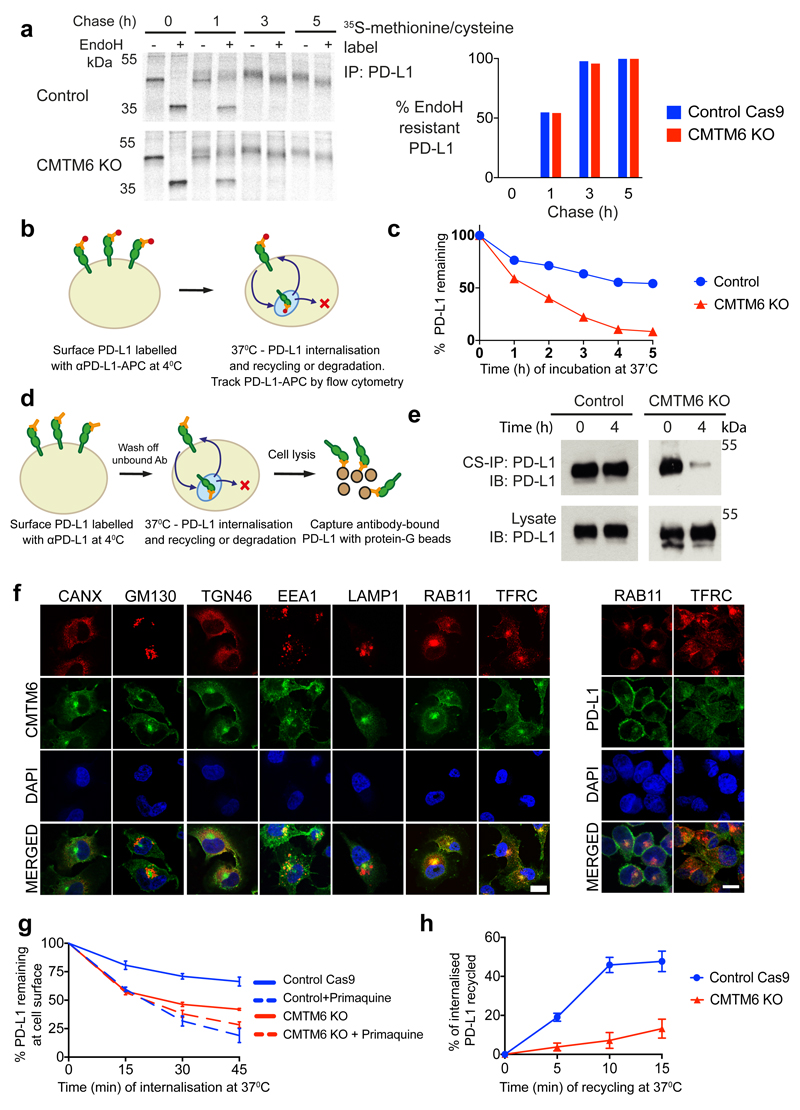
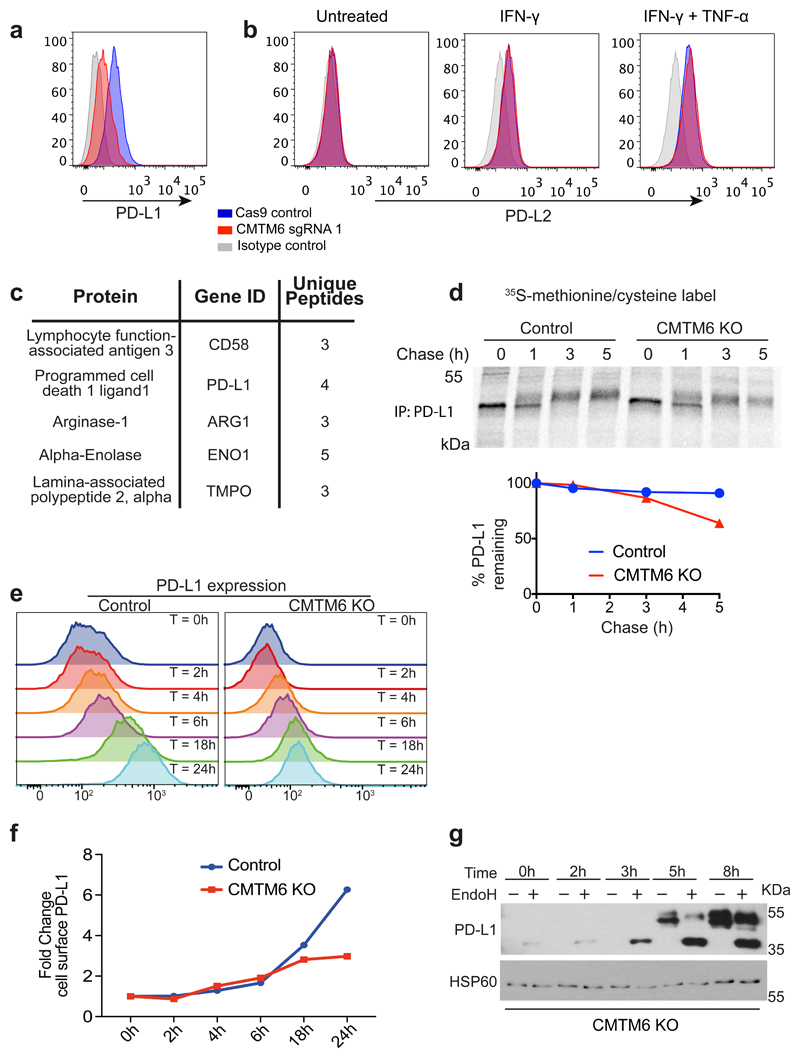
PD-L1 is a type I transmembrane protein with four N-linked glycans, which when modified by Golgi-resident enzymes become resistant to endoglycosidase H (EndoH) digestion permitting visualisation of PD-L1 trafficking through the secretory pathway. To examine the maturation of newly synthesised PD-L1, IFN-γ stimulated cells were pulse-labelled with [35S]-cysteine-methionine. EndoH-resistant PD-L1 species emerged at a similar rate in control and CMTM6 knockout cells, indicating that loss of CMTM6 does not impair PD-L1 export from the ER and trafficking beyond the medial Golgi (Figure 3a). Whilst PD-L1 levels in the early part of the chase were equivalent in wild-type and CMTM6 knockout cells, accelerated degradation of EndoH-resistant PD-L1 was evident at later time-points (Extended data Fig 6d). Consistent with this, PD-L1 cell surface expression increases in CMTM6 knockout cells for the first 6 hours after adding IFN-γ (Extended Data Fig. 6e-g), but beyond this time point only wild-type cells are able to further augment and sustain PD-L1 expression (Extended Data Fig. 6e/f). Together, these findings show that CMTM6 is not required for the trafficking of PD-L1 from the endoplasmic reticulum (ER) to the cell surface, but may be required for stable expression of PD-L1 at the plasma membrane.
Figure 3. CMTM6 is required for efficient endocytic recycling of PD-L1.
a. IFN-γ treated CMTM6 knockout or parental WM-852 Cas9 cells were pulse-labelled with 35S-methionine/cysteine for 30 min, chased at 37°C and PD-L1 immunoprecipitated from detergent lysates at the indicated times. Eluates were split and incubated ± Endoglycosidase-H. Scans quantitated in ImageJ. Representative of 3 experiments. b-e. Cell surface PD-L1 is targeted for degradation in the absence of CMTM6. b&c. IFN-γ treated WM-852 cells were treated as described (b). Representative of six experiments (see Extended Data Fig. 7a & 9a). d&e. Cell surface IP (CS-IP). IFN-γ treated WM-852 cells were treated as described (d) and PD-L1 immunoprecipitates analysed by immunoblot. f. CMTM6 and PD-L1 are identified in recycling endosomes. MDA-MB-231 cells were fixed and immunostained for CMTM6 (large panel) or PD-L1 (right panel) plus markers of the ER (calnexin (CANX)), Golgi (GM130 and TGN46), early endosome (EEA1), late endosome/lysosome (LAMP1) or recycling endosome (RAB11 and transferrin receptor (TFRC)). Scale bar: 10μm. g&h. PD-L1 recycling is impaired in the absence of CMTM6. g. IFN-γ treated WM-852 cells were labelled with an unconjugated PD-L1-specific antibody before incubation at 37°C ± primaquine (described in Extended Data Fig. 8a). Remaining antibody-labelled surface PD-L1 was detected with an AF647-conjugated anti-mouse antibody and analysed by flow cytometry. h. PD-L1 recycling in IFN-γ-treated WM-852 cells (assay described in Extended Data Fig. 8c). Graph shows the proportion of internalised antibody-labelled PD-L1 recycled at each time-point. g&h. Mean and s.e.m. from 3 experiments.
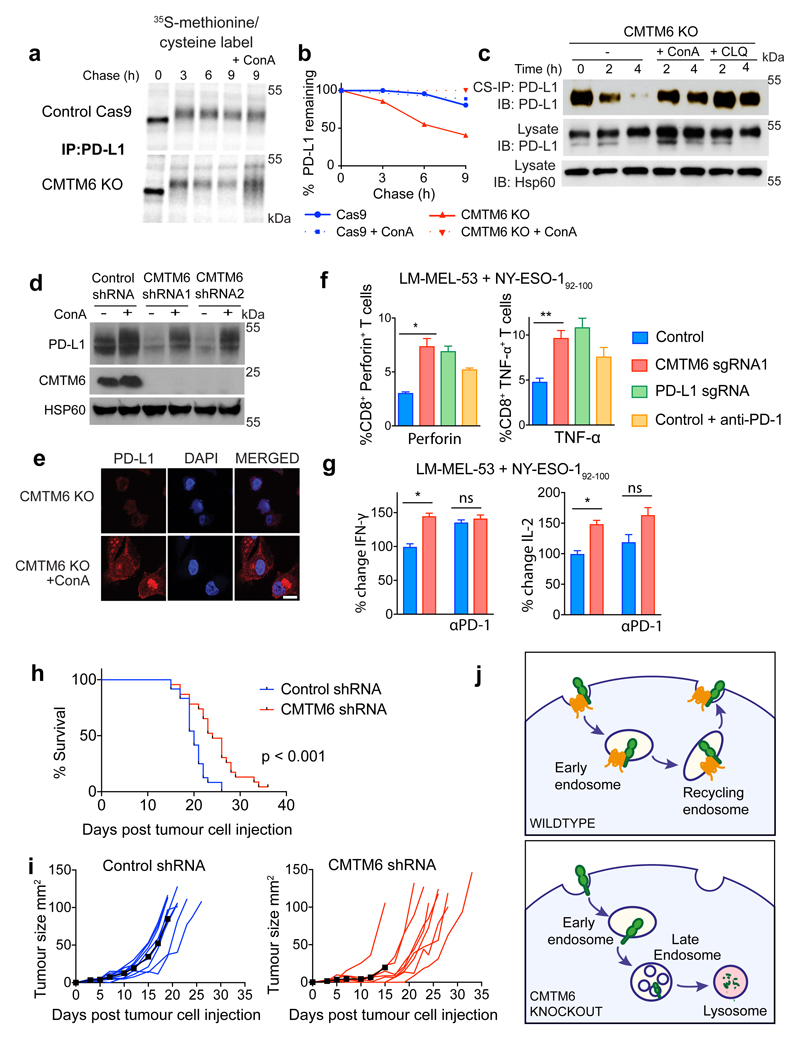
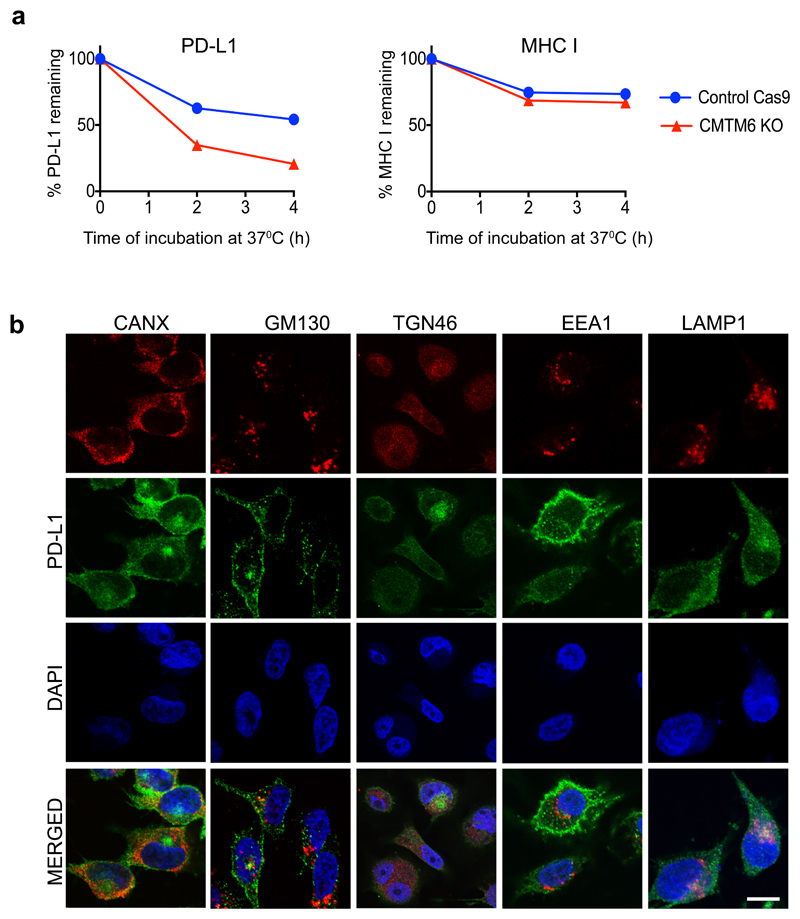
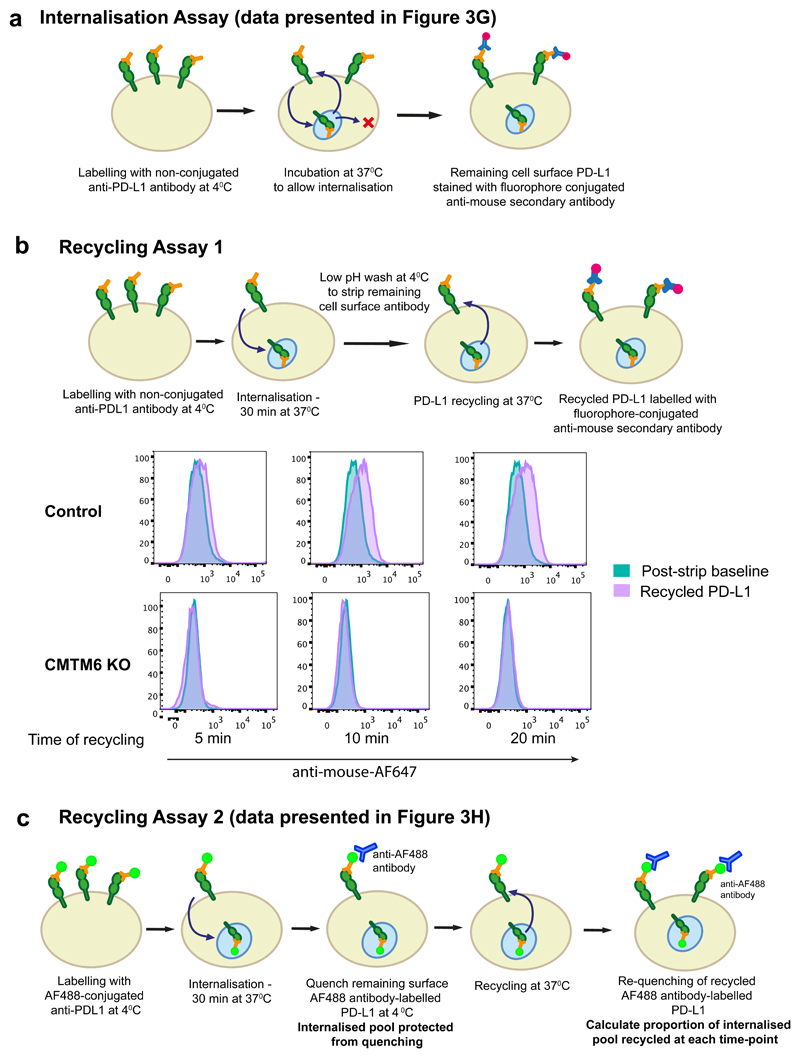
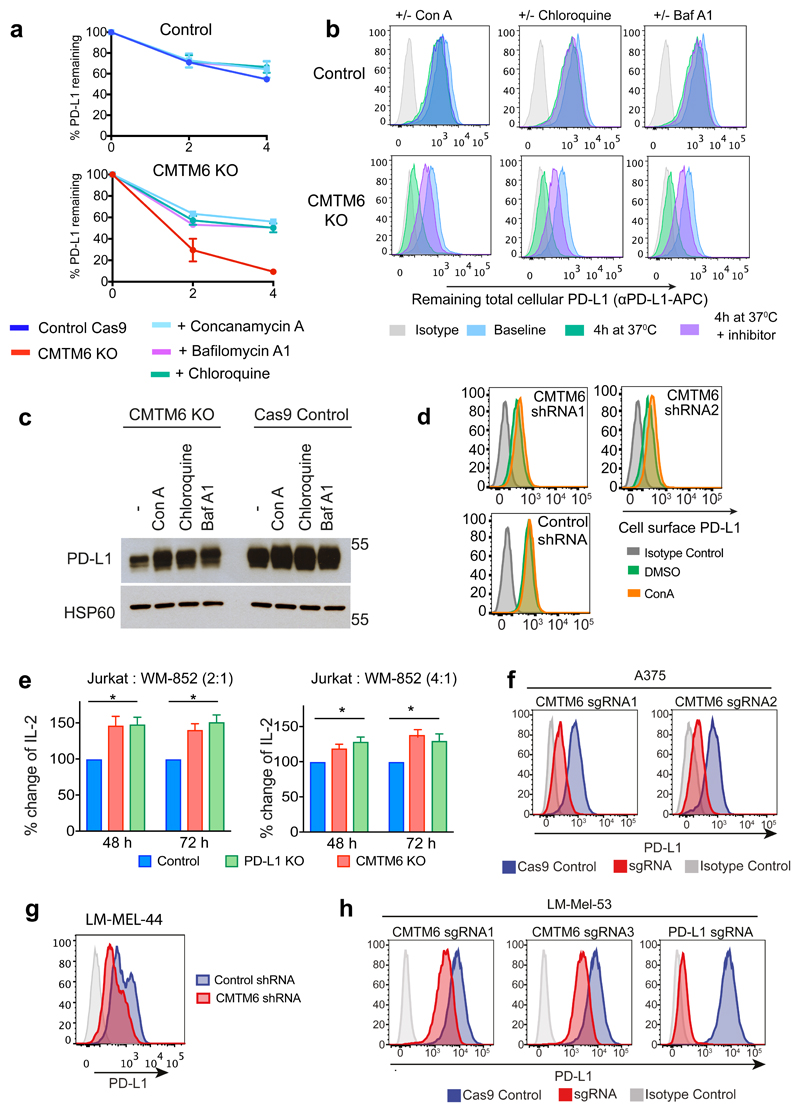
To establish whether CMTM6 regulates PD-L1 at the cell surface, we labelled surface PD-L1 with PD-L1-specific antibodies at 4°C before transferring cells to 37°C to allow PD-L1 internalisation and either degradation or recycling back to the plasma membrane (Figure 3b-e). When evaluated either by flow cytometry (Figure 3b/c) or immunoprecipitation (Figure 3d/e), degradation of antibody-labelled PD-L1 from the cell surface was markedly accelerated in the absence of CMTM6, whilst cell surface MHC class I labelled under the same conditions remained stable (Extended Data Fig. 7a). To understand how CMTM6 may function to stabilise cell surface PD-L1, we examined the subcellular localisation of CMTM6 using confocal immunofluorescence microscopy (Figure 3f). In addition to its expression at the plasma membrane, CMTM6 is predominantly identified in recycling endosomes where it co-localises with TFRC and RAB11, molecules that define the endocytic recycling compartment10 (Figure 3f). Subcellular localisation of PD-L1 also identified PD-L1 in recycling endosomes (Figure 3f and Extended Data Fig. 7b). Strikingly, incubation with primaquine, an inhibitor of endocytic recycling11, induced rapid loss of PD-L1 from the surface of wild-type cells suggesting that a large proportion of surface PD-L1 is continuously internalised and recycled (Figure 3g and Extended data Fig. 8a). In contrast, primaquine did not substantially increase the PD-L1 internalisation rate in CMTM6 knockout cells implying that the failure to maintain PD-L1 at the plasma membrane in the absence of CMTM6 is primarily due to defective endocytic recycling (Figure 3g). In support of this, we found using established recycling assays12, that in control cells the majority of internalised PD-L1 recycled back to the cell surface after 10 to 15 min; however, in the absence of CMTM6 PD-L1 recycling was markedly impaired (Figure 3h and Extended Data Fig. 8b/c). These data demonstrate that endocytosed PD-L1 is not effectively recycled in CMTM6 deficient cells and may instead be rerouted for degradation in the lysosome. Consistent with this, incubation with inhibitors of lysosomal acidification stabilises PD-L1 in CMTM6 deficient cells (Figure 4a-d and Extended Data Fig 9a/b/c); however, PD-L1 remains sequestered within the cell and cannot recycle to the cell surface (Figure 4e and Extended Data Fig 9d).
Figure 4. CMTM6 regulates tumour-specific T cell activity by regulating PD-L1 levels.
a-c. CMTM6 protects PD-L1 from lysosome-mediated degradation. a.35S-methionine/cysteine pulse-chase in IFN-γ treated WM-852 cells (as in Figure 3a) ± 50nM Concanamycin-A (ConA) as indicated b. Quantitation of a in ImageJ. c. Cell-surface IP in CMTM6 knockout cells (see Figure 3d/e). Incubation at 37°C ± 50nM ConA or 50μM Chloroquine d. MDA-MB-231 cells expressing CMTM6-targeting or control shRNAs were incubated ± 50nM ConA for 16 h before analysis by immunoblot e. CMTM6 knockout MDA-MB-231 cells were fixed and immunostained for PD-L1 following 16 h incubation ± ConA. Scale bar: 10μm. f&g. CMTM6 regulates the anti-tumour activity of antigen-specific CTLs f. Intracellular staining for perforin or TNF-α in NY-ESO-192-100 CTLs following 24 h co-culture with CMTM6 sgRNA, PD-L1 sgRNA or control vector transduced LM-MEL-53 Cas9 cells g. IFN-γ and Il-2 levels in supernatants from 3 day co-cultures of NY-ESO-192-100 CTLs and LM-MEL-53 cells f&g. Where indicated, 10μg/ml nivolumab (anti-PD-1) was added to the co-culture. Results are triplicates (mean + s.e.m.) * p < 0.05, ** p < 0.01, unpaired two-tailed t-test. h&i. C57BL/6 mice injected subcutaneously with 105 B16-OVA cells transduced with a CMTM6-targeting or control shRNA. I. Kaplan-Meier survival curve shows pooled data from 3 experiments (23/24 mice per group). Survival endpoint = tumour >100mm2. Mantel-Cox test. j. Growth of CMTM6-deficient and control tumours, 9 mice per group. Black line indicates mean tumour size. Data from all experiments shown in Extended Data Fig. 10. j. CMTM6 (orange) binds PD-L1 (green) and maintains its cell surface expression. In the absence of CMTM6, endocytosed PD-L1 is rerouted for lysosomal degradation.
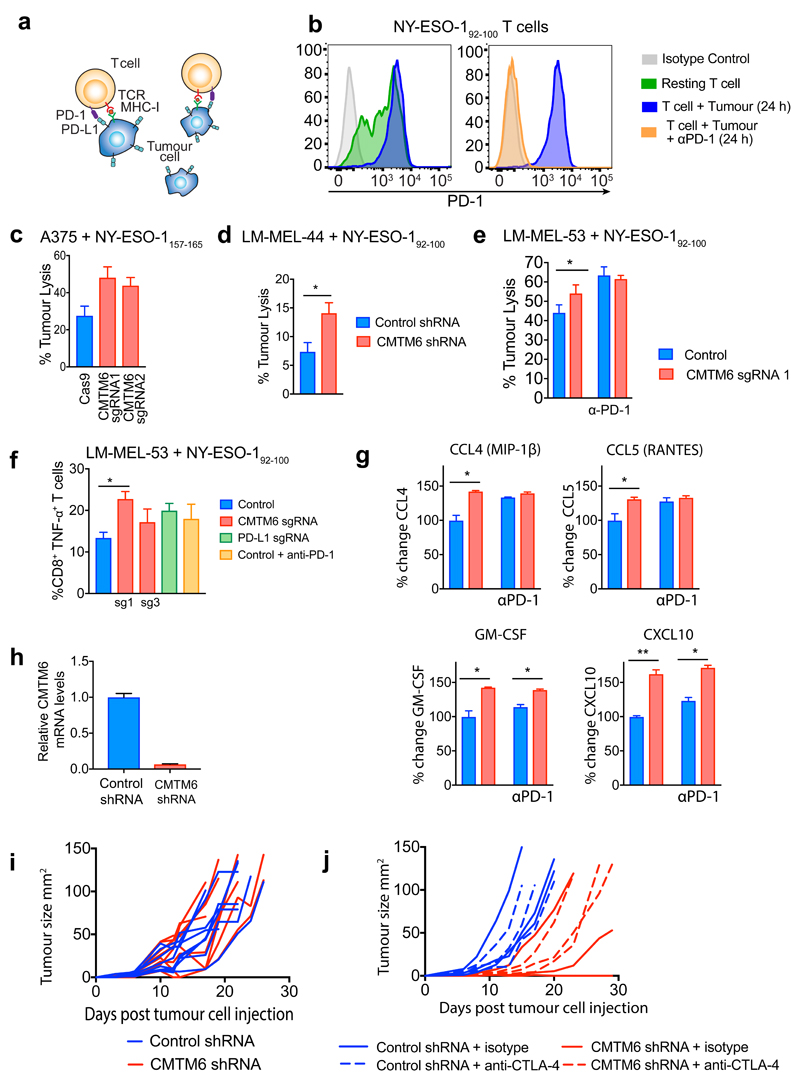
The success of anti-cancer therapies targeting the PD-1/PD-L1 immune checkpoint lies in their ability to potentiate anti-tumour immunity13. Clinical data supporting the value of anti-PD-1/PDL1 blockade is most advanced in melanoma14 so we used co-culture experiments with melanoma cells to evaluate the effects of CMTM6 depletion on T-cell responses. Co-culture with Jurkat T-cells, which respond to PD-1 inhibition15 showed that tumours depleted of either CMTM6 or PD-L1 potentiated Jurkat IL-2 secretion to a similar degree (Extended data Fig 9e). To extend these findings using primary cells, we isolated and expanded antigen-specific cytotoxic T-lymphocyte clones (CTL) recognizing distinct HLA-restricted epitopes from the cancer testis-antigen NY-ESO-1 from melanoma patients16,17. These CTLs were co-cultured with the HLA-A2 NY-ESO-1 positive melanoma line A375 and early passage HLA-Cw3 positive NY-ESO-1 positive cell lines derived from primary melanoma patient samples16. These melanoma lines were incubated with IFN-γ prior to co-culture to induce PD-L1 expression [Extended data Fig. 9f-h]. Melanoma cells with decreased cell surface expression of PD-L1 following CMTM6 knockout were killed more efficiently by NY-ESO-1157-165 and NY-ESO-192-100 specific CTLs, which expressed high levels of PD-1 (Extended Data Fig. 10a-e). Moreover, co-culture with CMTM6 depleted tumour cells significantly enhanced T-lymphocyte activation as indicated by an increased proportion of perforin and TNF-α producing CD8+ T-cells (Figure 4f and Extended Data Fig. 10f), increased IFN-γ and Il-2 secretion (Figure 4g) and augmented production of pro-inflammatory chemokines (Extended Data Fig. 10g). Notably, deleting PD-L1 or adding a saturating concentration of PD-1 blocking antibody to the co-culture enhanced T-cell activation to a similar degree as CMTM6 depletion (Figure 4f/g).
To examine the effects of CMTM6 on tumour control in vivo we used RNAi to deplete CMTM6 in B16F10 murine melanoma expressing the foreign antigen chicken ovalbumin (OVA) to enhance the immunogenicity of the tumours. Survival of mice transplanted with CMTM6-depleted cells was significantly increased compared to control shRNA-expressing cells (Figure 4h). This reflected overall attenuated growth of CMTM6-deficient tumours, despite some inter- and intra-experimental variability in the responses, which may represent the contribution of PD-L1 expressed in the tumour microenvironment. (Figure 4i and Extended data Fig 10h-j). Together our ex vivo human data and in vivo mouse data demonstrate that CMTM6 functions as a key regulator of T-lymphocyte mediated anti-tumour immunity by modulating cell surface expression of PD-L1.
Harnessing the immune system has emerged as one of the essential pillars of therapy in oncology. Key to this success has been the development of drugs that release the constraints of immune checkpoints1 and insights into the molecular regulation of essential checkpoint molecules therefore offer unique opportunities for innovative therapies. Here, we have shown that CMTM6, a previously uncharacterised protein, is a master regulator of PD-L1 cell surface expression across various cancer types. CMTM6 associates with PD-L1 at the plasma membrane and in recycling endosomes where it protects PD-L1 from being targeted for lysosomal degradation. CMTM6 shows significant specificity for PD-L1 and does not compromise antigen presentation via MHC Class I suggesting that it could serve as a specific therapeutic target to enhance anti-tumour immunity to an extent that is comparable to clinically used anti-PD-1 therapies. As existing immune checkpoint therapies are not universally effective and may be limited by toxicities18, identifying novel immunotherapies and combination strategies is a major priority19. These findings establish CMTM6 and its regulatory pathway as a potential new therapeutic avenue to enhance tumour specific immunity.
Methods
Cell Culture
WM-852 cells were obtained from the European Searchable Tumour Line Database (ESTDAB) cell line repository and BxPC-3 cells were a kind gift from Yaohe Wang (Barts Cancer Institute, London). HEK 293ET cells, were a gift from Dr. Felix Randow (MRC-LMB, Cambridge, UK). HCC-827, MDA-MB-231 and A375 were obtained from ATCC. The patient-derived melanoma cell lines LM-MEL-53 and LM-MEL-44 were established and characterised as previously described16. Cells were cultured in RPMI-1640 or DMEM (BxPC-3, HEK-293ET and B16F10-OVA) supplemented with 2 mM Glutamax, 100 IU/ml Penicillin, 100 μg/ml Streptomycin and 10 % heat-inactivated fetal calf serum.
Cell lines were authenticated by STR profiling through the Victorian Centre for Functional Genomics. Most recent authentication 1st March 2017. Cell lines were regularly tested and verified to be mycoplasma negative by PCR analysis by the Victorian Infectious Diseases References Lab (Melbourne, Victoria).
CRISPR/Cas9-mediated gene disruption
sgRNA oligonucleotides (Sigma-Aldrich) were phosphorylated and annealed and cloned into lentiviral expression vectors, pKLV-U6gRNA(BbsI)-PGKpuro2ABFP (Addgene #50946, deposited by Kosuke Yusa), or FgH1tUTG (Addgene #70183, a gift from Marco Herold) for inducible sgRNA expression. For CRISPR/Cas9-mediated gene disruption, cells were first transduced with the Cas9 expression vector pHRSIN-PSFFV-Cas9-PPGK-Blasticidin, selected with blasticidin, and then subsequently transduced with a lentiviral sgRNA expression vector. For transient sgRNA expression using FgH1tUTG, cells were treated with Doxycyline for 1 week. CMTM6 knockout and PD-L1 knockout clones were isolated by single cell dilution cloning from polyclonal sgRNA-transduced populations. Knockout clones were identified by flow cytometry analysis for cell surface PD-L1 followed by immunoblot for CMTM6 and PD-L1.
Lentiviral production and transduction
Lentivirus was produced by triple transfection of HEK-293ET cells with a lentiviral transfer vector, and the packaging plasmids psPAX2 and pMD.G at a 0.5:0.35:0.15 ratio. Transfection was performed using JetPEI reagent as recommended by the manufacturer. The viral supernatant was collected 48 h following transfection, filtered through a 0.45 μm filter, and added to target cells.
For lentiviral expression of shRNAs, shRNAs targeting CMTM6 or non-targeting control shRNAs were cloned into the pHR-SIREN vector, which co-expresses a GFP selection marker, via BamHI and EcoRI.
CRISPR sgRNA Library
A 10-sgRNA-per-gene CRISPR/Cas9 deletion library was designed to target all ~20,500 protein-coding human genes. The library contained two distinct classes of negative control gRNAs: non-targeting control sgRNA with no binding sites in the genome and safe-targeting sgRNA targeting genomic locations with no annotated function. Further details are described in Morgens DW et al7.
CRISPR screen
BxPC-3 cells were transduced with a lentiviral vector encoding Cas9 and selected with blasticidin. 108 cells BxPC-3 Cas9 cells were infected with the pooled lentiviral genome-wide sgRNA library at a multiplicity of infection of 0.3 and selected with 1μg/ml puromycin for 72 h, commencing 48 h after transduction. Rare PD-L1 low cells were enriched by two rounds of FACS sorting at day 7 and day 15 following transduction with the sgRNA library. For the sorts, cells (at least 108 for the first sort) were pre-treated with or without 500IU/ml IFN-γ for 48 h, harvested with trypsin, stained with APC-conjugated anti-PD-L1 antibody (MIH1, eBioscience) for 15 min on ice and washed with PBS prior to sorting for mCherry positive (sgRNA expressing) PD-L1 low cells on a BD Influx cell sorter. Genomic DNA was extracted (Puregene Core Kit A, Qiagen) from both the sorted cells and an unselected pool of mutagenised cells grown for the same amount of time. sgRNA sequences were amplified by two rounds of PCR, with the second round primers containing adaptors for Illumina sequencing. The resulting libraries were sequenced with single-end 50 bp reads on aHiSeq2500. The sequence reads were trimmed to remove the constant portion of the sgRNA sequences with fastx clipper (http://hannonlab.cshl.edu/fastx_toolkit/), then mapped to the reference sgRNA library with bowtie2. After filtering to remove multi-aligning reads, the read counts were computed for each sgRNA. The RSA algorithm was used to rank the genes for which targeting sgRNA were significantly enriched in the sorted populations compared to the control unsorted populations grown in parallel. The p-value cut-off for significance was adjusted to account for multiple-testing using the bonferroni correction.
Antibodies
Immunofluorescence: mouse α-EEA1 (1G11, eBioscience), mouse α-PD-L1 (MIH1, eBioscience), rabbit α-PD-L1 (EPFR19759, Abcam), mouse α-LAMP1 (H4A4, eBioscience), mouse α-Calnexin (AF18, Abcam), mouse α-GM130 (169276, Abcam), mouse α-TGN46 (2F7.1, Abcam), mouse α-Rab11 (47/Rab11, BD Transduction Laboratories), mouse α-TfR (236-15375, Thermo-Fisher), rabbit α-CMTM6 (HPA026980, Sigma-Aldrich).
Flow Cytometry: FITC mouse IgG2a κ isotype control (MOPC-173, Biolegend), APC mouse IgG2b κ isotype control (MPC-11, Biolegend), APC mouse IgG1 κ isotype control (MOPC-21), APC mouse α-PD-L1 (29E.2A3, Biolegend), APC mouse α-PD-L1 (MIH1, eBioscience), Alexa Fluor 488 rabbit α-PD-L1 (Abcam), APC mouse α-HLA-ABC (W6/32), Alexa Fluor 488 mouse α-HLA-ABC (W6/32, Biolegend), FITC mouse α-CD8 (HIT8a, BD Pharmingen), PE-Cy7 mouse α-TNFα (MAb11, eBioscience), APC mouse α-PD-1 (J105, eBioscience), PerCp-Cy5.5 mouse α-Perforin (B-D48, Biolegend).
Immunoprecipitation/Immunoblotting: goat anti-PDL1 (AF156, R&D Systems), rabbit α-PD-L1 (E1L3N, Cell Signalling Technology), mouse α-PD-L1 (405.9A11, Cell Signalling Technology), mouse α-PD-L1 (MIH1, eBioScience), rabbit α-CMTM6 (Sigma-Aldrich, HPA026980).
Immunoblotting and Immunoprecipitation
For immunoblotting cells were lysed either in 1% Triton X-100 in TBS pH7.6 with Roche complete protease inhibitor for 30 min on ice followed by pelleting of insoluble material by centrifugation, or in 1% SDS in 100mM Tris-HCl pH 8.0 plus Benzonase (Sigma) at room temperature. Lysates were heated to 70°C in SDS sample buffer with 50mM DTT for 10 min, separated by SDS-PAGE, and transferred to PVDF membrane (Millipore). Membranes were blocked in 5% milk in TBS + 0.1% Tween-20, probed with the indicated antibodies, and reactive bands visualised using West Pico (Thermo Fisher Scientific).
For co-immunoprecipitation experiments, cells were lysed in 1% Digitonin for 30 min on ice. Post-nuclear supernatants were adjusted to 0.5% Digitonin or to the detergent concentration indicated in the figures, incubated with primary antibody for 1 – 4 h, followed by addition of protein A- or protein G-Dynabeads and incubation for a further 2 h at 4°C. After four washes in 0.2% Digitonin, samples were eluted in SDS sample buffer with 50mM DTT for 10 min at 70°C, separated by SDS-PAGE and immunoblotted as described.
For immunoprecipitation of cell surface PD-L1 (CS-IP), live cells were incubated with anti-PD-L1 antibody (MIH1, 10μg/ml) for 60 min on ice. After 3 washes in ice-cold PBS to remove unbound antibody, cells were resuspended in prewarmed complete medium (RPMI/10% FCS) and incubated at 37°C for the indicated times. Cells were placed back on ice, washed once in PBS and lysed in 1% NP-40/TBS pH7.6 plus Roche complete protease inhibitor. Post-nuclear supernatants were incubated with protein G-Dynabeads for 3 h at 4°C to capture antibody-bound PD-L1. After four washes in 0.2% NP-40, samples were eluted in SDS sample buffer with 50mM DTT for 10 min at 70°C, separated by SDS-PAGE and immunoblotted as described.
Metabolic Labelling and Pulse-Chase
Cells were starved for 20 min in methionine-free, cysteine-free medium, labelled with [35S]methionine/[35S]cysteine) (Perkin-Elmer) for 30 min and then chased in medium containing excess cold methionine and cysteine (Sigma-Aldrich) at 37°C. Samples taken at the indicated time-points were lysed in 1% NP-40/TBS pH 7.6 with Roche complete protease inhibitor and 10mM iodoacetamide (IAA). Post-nuclear supernatants were pre-cleared with a combination of IgG-sepharose and Protein G Dynabeads for 1 to 2 h on a rotator at 4°C, and then incubated (rotating) with a PD-L1-specific antibody (AF156, R & D systems) for 1 h before adding Protein G Dynabeads for a further 2 h at 4°C. After 4 washes in 0.2% lysis buffer, samples were eluted in SDS sample buffer for 10 min at 70°C. Where indicated, eluates were treated with Endoglycosidase H (New England Biolabs) according to the manufacturer’s instructions before separation by SDS-PAGE. Gels were fixed, dried at 80°C for 2 h and processed for autoradiography. Phosphor screens were exposed to the radiolabelled proteins in fixed, dried gels overnight. Screens were scanned using a TYPHOON scanner and bands quantified using ImageJ.
Plasma Membrane Profiling by Mass Spectrometry
Plasma membrane profiling was performed as previously with minor modifications. MDA-MB231 cells expressing either Cas9 alone or Cas9 plus one of two sgRNAs targeting CMTM6 were cultured to ~80% confluence (3x 14cm dishes each). Cells were washed in PBS before biotinylation of the cell surface, washing and harvesting by scraping. Cells were lysed in 1% Triton X-100 in TBS pH8 with protease inhibitors (Complete EDTA-free, Roche) and incubated at 4°C for 30 min with end-over-end agitation. Following centrifugation (10,000 x g 10min), supernatants were applied to 50μL of High-Capacity Streptavidin-agarose resin (Thermo Fisher Scientific) and incubated at 4 °C for 2 h. Samples were applied to 500μL fritted microcolumns (Snap-Cap, Thermo Fisher Scientifc) and washed using a vacuum manifold with 20x400μL Lysis buffer, 20x400μL 0.5% SDS in PBS a 10x400μL 6M urea in 50mM TEAB buffer (pH8). Beads were resuspended in 400μL urea wash buffer containing 10mM TCEP and 10mM Iodoacetamide and incubated for 30 min in the dark at room temperature to effect reduction and alkylation of cysteines. Following 10x400μL washes with urea wash buffer and 5x400μL washes with 50mM TEAB, beads were recovered into LoBind Eppendorf tubes,spun briefly and supernatant removed before resuspending in 50μL of 50mM TEAB containing 0.5μg trypsin (Proteomics Grade, Thermo Fisher). Samples were incubated at 37°C for 8 h in a Thermo mixer C at 1200rpm. Subsequently samples were recovered from streptavidin beads and the beads washed once with 50μL 50mM TEAB. Samples were dried in a vacuum centrifuge and resuspended in 20μL 50mM TEAB.
TMT Labelling
To each tube 0.2μg of a unique TMT label for each sample was added in 8.5μL acetonitrile and incubated for 1 h at room temperature. Labels were as follows. Control: 126, 127N, 127C. sgRNA 1: 128N, 128C, 129N. sgRNA 2 129N, 130N, 130C. TMT reactions were quenched by addition of 3μL of 200mM ammonium formate, pooled and dried in a vacuum centrifuge. The sample was resuspended in 800μL 0.1% TFA and acidified to ~pH2 with formic acids before performing a C18-SPE cleanup using a Sep-Pak cartridge (Waters) attached to a vacuum manifold. C18 Eluate was dried in a vacuum centrifuge and resuspended in 40μL 200mM ammonium formate, pH10.
High pH Reversed Phase Fractionation
Sample was injected onto an Ultimate 3000 RSLC UHPLC system (Thermo Fisher Scientific) equipped with a 2.1 i.d x25cm, 1.7μm particle Kinetix Evo C18 column (Phenomenex). Mobile phase consisted of A: 3% ACN, B: ACN and C: 200mM ammonium formate pH 10. Isocratic conditions were 90% A/10%C and C was maintained at 10% throughout the gradient elution. Separations were carried out at 45°C. After loading at 200μL/min for 5 min and ramping the flow rate to 400μL/min over 5 min the gradient elution proceed as follows: 0-19% B over 10 min (curve 3), 19-34%B over 14.25 min (curve 5), 34-50%B over 8.75 min (curve 5), followed by a 10 min wash at 90% B. UV absorbance was monitored at 280nm and 15s fractions were collected into 96 well microplates using the integrated fraction collector. Peptide containing fractions were then orthogonally recombined into 12 fractions and dried in a vacuum centrifuge and resuspended in 10μL 5% DMSO 0.5% TFA for analysis.
LC-MS analysis
All samples were injected onto an Ultimate 3000 RSLC nano UHPLC equipped with a 300μm i.d. x 5mm Acclaim PepMap μ-Precolumn (Thermo Fisher Scientific) and a 75μm i.d. x75cm 2.1μm particle Acclaim PepMap RSLC analytical column. Loading solvent was 0.1% TFA, analytical solvent A: 0.1% FA and B: ACN+0.1% FA. All separations were performedat 55°C. Samples were loaded at 10μL/min for 5 min in loading solvent before beginning the analytical gradient. For High pH RP fractions a gradient of 3-5.6%B over 4 min, 5.6 – 32%B over 162min, followed by a 5 min wash at 80%B,a 5 minute wash at 90%B and equilibration at 3%B for 5min. For IP samples a linear gradient from 3-5.6%B over 8min and 5.6-32%B over 72min, followed by a 5 minute wash at 80%B and a 5 minute wash at 90%B and equilibration at 3%B for 5 min. A blank injection was run between each sample.
Data Processing
All Raw files were searched by Mascot within Proteome Discoverer 2.1 (Thermo Fisher Scientific) against the Swissprot Human database (11/12/2016) and a database of common contaminants. For TMT labelled samples the search parameters were as follows. Enzyme: Trypsin. MS1 tol: 10ppm. MS2 tol: 0.6Da. Fixed modifications: Carbamidomethyl Cysteine, TMT peptide N termini and Lysine. Variable modification oxidised methionine. MS3 reporter ion tol: 20ppm, most confident centroid. Mascot Percolator was used to calculate PSM FDR.
Search results were further processed and filtered as follows: Peptides below a percolator FDR of 0.01% and proteins below the 0.01% protein FDR (calculated from a built in decoy database search) were rejected. Protein groups were then generated using the strict parsimony principle. Peptides both unique and razor with a co-isolation threshold of 50 and an average s/n threshold of 10 were used for quantification and a normalisation of these values on the total peptide amount in each channel was applied. Instances where a protein was identified but not quantified in all channels were rejected form further analysis. Manual interpretation of the data did not reveal any protein conspicuously absent from any sample set. Processed data were analysed in R using a custom script to apply the moderated t-test LIMMA including Benjamini-Hochberg correction for multiple hypotheses. Supplementary table 2 holds all data from the experiment.
Co-Immunoprecipitation and Mass Spectrometry
IFN-γ treated MDA-MB-231 cells, and CMTM6 knockout cells as a negative control, were lysed in 1% Digitonin with Roche complete protease inhibitor and 10mM iodacetamide. Post-nuclear supernatants were adjusted to 0.5% Digitonin and pre-cleared with protein A-dynabeads for 2 h, incubated with rabbit anti-CMTM6 primary antibody (Sigma, HPA026980) for 2 h followed by addition of protein A-dynabeads for a further 2 h at 4°C. Following four washes in 0.2% Digitonin, samples were eluted in SDS sample buffer with 50mM DTT at 70°C for 10 min. Eluates were run ~1cm into NuPage 4-12% BIS-TRIS polyacrylamide gels (Invitrogen), stained with . Coomassie (Simply Stain, Invitrogen) and cut into ~1mm square pieces. Gel pieces were destained overnight in 50% ACN, shrunk in 100% ACN and rehydrated in 50mM TEAB (pH 8.5), 10mM TCEP, 10mM Iodoacetamide and incubated at room temperature for 30 min in the dark. Gel pieces were shrunk in ACN, rehydrated in 50mM TEAB and finally shrunk in ACN and dried briefly in a vacuum centrifuge. Gel pieces were incubated in 50mM TEAB with 10ng/μL trypsin on ice for 30 min before 50mM TEAB. incubation overnight at 37°C in 50mM TEAB. Peptides were recovered by sequential shrink/rehydrate cycles of ACN, 5%FA, ACN and dried in a vacuum centrifuge. Prior to analysis they were resuspended in 10μL 5% DMSO 0.5% TFA. Samples were acquired on the same platform as for the plasma membrane profiling experiments. A threshold of 0.01% PSM and 0.01% protein FDR was used as a cut-off for identification. To identify specific interaction partners of CMTM6, the data were filtered to remove proteins also present in control immunoprecipitations fromCMTM6 KO cells (Supplementary table 1).
Flow cytometry
Cells were washed in PBS and stained for cell surface PD-L1 or MHC class I on ice for 20 min in PBS plus 2% FCS. After washing in PBS samples were analysed on a BD LSR Fortessa and analysed in FlowJo.
Endocytosis and Recycling Assays
Assays were performed using three different WM-852 melanoma CMTM6 knockout clones (shown in extended Data Fig. 5A) and parental CAs9-expressing cells. All cells were pre-treated with IFNγ 500IU/ml for 18-24h before starting the assays.
i) Internalisation Assay
Cells were harvested with TrypLE Express, placed on ice and washed once in RPMI / 5% FCS / 30mM HEPES (used for all staining and wash steps). Cell surface PDL1 was labelled with unconjugated anti-PDL1 (29E.2A3, Biolegend) for 1 h on ice and washed twice to remove unbound antibody. Cells were resuspended in RPMI medium on ice and a baseline sample removed and kept on ice. Cells were incubated at 37°C in a water-bath, in the presence of 300 μM primaquine where indicated, and samples were removed at the indicated times and immediately diluted in ice-cold PBS to stop further endocytosis. Cells were washed twice, and remaining surface bound anti-PD-L1 antibody stained with Alexa Flour-647 conjugated anti-mouse secondary antibody for 30 min on ice. Samples were washed twice and analysed by flow cytometry.
ii) Degradation Assay
Cells were labelled as previously described with an APC-conjugated PD-L1 specific (29E.2A3) or MHC class I-specific antibody (W6/32). After washing as described cells were replated in complete medium and incubated at 37°C, in the presence or absence of lysosome inhibitors as indicated in the figure legends. The APC-conjugated antibody continues to fluoresce after internalisation and the degradation of cell surface-labelled PD-L1 / MHC class I is reflected by loss of fluorescence intensity over time. At the indicated times, cells were harvested by brief incubation with Tryple-Express, washed twice and fixed for 10 min in 4% PFA prior to analysis by flow cytometry.
iii) Recycling Assay 1
Cell surface PDL1 was labelled with unconjugated anti-PDL1 (29E.2A3, Biolegend) for 1 h on ice as described. Cells were incubated at 37°C for 30 min to allow endocytosis of antibody-labelled PD-L1. After washing, remaining surface bound antibody was stripped by two rounds of resuspension in low pH buffer (0.5 M NaCl, 0.5% acetic acid, pH 2.5-2.8) for 2 min on ice, followed by neutralisation with RPMI/5% FCS/30mM Hepes. A baseline sample was kept on ice and cells were returned to 37°C to allow PD-L1 recycling. Samples taken at the indicated times were stained with Alexa Flour-647 conjugated anti-mouse secondary antibody for 30 min on ice and analysed by flow cytometry.
iv) Recycling Assay 2
Cell surface PDL1 was stained with an AF488-conjugated anti-PD-L1 antibody (Abcam) on ice for 1 h then washed twice. A pre-endocytosis control sample was kept on ice and remaining cells were incubated at 37°C for 30 min to allow endocytosis of antibody-labelled PD-L1. The remaining surface-bound AF488-conjugated anti-PD-L1 antibody was quenched by incubation with an anti-AF488 antibody (Invitrogen) for 1 h on ice. Cells were washed twice and returned 37°C to allow PD-L1 recycling. Samples taken at the indicated times were returned to ice, split and incubated with or without anti-AF488 antibody to quench anti-PD-L1-AF488 recycled to the cell surface. Samples were analysed by flow cytometry. After normalisation for incomplete quenching by subtracting the quenchable AF488 signal present at baseline, the proportion of recycled PD-L1 was calculated from the ‘quenchable’ AF488 fluorescence intensity at each time point (MFI of non-requenched sample – MFI of requenched sample) divided by the fluorescence intensity of PD-L1 internalised during the endocytosis step.
Immunofluorescence
MDA-MB-231 cells were cultured on coverslips overnight, with or without IFN-γ and with or without 50nM Concanamycin A. For mixed cultures, one cell line was labeled with CFSE as per manufacturer’s instructions and cultured with unlabeled cells at a 1:1 ratio. Cells were fixed with 4% PFA for 10 min, permeablised with 0.25% tween-20 in PBS for 10 min, then blocked with 5% BSA, 0.3M glycine in PBST for 1 hour. The cells were incubated with the primary antibody at 4° C overnight. After washing 3× with PBST, the cells were incubated with the fluorescent conjugated secondary antibody for 1 h at RT. The slides were mounted with Prolong Gold and imaged on a Nikon C2 confocal microscope.
Generation and culture of NY-ESO-1 specific CD8+ T-lymphocyte clones
CD8+ T-lymphocyte clones specific for the NY-ESO-1 HLA-Cw3-restricted peptide NY-ESO-192–100 and the HLA-A2-restricted peptide NY-ESO-1157-165 were generated from patients who consented to participate in a clinical research protocol approved by Austin Health Human Research Ethics Committee (HREC H2006/02633). All ethical regulations were complied with. PBMC were stimulated with 1 × 10⁻⁶ M peptide (Mimotopes), and cultured for 10 days in the presence of 25 IU/ml IL-2 (Peprotech). Specific cells were labelled with a fluorescent tetramer (comprising the relevant peptide and HLA, (TCMetrix, Epalinges, Switzerland) and single-cell sorted using a MoFlow cytometer. Clones were expanded with pooled, autologous healthy donor PBMC as feeder cells, 1 μg/ml phytohaemagglutinin-L (PHA-L (Sigma)) and 600 IU/ml IL-2 (Cetus). After approximately 20 days, 1–10 × 103 clones were restimulated in the presence of autologous PBMC as feeder cells, PHA-L and IL-2, as described above. Clone specificity was confirmed by tetramer staining. T-lymphocyte clones/lines were cultured in RPMI-1640 media supplemented with 2 mM Glutamax, 100 IU/ml Penicillin, 100 μg/ml Streptomycin, 20 mM HEPES, 1 % nonessential amino acids, 1 mM sodium pyruvate, 55 μM β-mercaptoethanol, and 10 % human serum (TCRPMI). IL-2 (100 IU/ml) was added and replaced every 3 days.
Intracellular cytokine staining of antigen-activated T-lymphocytes
NY-ESO-1 antigen-specific T-lymphocyte clones were incubated with melanoma cells for 16 to 24 h prior to addition of 10 μg/ml brefeldin A to the culture medium for a further 6 h. To stain surface markers, cells were washed and labelled with live/dead fixable violet stain (Invitrogen) and antibodies targeting CD3 (BV510), CD8 (FITC) and PD-1(APC) in PBS for 15 min in the dark at 4°C, washed and then fixed and permeabilised with BD Cytofix/Cytoperm reagent (BD Biosciences) for 20 min at 4°C. Cells were stained with anti-TNFα (PE-Cy7) and anti-perforin (PerCp/Cy5.5) in permeabilisation solution (BD Biosciences) for 25 min and washed prior to flow cytometry analysis. Data were acquired on a FACSVerse Flow Cytometer using FACSDiva software and analysed using FlowJo.
Cytokine Secretion
20,000 IFN-γ pretreated melanoma cells per well were plated in 96-well plates and 10,000 NY-ESO-1 antigen-specific CTLs were added. Both melanoma cells and T-lymphocytes were washed prior to plating to remove potential contaminating traces of IFN-γ or IL-2 from the media. Cells were co-cultured for 72 hours and 10ug/ml of anti-PD-1 antibody was included in the co-culture where indicated. 100ul of 200ul total supernatant was removed, transferred to a fresh 96well plate, frozen and sent to elisakit.com for analysis. Cytokines and chemokines were quantified by multiplex bead array using a ‘Cytokine 25-plex Human Panel’ on a Luminex platform. Assays were performed in duplicate for untreated control cells and in triplicate for all other samples. To evaluate for PD-L1 dependent effects of CMTM6, cytokines/chemokines detected were filtered for those present at altered levels (defined as a change of more than 10%) following inclusion of anti-PD-1 in the co-culture (shown in Figure 4g and Extended data Fig. 10g). The cytokine concentration in co-cultures with CMTM6-depleted cells was compared to control cell cultures and p-values calculated in Prism using unpaired two-tailed t-tests with Holm-Sidak correction for multiple testing.
Analysis of tumour killing by NY-ESO-1 antigen-specific T-lymphocytes
Five or ten thousand melanoma cells per well were plated in a flat bottom 96-well plate. T-lymphocytes were added to selected wells to give the effector to target (E:T) ratios indicated in the figure legends. Samples were incubated at 37 °C for either 24h (Extended Data Fig 10C) or 48h (Extended Data Fig 10d/e). T- lymphocytes were resuspended by gentle pipetting and then removed. The plate was washed once with PBS. MTS reagent (CellTiter 96® AQueous One Solution Cell, Promega) was added and samples incubated for 1–2 h at 37°C. Absorbance at 490 nm was measured and normalized to melanoma samples incubated in absence of T-lymphocytes for each cell line to give the percentage of viable cells.
Jurkat co-culture IL-2 assays
WM-852 PD-L1 and CMTM6 knockout clones and parental Cas9 expressing WM-852 cells transduced with a control vector (pKLV-U6sgRNA-PGKpuro2ABFP) were treated with IFN-γ for 24 hours. 1×10⁴ WM-852 cells were plated into 96 well plates in 100μL of media and allowed to adhere for 24 hours. Jurkats were activated with 25ng/mL of PMA and 1μg/mL of PHA for 24 hours, then added to WM-852 cells at a ratio of 2:1 or 4:1 Jurkat:WM-852. The cell culture media was collected after 48 and 72 hours of co-culture. The levels of IL-2 were measured with the BD cytometric bead array assay IL-2 flex set and analysed on a FACSverse flow cytometer.
Animal experiments
The C57BL/6 mouse melanoma cell line B16F10 stably expressing chicken ovalbumin (B16-OVA) was provided by Jason Waithman (Telethon Kid’s Institute). For in vivo experiments, 100,000 cells were resuspended in PBS and injected subcutaneously in a 100μl volume into female C57BL/6 mice, purchased from the Walter and Eliza Hall Institute (Melbourne, Australia). The survival endpoint was when tumours reached a size of 100mm2. Mice were used between 6 and 12 weeks of age and the number of mice per group was selected to provide sufficient statistical power to the experiment according to the expected biological variation. In the experiment shown in Extended Data Fig. 10, mice were matched according to initial tumour size and randomised to treatment with anti-CTLA-4 9H10 (150ug/mouse) or isotype control antibody at days 4, 8 and 12 following tumour cell inoculation. Investigators were not blinded as to group allocation. All animal studies were approved in advance by the Peter MacCallum Animal Ethics and Experimentation Committee and all ethical obligations were complied with.
sgRNA Target Sequences
| Gene | Target Sequence |
|---|---|
| PD-L1 (g1) | GTTCCCAAGGACCTATATG |
| PD-L1 (g2) | GAACATGAACTGACATGTC |
| CMTM6 (g1) | CAATACACAATCAGTATA |
| CMTM6 (g2) | GCCCGGGTCCTCCTCCGTAG |
| CMTM6 (g3) | GGTGTACAGCCCCACTACGG |
| JAK2 (g1) | GAGCGAACAGTTTCCATC |
| JAK2 (g2) | AACCTGGAAGTGGTCCTTC |
shRNA target sequences
Human CMTM6 (sh1), 5’- AGGTCAAGAAGGCAGTTTT -3’; human CMTM6 (sh2) 5’- CCCAAGACAGTGAAAGTAA-3’; mouse CMTM6, 5’- TGCCTAACAGAAAGCGTGT-3’; non-targeting, 5’- GGGTATCGACGATTACAAA-3’
qRT-PCR primers
| Forward Primer (5’ →3’ ) | Reverse Primer (5’ →3’ ) | |
|---|---|---|
| CMTM6 | ATGAAGGCCAGCAGAGACAG | GTGTACAGCCCCACTACGGA |
| PD-L1 | GGTGCCGACTACAAGCGAAT | AGCCCTCAGCCTGACATGTC |
| GAPDH | ACAACTTTGGTATCGTGGAAGG | GCCATCACGCCACAGTTTC |
Data Availability
The CRISPR screen sequencing data has been deposited to the NCBI short read archive under the accession number PRJNA361422. Source data re provided for figures 1-4 and extended data figures 2, 5-7, 9&10. Complete mass spectrometry datasets are provided in the supplementary information.
Extended Data
Extended Data Figure 1. A CRISPR/Cas9 screen in the pancreatic cancer cell line BxPC-3 identifies CMTM6 as a principal regulator of PD-L1 expression.
a. PD-L1 is expressed at the cell surface in BxPC-3 cells and upregulated following treatment with IFN-γ. Cell surface PD-L1 was analysed by flow cytometry following incubation with or without IFN-γ 500IU/ml for 48 h. b. BxPC-3 cells stably expressing Cas9 were mutagenised by infection with a pooled lentiviral sgRNA library and rare PD-L1 low cells enriched by two successive rounds of FACS sorting, with or without IFN-γ pretreatment as indicated, for mCherry positive (containing sgRNA vector) PD-L1 low cells. FACS plots depict sorted and unsorted mutagenised populations stained for PD-L1 (top panel) and MHC class I control (bottom panel). Cells were pre-treated with IFN-γ 500IU/ml for 48 h prior to analysis. c. Total cellular PD-L1 levels are dramatically reduced following shRNA-mediated depletion of CMTM6 in both IFN-γ treated and non-IFN-γ treated cells. Immunoblot for PD-L1, CMTM6 and HSP60 control in MDA-MB-231 cells transduced with shRNAs targeting CMTM6 or control shRNA. d. Reduced cell surface PD-L1 following shRNA-mediated depletion of CMTM6 in BxPC-3 cells.
Extended Data Figure 2. Down-regulation of cell surface PD-L1 following effective RNA interference (RNAi)-mediated depletion of CMTM6.
a. Efficiency of CMTM6 depletion was assessed by quantitative reverse transcription PCR (qRT-PCR) in cells transduced with shRNAs targeting CMTM6 or a non-targeting control shRNA. The mean and s.e.m. of 3 technical replicates are shown. b. RNAi-mediated depletion of CMTM6 reduces cell surface PD-L1 expression both in the presence and absence of IFN-γ stimulation. Cell surface PD-L1 was analysed by flow cytometry in the indicated cell lines transduced with lentiviral vectors encoding shRNAs targeting CMTM6 or control shRNA (left panel). The adjacent bar chart (right panel) shows fold change in cell surface PD-L1 fluorescence intensity following CMTM6 depletion (mean and s.e.m.). BxPC-3, HCC-827 and A375 cells were pre-treated with IFN-γ 500IU/ml for 48 h prior to analysis. Experiments were performed at least twice in each cell type.
Extended Data Figure 3. CRISPR/Cas9-mediated knockout of CMTM6 reduces cell surface PD-L1 expression in a broad range of cancer cells.
Flow cytometry analysis of cell surface PD-L1 in cells transduced with different sgRNAs targeting CMTM6 compared to parental Cas9 expressing cells. Cell lines depicted are melanoma (A375 and WM-852), triple-negative breast cancer (MDA-MB-231), non-small cell lung cancer (HCC-827) and pancreatic cancer (BxPC-3). All cells were pre-treated with IFN-γ 500IU/ml for 48 h prior to analysis. Selected representative histograms are presented in Figure 1e.
Extended Data Figure 4. CMTM6 selectively regulates both constitutive and interferon-induced PD-L1 without compromising tumour cell MHC class I expression.
a. Cell surface MHC class I expression is unaffected by shRNA-mediated depletion of CMTM6. Flow cytometry analysis of surface MHC class I and PD-L1 in MDA-MB-231 and A375 cells transduced with shRNAs targeting CMTM6 or control shRNA. Cells were pre-treated with IFN-γ 500IU/ml for 48 h prior to analysis. b. CMTM6 knockout leads to loss of both constitutive and IFN-γ-induced PD-L1 expression. Flow cytometry analysis of cell surface PD-L1 in Cas9-expressing MDA-MB-231 cells transduced with sgRNA targeting either PD-L1, JAK2 or CMTM6 (red) compared to parental Cas9-expressing cells (blue). PD-L1 expression is reduced in both the presence and absence of IFN-γ stimulation following knockout of CMTM6. In contrast, knockout of the IFN-γ pathway component JAK2 leads to selective loss of IFN-γ induced upregulation of PD-L1 with no effect on constitutive PD-L1 expression.
Extended Data Figure 5. CMTM6 is not regulated by IFN-γ and co-localises with PD-L1 at the cell surface in both the presence and absence of IFN-γ stimulation.
a. CMTM6 regulates cell surface and total PD-L1 levels in a dose-dependent manner. Single cell clones isolated from WM-852 cells transduced with Cas9 and an sgRNA targeting CMTM6 were analysed by flow cytometry for surface PD-L1 and immunoblot for total PD-L1 and CMTM6 following incubation with 500IU/ml IFN-γ for 48 h b. qRT-PCR analysis of relative CMTM6 mRNA expression in the indicated cell lines incubated with or without IFN-γ 500IU/ml for 48 h prior to analysis. Graphs show mean and s.e.m. of two biological replicates (MDA-MB-231 and HCC-827) or three technical replicates (BxPC-3). c. To confirm specific staining of endogenous CMTM6 by the anti-CMTM6 antibody, CMTM6 knockout MDA-MB-231 cells were labelled with CFSE prior to mixing with wildtype MDA-MB-231 cells, fixed and immunostained for CMTM6. Scale bar: 10μm. d. MDA-MB-231 cells treated with IFN-γ 500IU/ml for 48 h were fixed, immunostained for CMTM6 and PD-L1 and analysed by confocal microscopy. Scale bar: 10μm.
Extended Data Figure 6. CMTM6 shows functional specificity for PD-L1.
a&b. CMTM6 specifically regulates PD-L1, with no effect on cell surface PD-L2 levels in THP-1 cells. THP-1 cells expressing Cas9 and transduced with CMTM6 sgRNA were treated with IFN-γ 500 IU ml-1 and TNF-α 20 ng ml-1 for 24 h as indicated prior to staining of cell surface PD-L1 and PD-L2 and analysis by flow cytometry. C. Mass spectrometry analysis identifies PD-L1 as a principal interaction partner of CMTM6. CMTM6 was immunoprecipitated from digitonin lysates of IFN-γ-treated MDA-MB-231 cells, and CMTM6 knockout cells as a control. Immunoprecipitates were analysed by mass spectrometry. Table represents all CMTM6 interaction partners identified by at least 3 unique peptides and absent from the control immunoprecipitation from CMTM6 knockout cells. d. Increased degradation of EndoH-resistant PD-L1 species in the absence of CMTM6. IFN-γ treated CMTM6 knockout or parental Cas9-expressing WM-852 cells were pulse-labelled with 35S-methionine/cysteine for 30 min before chase incubation at 37°C. PD-L1 was immunoprecipitated from detergent lysates at the indicated times. e&f. IFN-γ 500IU/ml was added to CMTM6 knockout and parental Cas9-expressing WM-852 cells and samples taken at the indicated time-points for analysis by flow cytometry. A representative example of an experiment done in biological triplicate is shown. g. Lysates of CMTM6 knockout cells incubated with IFN-γ for the indicated times were treated with or without EndoH prior to SDS-PAGE analysis and immunoblot to assess modification of N-linked glycans on PD-L1 as a marker of passage through the Golgi.
Extended Data Figure 7. Cellular Localisation of PD-L1.
a) Loss of CMTM6 leads to selective destabilisation of PD-L1 with no effect on the stability of cell surface MHC class I. IFN-γ treated CMTM6 knockout and Cas9 control WM-852 cells were labelled as described in Figure 3B with APC-conjugated antibodies specific for either PD-L1 or MHC class I on ice prior to incubation at 37°C. Samples taken at the indicated time-points were analysed by flow cytometry. Experiment performed twice. b) MDA-MB-231 cells were fixed, immunostained for PD-L1 together with a marker of the ER (CANX), Golgi (GM130 and TGN46), early endosome (EEA1) or late endosome/lysosome (LAMP1) prior to analysis by confocal microscopy. Scale bar: 10μm.
Extended Data Figure 8. PD-L1 endocytosis and recycling assays.
a. Internalisation assay (relates to data presented in Figure 3g). Cells were labelled with unconjugated PD-L1-specific antibodies at 4°C. After washing off unbound antibody, cells were incubated at 37°C to allow PD-L1 internalisation. Remaining cell surface antibody-labelled PD-L1 was detected with an AF647-conjugated anti-mouse secondary antibody and analysed by flow cytometry.
b. Recycling assay 1. Cell surface PD-L1 in IFN-γ treated CMTM6 knockout and Cas9 control WM-852 cells was labelled with an unconjugated PD-L1 specific antibody and allowed to internalise for 30 min at 37°C as described in a. Remaining cell-surface bound antibody was stripped by washing in pH 2.5 buffer and cells were either kept on ice (post-strip baseline) or re-incubated at 37°C for the indicated times. Recycled PD-L1 was detected with an AF647-conjugated anti-mouse secondary antibody.
c. Recycling assay 2 (relates to data presented in Figure 3h). Cells were labelled with an AF488-conjugated PD-L1 specific antibody, washed and incubated at 37°C to allow endocytosis. Remaining cell surface AF488 was quenched by incubation with an AF488-specific antibody for 1 h on ice prior to reincubation at 37°C to allow recycling of antibody-labelled PD-L1. Samples were split and incubated with or without an AF488-specific antibody for 1 h on ice to re-quench cell surface AF488. Recycled PD-L1 was detected by the reappearance of cell surface ‘quenchable’ AF488 signal. After normalisation for incomplete quenching at baseline by subtracting the ‘quenchable’ AF488 fluorescence at time zero, the fluorescence intensity of recycled PD-L1 at each time-point was compared to that of the total internalised PD-L1 after the endocytosis step to calculate the proportion of PD-L1 recycled.
Extended Data Figure 9. PD-L1 is targeted for degradation in the lysosome following depletion of CMTM6.
a/b. PD-L1 is targeted for lysosome-dependent degradation in the absence of CMTM6. IFN-γ treated CMTM6 knockout and Cas9 control WM-852 cells were labelled with APC-conjugated PD-L1-specific antibody as in Figure 3b. Cells were chased at 37°C in the presence or absence of either 50nM Concanamycin-A, 50μM Chloroquine or 400nM Bafilomycin A1. 2 experiments (mean, s.e.m.) c. IFN-γ treated CMTM6 knockout and Cas9 control WM-852 cells were incubated with Con-A, Chloroquine or Bafilomycin-A1 for 16 h prior to analysis by immunoblot. d. Following inhibition of lysosomal degradation PD-L1 remains sequestered intracellularly in the absence of CMTM6. MDA-MB-231 cells expressing shRNAs targeting CMTM6 or control shRNA were incubated with 50nM Concanamycin-A (ConA) for 16 h prior to flow cytometry analysis for cell surface PD-L1. e. Jurkat cells co-cultured with a CMTM6 knockout tumour show enhanced Il-2 secretion. Jurkat cells were pre-activated overnight with PMA and PHA and co-cultured with PD-L1 knockout, CMTM6 knockout or control vector expressing WM-852 Cas9 cells pre-treated with 500IU/ml IFN-γ for 24h to upregulate PD-L1 expression. Il-2 levels in the culture supernatant were measured by cytometric bead array after 48 h and 72 h co-culture of Jurkat cells and tumour. Graphs show percent change in Il-2 secretion compared to control cell co-culture (mean and s.e.m. of experimental duplicates) f-h. Reduction in cell surface PD-L1 following knockout or knockdown of CMTM6 in NY-ESO-1 expressing melanoma cell lines used in T-cell co-culture assays. All cells were treated with IFN-γ prior to flow cytometry analysis for cell surface PD-L1. f. A375 cells stably expressing Cas9 were transduced with two different sgRNA targeting CMTM6 and CMTM6 knockout clones isolated by dilution cloning. g. Patient-derived melanoma cell line LM-MEL-44 was transduced with CMTM6 targeting or control shRNA. h. Patient-derived melanoma cell line LM-MEL-53 was sequentially transduced with Cas9 and either one of two different sgRNAs targeting CMTM6, an sgRNA targeting PD-L1 or a control vector.
Extended Data Figure 10. CMTM6 regulates tumour-specific T cell activity by regulating PD-L1 levels.
a. Schematic overview of T-cell and tumour co-culture assays to evaluate PD-L1-dependent inhibition of T-cell activity. b. Increased PD-1 expression on NY-ESO-192-100 HLA-CW3 restricted T-lymphocytes following 24 h co-culture with LM-MEL-53 melanoma. Staining with APC-conjugated anti-PD-1 antibody is completely blocked following addition of anti-PD-1 antibody nivolumab (BMS) at a saturating concentration (10μg/ml). c-fg CMTM6 regulates the anti-tumour activity of NY-ESO-1 antigen-specific T lymphocytes c-e. NY-ESO-192-100 HLA-CW3 restricted or NY-ESO-1157-165 HLA-A2 restricted CTLs were incubated with the indicated melanoma cells at an effector:target ratio of 1:1 (c&e) or 1:2 (d) for 24-48 h at 37 °C, then washed off. CTL mediated tumour lysis was determined by MTS assay and normalized to control wells with no CTLs.. Error bars represent SEM (n = 3). * p < 0.05. f&g. Enhanced T-cell activation following co-culture with a CMTM6-depleted cancer cells. f. NY-ESO-192-100 HLA-CW3 restricted T-lymphocytes were cultured with CMTM6 sgRNA, PD-L1 sgRNA or control vector transduced LM-MEL-53 melanoma cells stably expressing Cas9 for 24h prior to incubation with Brefeldin A for 6 h and intracellular staining for TNF-α. Where indicated, 10μg/ml nivolumab (anti-PD-1 antibody) was added to the co-cultures. c-f. Graphs show triplicates (mean + s.e.m.) *P < 0.05, unpaired two-tailed t-test. g. Supernatants from 3 day co-cultures of NY-ESO-192-100 CTLs and control vector or CMTM6 sgRNA transduced LM-MEL-53 cells were analysed by multiplex bead immunoassay (Luminex). Chemokines detected at increased levels following inclusion of 10μg/ml nivolumab (anti-PD-1 antibody) in the co-cultures are shown. Graphs show triplicates (mean + s.e.m). * p < 0.05, unpaired two-tailed t-test with Holm-Sidak correction for multiple testing. h. Efficiency of CMTM6 depletion was assessed by qRT-PCR in B16-OVA cells transduced with shRNA targeting CMTM6 or a non-targeting control shRNA. i&j. Growth of CMTM6-deficient and control shRNA expressing B16-OVA tumours injected subcutaneously in C57BL/6 mice. Data are from two independent experiments. Where indicated, mice were treated with anti-CTLA-4 or isotype control antibody from day 4 after tumour cell injection.
Supplementary Material
Acknowledgments
M.L.B. is supported by a Cancer Research UK Fellowship, Addenbrooke’s Charitable Trust award and NIHR fellowship. M.A.D. is supported by a Senior Leukaemia Foundation Australia Fellowship and work in the Dawson laboratory is supported by the NHMRC (Grants 1085015, 1106444, 1106447) Cancer Council Victoria and Leukaemia Foundation Australia. P.J.L is supported by a Wellcome Trust PRF (101835/Z/13/Z) and work in the Lehner laboratory is supported by NHSBT, NIHR Cambridge BRC, a Wellcome Trust Strategic Award to CIMR, and the Addenbrooke’s Charitable Trust.
Footnotes
Author Contributions
M.L.B, P.J.L. and M.A.D. designed the research and interpreted data. M.A.D and M.L.B wrote the manuscript with assistance from P.J.L, Y-C.C and E.Y.N.L. M.L.B, C.E.S, Y-C.C, E.Y.N.L, C.C.B, S.S, and O.G. performed experiments and analyzed data directly supervised by M.A.D. M.L.B performed the CRISPR screen assisted by S.B. and J.C.W performed the plasma membrane profiling supervised by P.J.L. K.W. and A.B. performed T-cell assays supervised by J.C. P.A.B and M.A.H. performed the mouse experiments. D.M. and M.C.B. designed and generated the CRISPR sgRNA library. P.J.N, P.K.D, S-J.D, I.V and J.A.T provided critical reagents and aided in manuscript preparation.
Author Information Statement
Reprints and permissions information is available at www.nature.com/reprints.
The authors have no competing interests to declare.
References
- 1.Sharma P, Allison JP. The future of immune checkpoint therapy. Science. 2015;348:56–61. doi: 10.1126/science.aaa8172. [DOI] [PubMed] [Google Scholar]
- 2.Boussiotis VA. Molecular and Biochemical Aspects of the PD-1 Checkpoint Pathway. N Engl J Med. 2016;375:1767–1778. doi: 10.1056/NEJMra1514296. [DOI] [PMC free article] [PubMed] [Google Scholar]
- 3.Green MR, et al. Integrative analysis reveals selective 9p24.1 amplification, increased PD-1 ligand expression, and further induction via JAK2 in nodular sclerosing Hodgkin lymphoma and primary mediastinal large B-cell lymphoma. Blood. 2010;116:3268–3277. doi: 10.1182/blood-2010-05-282780. [DOI] [PMC free article] [PubMed] [Google Scholar]
- 4.Kataoka K, et al. Aberrant PD-L1 expression through 3'-UTR disruption in multiple cancers. Nature. 2016;534:402–406. doi: 10.1038/nature18294. [DOI] [PubMed] [Google Scholar]
- 5.Morgens DW, et al. Genome-scale measurement of off-target activity using Cas9 toxicity in high-throughput screens. Nature communications. 2017;8:15178. doi: 10.1038/ncomms15178. [DOI] [PMC free article] [PubMed] [Google Scholar]
- 6.Han W, et al. Identification of eight genes encoding chemokine-like factor superfamily members 1-8 (CKLFSF1-8) by in silico cloning and experimental validation. Genomics. 2003;81:609–617. doi: 10.1016/s0888-7543(03)00095-8. [DOI] [PubMed] [Google Scholar]
- 7.Sanchez-Pulido L, Martin-Belmonte F, Valencia A, Alonso MA. MARVEL: a conserved domain involved in membrane apposition events. Trends Biochem Sci. 2002;27:599–601. doi: 10.1016/s0968-0004(02)02229-6. [DOI] [PubMed] [Google Scholar]
- 8.Weekes MP, et al. Latency-associated degradation of the MRP1 drug transporter during latent human cytomegalovirus infection. Science. 2013;340:199–202. doi: 10.1126/science.1235047. [DOI] [PMC free article] [PubMed] [Google Scholar]
- 9.Matheson NJ, et al. Cell Surface Proteomic Map of HIV Infection Reveals Antagonism of Amino Acid Metabolism by Vpu and Nef. Cell Host Microbe. 2015;18:409–423. doi: 10.1016/j.chom.2015.09.003. [DOI] [PMC free article] [PubMed] [Google Scholar]
- 10.Grant BD, Donaldson JG. Pathways and mechanisms of endocytic recycling. Nat Rev Mol Cell Biol. 2009;10:597–608. doi: 10.1038/nrm2755. [DOI] [PMC free article] [PubMed] [Google Scholar]
- 11.van Weert AW, Geuze HJ, Groothuis B, Stoorvogel W. Primaquine interferes with membrane recycling from endosomes to the plasma membrane through a direct interaction with endosomes which does not involve neutralisation of endosomal pH nor osmotic swelling of endosomes. Eur J Cell Biol. 2000;79:394–399. doi: 10.1078/0171-9335-00062. [DOI] [PubMed] [Google Scholar]
- 12.Arjonen A, Alanko J, Veltel S, Ivaska J. Distinct recycling of active and inactive beta1 integrins. Traffic. 2012;13:610–625. doi: 10.1111/j.1600-0854.2012.01327.x. [DOI] [PMC free article] [PubMed] [Google Scholar]
- 13.Tumeh PC, et al. PD-1 blockade induces responses by inhibiting adaptive immune resistance. Nature. 2014;515:568–571. doi: 10.1038/nature13954. [DOI] [PMC free article] [PubMed] [Google Scholar]
- 14.Homet Moreno B, Parisi G, Robert L, Ribas A. Anti-PD-1 therapy in melanoma. Semin Oncol. 2015;42:466–473. doi: 10.1053/j.seminoncol.2015.02.008. [DOI] [PubMed] [Google Scholar]
- 15.Li CW, et al. Glycosylation and stabilization of programmed death ligand-1 suppresses T-cell activity. Nature communications. 2016;7:12632. doi: 10.1038/ncomms12632. [DOI] [PMC free article] [PubMed] [Google Scholar]
- 16.Behren A, et al. The Ludwig institute for cancer research Melbourne melanoma cell line panel. Pigment Cell Melanoma Res. 2013;26:597–600. doi: 10.1111/pcmr.12097. [DOI] [PubMed] [Google Scholar]
- 17.Woods K, Cebon J. Tumor-specific T-cell help is associated with improved survival in melanoma. Clin Cancer Res. 2013;19:4021–4023. doi: 10.1158/1078-0432.CCR-13-1349. [DOI] [PubMed] [Google Scholar]
- 18.Boutros C, et al. Safety profiles of anti-CTLA-4 and anti-PD-1 antibodies alone and in combination. Nat Rev Clin Oncol. 2016;13:473–486. doi: 10.1038/nrclinonc.2016.58. [DOI] [PubMed] [Google Scholar]
- 19.Mahoney KM, Rennert PD, Freeman GJ. Combination cancer immunotherapy and new immunomodulatory targets. Nat Rev Drug Discov. 2015;14:561–584. doi: 10.1038/nrd4591. [DOI] [PubMed] [Google Scholar]
Associated Data
This section collects any data citations, data availability statements, or supplementary materials included in this article.
Supplementary Materials
Data Availability Statement
The CRISPR screen sequencing data has been deposited to the NCBI short read archive under the accession number PRJNA361422. Source data re provided for figures 1-4 and extended data figures 2, 5-7, 9&10. Complete mass spectrometry datasets are provided in the supplementary information.


