

Abstract
RNA plays important and diverse roles in biology, but molecular tools to manipulate and measure RNA are limited. For example, RNA interference (RNAi)1-3 can efficiently knockdown RNAs, but it is prone to off-target effects4, and visualizing RNAs typically relies on the introduction of exogenous tags5. Here, we demonstrate that the class 2 type VI6,7 RNA-guided RNA-targeting CRISPR-Cas effector Cas13a8 (previously known as C2c2) can be engineered for mammalian cell RNA knockdown and binding. After initial screening of fifteen orthologs in E. coli, we identified Cas13a from Leptotrichia wadei (LwaCas13a) as the most effective. LwaCas13a can be heterologously expressed in mammalian and plant cells for targeted knockdown of either reporter or endogenous transcripts. We demonstrate that LwaCas13a is capable of providing comparable levels of knockdown as RNAi, but with dramatically improved specificity. Moreover, catalytically inactive LwaCas13a maintains targeted RNA binding, allowing for programmable tracking of transcripts in live cells. Our results establish CRISPR-Cas13a as a flexible platform for RNA targeting with wide applicability for studying RNA in mammalian cells.
Previous work has shown that Cas orthologs exhibit varying degrees of activity in bacterial and mammalian cells9. We therefore evaluated fifteen Cas13a orthologs for PFS preference and activity (Extended Data Fig. 1a) using a previously described ampicillin resistance bacterial assay8 (Fig. 1a). Cas13a-mediated cleavage of the ß-lactamase (ampicillin resistance) transcript results in bacterial death under ampicillin selection, which can be measured by quantifying surviving colonies. Using this approach, we found that the Cas13a ortholog from L.wadei (LwaCas13a) was most active, followed by the previously characterized LshCas13a (Fig. 1b and Extended Data Fig. 1b)8. Next generation sequencing analysis of the PFS distributions from LwaCas13a and LshCas13a screens revealed that most LwaCas13a PFS sequences were depleted (Extended Data Fig. 1c-e), suggesting robust LwaCas13a RNA cleavage activity. Indeed, motif analysis of the depleted PFS sequences at varying thresholds revealed the expected 3′ H motif of LshCas13a, but no significant PFS motif for LwaCas13a (Fig. 1c and Extended Data Fig. 1f,g). Consistent with these results, LwaCas13a was also found to be more active than LshCas13a in our recent work developing a nucleic acid sensor and exhibited a weak 3′ H PFS when biochemically characterized10. Because of its high activity and lack of PFS in bacteria, we focused on LwaCas13a for further development.
Figure 1. Cas13a from Leptotrichia wadei (LwaCas13a) is capable of eukaryotic transcript knockdown.
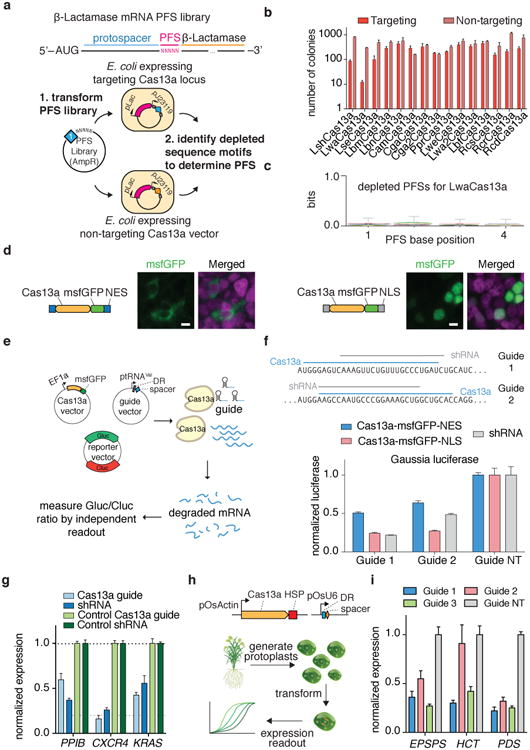
a, Schematic of PFS characterization screen on Cas13a orthologs. b, Quantitation of Cas13a activity in E. coli measured by colony survival from PFS screen. c, in vivo PFS screening shows LwaCas13a has a minimal PFS preference. Error bars indicate an approximate Bayesian 95% confidence interval. d, Imaging showing localization and expression of each of the mammalian constructs. Scale bars, 10μm. e, Schematic of the mammalian luciferase reporter system used to evaluate knockdown. f, Knockdown of Gaussia luciferase (Gluc) using engineered variants of LwaCas13a. Sequences for guides and shRNAs are shown above. g, Knockdown of three different endogenous transcripts with LwaCas13a compared against corresponding RNAi constructs. h, Schematic for LwaCas13a knockdown of transcripts in rice (Oryza sativa) protoplasts. i, LwaCas13a knockdown of three transcripts in O. sativa protoplasts using three targeting guides per transcript. All values are mean ± SEM with n = 3, unless otherwise noted.
In vitro cleavage reactions with LwaCas13a demonstrated programmable RNA cleavage with a crRNA encoding a 28 nt spacer, shorter than the 29-30 nt length found in the native L. wadei CRISPR array,(Extended Data Figure 2a), confirmed the dramatically higher cleavage efficiency of LwaCas13a over LshCas13a (Extended Data Fig 2b-c), and exhibited similar biochemical characteristics for the two enzymes (Extended Data Fig. 2d-g and Supplementary Note 1). We found that LwaCas13a could cleave the corresponding pre-crRNA transcript from L. wadei (Extended Data Fig. 2h). We also explored the crRNA constraints on LwaCas13a cleavage by truncating the spacer and found that LwaCas13a retained in vitro cleavage activity with spacer lengths as short as 20 nt (Extended Data Fig. 2i). Although guide lengths less than 20 nt no longer display catalytic activity, the LwaCas13-crRNA complex may still retain binding activity, providing an opportunity for orthogonal applications with a single catalytic enzyme 11.
We next evaluated the ability of LwaCas13a to cleave transcripts in mammalian cells. We cloned mammalian codon-optimized LwaCas13a into mammalian expression vectors with msfGFP fusions on the C- or N-terminus and either a dual-flanking nuclear export sequence (NES) or nuclear localization sequence (NLS) and evaluated expression and localization (Fig. 1d). We found that msfGFP-fused LwaCas13a constructs expressed well and localized effectively to the cytoplasm or nucleus according to the localization sequence. To evaluate the in vivo cleavage activity of LwaCas13a we developed a dual luciferase reporter system, which expresses both Gaussia luciferase (Gluc) and Cypridinia luciferase (Cluc) under different promoters on the same vector, allowing one transcript to serve as the Cas13a target and the other to serve as a dosing control (Fig. 1e). We then designed guides against Gluc and cloned them into a tRNAVal-promoter-expressing guide vector. We transfected the LwaCas13a expression vector, guide vector, and dual-luciferase construct into HEK293FT cells and measured luciferase activity at 48 hours post-transfection. We found that nuclear-localized LwaCas13a-msfGFP resulted in the highest levels of knockdown (75.7% for guide 1, 72.9% for guide 2), comparable to position-matched shRNA controls (78.3% for guide 1, 51.5% for guide 2) (Fig. 1f), which control for accessibility and sequence in the target region. Because of the superior cleavage of the LwaCas13a-msfGFP-NLS construct, we used this design for all further knockdown experiments. We also find that LwaCas13a yields greatest Gluc knockdown with a spacer length of 28 nt (73.8%) (Extended Data Fig. 3a), that knockdown is dose-responsive to both the protein and guide transfected vector amounts (Extended Data Fig. 3b,c), and that knockdown is not sensitive to RNA polymerase III promoter choice. (Extended Data Fig. 3d).
We next tested knockdown in HEK293FT cells on three endogenous genes: KRAS, CXCR4, and PPIB. We observed varying levels of knockdown, and for KRAS and CXCR4, LwaCas13a knockdown (40.4% for PPIB, 83.9% for CXCR4, 57.5% for KRAS) was similar to RNAi with position-matched shRNAs (63.0% for PPIB, 73.9% for CXCR4, 44.3% for KRAS) (Fig. 1g). We also found that knockdown of KRAS was flexible to guide promoter choice (Extended Data Fig. 3e), that LwaCas13a knockdown was possible in the A375 melanoma cell line (Extended Data Fig. 3f), and that knockdown was due to the catalytic activity of the LwaCas13a (Extended Data Fig. 3g) (Supplementary Note 2). Additionally, we tested if LwaCas13a knockdown is efficient in plants. We designed guides against transcripts for rice (Oryza sativa) genes and co-transfected LwaCas13a and guide vectors into O. sativa protoplasts (Fig. 1h). After transfection, we observed >50% knockdown of for all three genes and 7 out of 9 guides tested, with maximal knockdown of 78.0% (Fig. 1i). Together, these results suggest that LwaCas13a is able to mediate similar levels of RNA knockdown as RNAi.
To comprehensively characterize the dependence of RNA context on the efficiency of LwaCas13a knockdown, we harnessed the programmability of LwaCas13a to tile guides along the length of four transcripts: Gluc, Cluc, KRAS, and PPIB (Fig. 2a). The Gluc and Cluc screens revealed guides with greater than 60% knockdown (Fig. 2b,c), with the majority of Gluc targeting guides exhibiting>50% knockdown and up to 83% knockdown. To compare LwaCas13a knockdown with RNAi, we selected the top three performing guides against Gluc and Cluc and compared them to position-matched shRNAs. We found that five out of six top performing guides achieved significantly higher levels of knockdown (p <0.05) than their matched shRNA (Extended Data Fig. 3h). For KRAS and PPIB, we found that, while knockdown efficiency was transcript dependent, there was maximal knockdown of 85% and 75% for KRAS and PPIB, respectively (Fig. 2d,e).
Figure 2. LwaCas13a arrayed screening of mammalian coding and non-coding RNA targets and multiplexed guide delivery.

a, Schematic of LwaCas13a arrayed screening. b-e, Arrayed knockdown screen of 186 guides evenly tiled across the Gluc transcript (b) or 93 guides evenly tiled across each of the Cluc (c), KRAS (d), and PPIB (e) transcripts. f, Validation of the top three guides from the endogenous arrayed knockdown screens with shRNA comparisons. All values are mean ± SEM with n = 3. ***p< 0.001; **p < 0.01; two-tailed student's T-test). g, Arrayed knockdown screen of 93 guides evenly tiled across the MALAT1 transcript. h, Validation of top three guides from the endogenous arrayed MALAT1 knockdown screen with shRNA comparisons. i, Multiplexed delivery of five guides in a CRISPR array against five different endogenous genes under the expression of a single promoter is capable of robust knockdown. j, Multiplexed delivery of three guides against three different endogenous genes or with constructs replacing each of the guides with a non-targeting sequence shows specific knockdown of the genes targeted. All values are mean ± SEM with n = 3.
To further understand the efficiency of LwaCas13a knockdown versus RNAi, we compared a variety of guides to shRNA constructs that were position matched to the same target region. We selected the top three guides from each of the endogenous tiling screens (KRAS and PPIB) and observed robust knockdown with LwaCas13a (53.7%-88.8%) equivalent to levels attained by shRNA knockdown (61.8%-95.2%), with shRNA significantly better for 2 out of 6 guides (p <0.01) and LwaCas13a significantly better for 2 out of 6 guides (p <0.01) (Fig. 2f).
One limitation of current RNAi technology is the difficulty of targeting nuclear transcripts. We leveraged the ability of LwaCas13a to function in different cellular compartments to knockdown MALAT1 and XIST, which are localized to the nucleus 13, and found varying levels of knockdown, with up to as much as 50% knockdown for MALAT1 and 83.9% knockdown for XIST (Fig. 2g and Extended Data Fig. 3i), more effective than position-matched shRNAs, which showed no detectable knockdown (p > 0.05) (Fig. 2h). LshCas13a activity is governed by target accessibility in E. coli8, and we therefore used our data from the four tiling screens to investigate whether LwaCas13a activity is higher for guides located in regions of accessibility. The most effective guides were closer together than expected by chance (Extended Data Fig. 4a) and that predicted target accessibility could explain some of the variation in targeting efficacy (4.4%-16% of the variation in knockdown) (Extended Data Fig. 4b-d and Supplementary Note 2).
Because LwaCas13a can process also its own pre-crRNA, we tested multiplexed delivery of LwaCas13a guides as a CRISPR array expressed under a single promoter. We designed five different guides against the endogenous PPIB, CXCR4, KRAS, TINCR, and PCAT transcripts and delivered the targeting system as a CRISPR array with 28-nt guides flanked by 36-nt DR, representing an unprocessed DR and a truncated spacer, under expression of the U6 promoter. With this approach, we found levels of knockdown for each gene that were comparable to single or pooled guide controls (Fig. 2i). To evaluate specificity in this context, we tested multiplexed delivery of three guides against PPIB, CXCR4, and KRAS or three variants where each one of the three guides was replaced with a non-targeting guide. We found that in each case where a guide was absent from the array, only the targeted transcripts were knocked down by LwaCas13a (Fig. 2j).
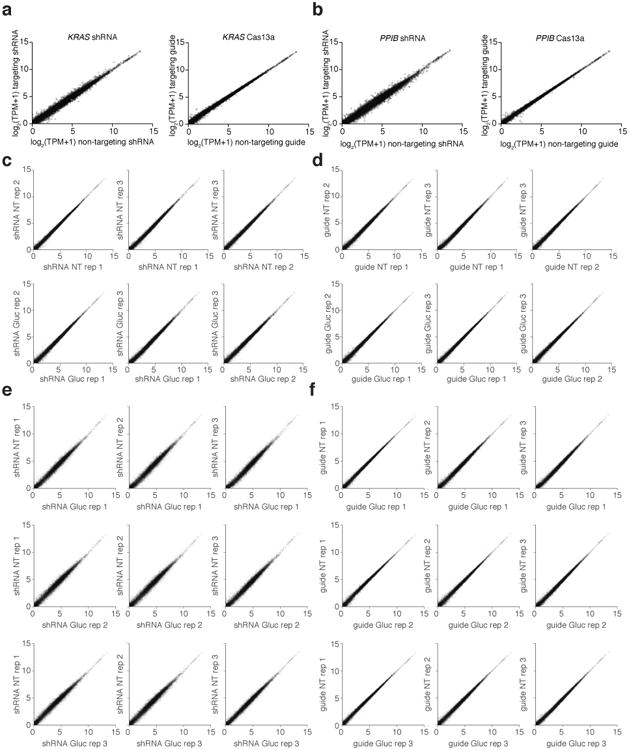
To investigate the specificity of Cas13a in vivo, we introduced single mismatches into guides targeting either Gluc (Fig. 3a) or endogenous genes (Fig. 3b, Extended Data Fig. 5a-b),as well as double mismatches (Fig. 3c and Extended Fig. 5c), and found that knockdown was sensitive to mismatches in the central seed region of the guide:target duplex, which we additionally confirmed by biochemical profiling (Data Fig 5d-k and Supplementary Note 3). To comprehensively search for off-target effects of LwaCas13a knockdown, we performed transcriptome-wide mRNA sequencing. We targeted the Gluc transcript with LwaCas13a or a position matched-shRNA construct, and found significant knockdown of the target transcript (p <.01) (Fig. 3d,e). Similar results were found for the same comparison on two endogenous genes KRAS and PPIB (p < .05) (Extended Data Figure 6a,b). We characterized the number of significant off-targets by differential expression analysis and found hundreds of off-targets in each of the shRNA conditions but zero off-targets in LwaCas13a conditions (Fig. 3f), despite comparable levels of knockdown of the target transcripts (30.5%, 43.5%, and 64.7% for shRNA, 62.6%, 27.1%, and 29.2% for Cas13a, for Gluc, KRAS, and PPIB, respectively) (Fig. 3g). We performed additional analysis of the Gluc targeting RNA-seq comparisons and found that the shRNA libraries show higher variability between targeting and non-targeting conditions compared to Cas13a because of off-target effects (Extended Data Fig. 6c-f, 7 and Supplementary Note 4).
Figure 3. Evaluation of LwaCas13a knockdown specificity and comparisons to RNA interference.
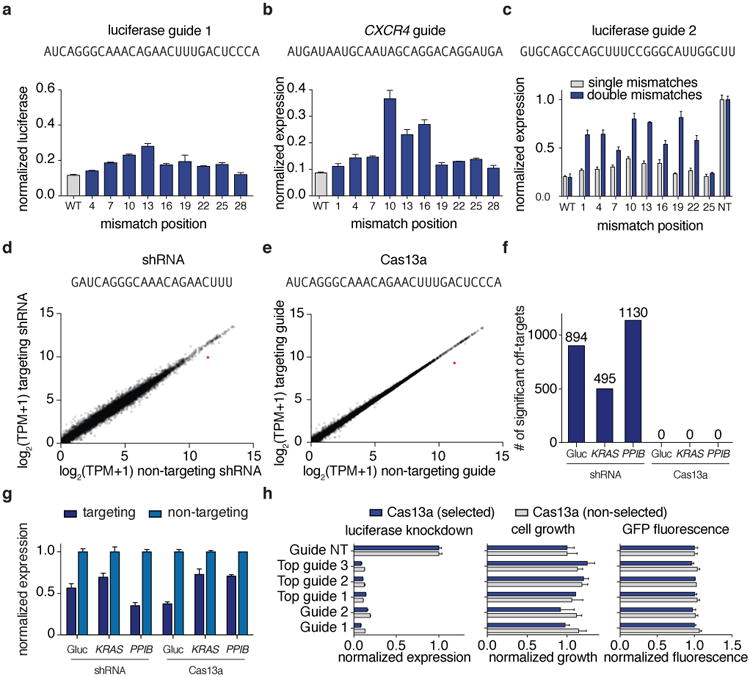
a, b Knockdown of Gluc (a) or CXCR4 (b) evaluated with guides containing single mismatches at varying positions across the spacer sequence (shown above). c, Knockdown of Gluc evaluated with guide 3 containing single or double mismatches at varying positions across the spacer sequence (shown above). d, e Expression levels in log2(transcripts per million (TPM)) values of all genes detected in RNA-seq libraries of non-targeting control (x-axis) compared to Gluc-targeting condition (y-axis) for shRNA (d) and LwaCas13a (e). Shown is the mean of three biological replicates. The Gluc transcript data point is colored in red. The guide sequence used is shown above. f, Differential gene expression analysis of six RNA-seq libraries (each with three biological replicates) comparing LwaCas13a knockdown to shRNA knockdown at three different genes. g, Quantified mean knockdown levels for the targeted genes from the RNA seq libraries. h, Luciferase knockdown (left), cell viability (middle), and LwaCas13a-GFP expression (right) for cells transfected with LwaCas13a for 72 hours with and without selection. All values are mean ± SEM with n = 3.
The multiplexed leave-one-out and RNA-seq analyses suggested a lack of sequence-specific RNA degradation. We wanted to further confirm a lack of sequence-specific off-target cleavage as a result of LwaCas13a targeting by re-analyzing the knockdown tiling screens (Fig. 2b-e) and found that the gene control expression in the luciferase and endogenous knockdown screens had no significant correlation to expression of the gene targeted for knockdown (Gluc: R=-0.078, p > 0.05; PPIB: R= -0.058, p > 0.05; KRAS: R= -0.51, p < 0.001) (Extended Data Fig. 8a-h), in contrast to what would be expected if the collateral effect were present.
The collateral activity of LshCas13a has been directly observed biochemically in vitro and indirectly through growth suppression in bacteria8, but the extent of this activity in mammalian cells is unclear. We saw no sequence-specific off-target LwaCas13a activity in our RNA sequencing experiments, and LwaCas13a-mediated knockdown of targeted transcripts did not affect the growth of mammalian cells expressing similar levels of LwaCas13a (Fig. 3h). Additionally, there were no detectable gene expression changes, indicating that the presence of LwaCas13a targeting does not lead to an observable cell stress response at the transcriptomic level14 (Fig. 3d,e and Extended Data Fig. 6a,b). Because activation of non-specific RNA nucleases in mammalian cells results in detectable changes in RNA size distribution15, we examined global RNA degradation in cells after LwaCas13a knockdown of Gluc transcripts and found no difference in the RNA integrity between targeting and non-targeting conditions from LwaCas13a knockdown experiments (p > 0.05) (Extended Data Fig 8i,j) (Supplementary Note 4).
We mutated catalytic arginine residues in LwaCas13a to generate dCas13a and quantified RNA binding by dCas13a with RNA immunoprecipitation (RIP) (Fig. 4a) using guides containing the 36-nt DR and 28-nt spacers. We found that pulldown of dCas13a targeted to either luciferase transcripts or ACTB mRNA (Fig. 4b) resulted in significant enrichment of the corresponding target over non-targeting controls (7.8-11.2× enrichment for luciferase and 2.1-3.3× enrichment for ACTB; p < 0.05), validating dCas13a as a reprogrammable RNA binding protein.
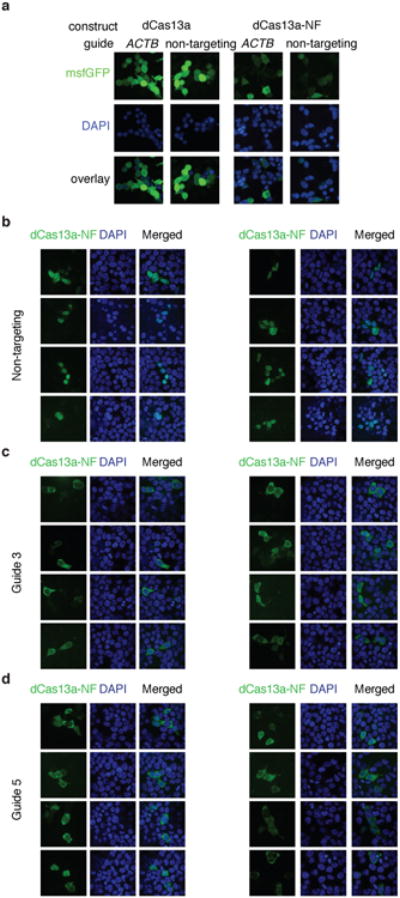
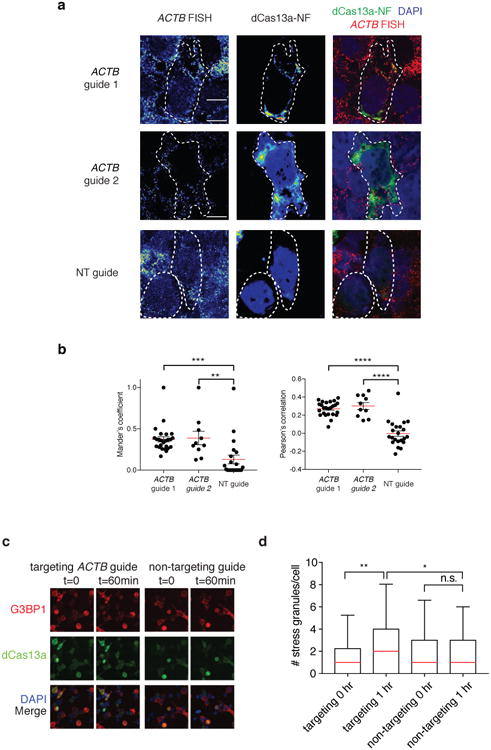
Figure 4. Catalytically-inactive LwaCas13a (dCas13a) is capable of binding transcripts and tracking stress granule formation.
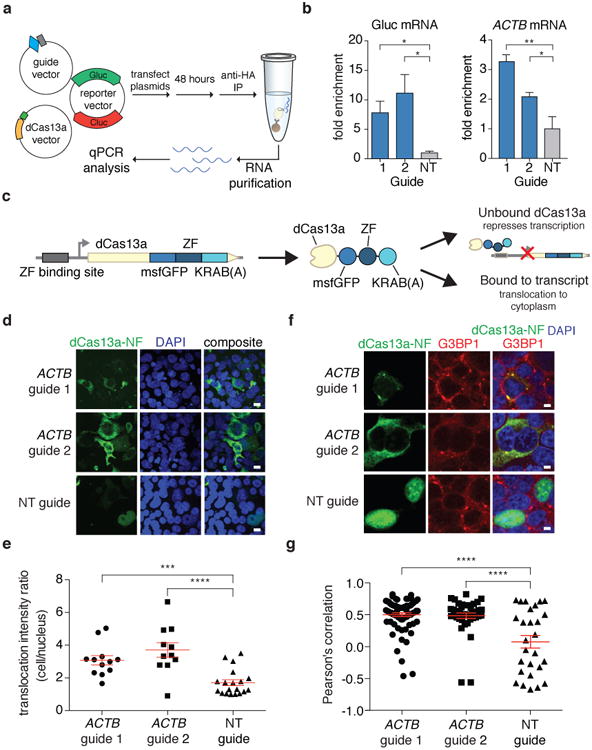
a, Schematic of RNA immunoprecipitation for quantitation of dCas13a binding. b, dCas13a targeting Gluc and ACTB transcripts is significantly enriched compared to non-targeting controls. c, Schematic of dCas13a-GFP-KRAB construct used for negative-feedback imaging. d, Representative images for dCas13a-GFP-KRAB imaging with multiple guides targeting ACTB. Scale bars, 10μm. e, Quantitation of translocation of dCas13a-GFP-KRAB. f, Representative immunofluorescence images of HEK293FT cells treated with 400 uM sodium arsenite. Stress granules are indicated by G3BP1 staining. Scale bars, 5μm. g, G3BP1 and dCas13a-GFP-KRAB co-localization quantified per cell by Pearson's correlation. All values are mean ± SEM with n = 3. ****p< 0.0001; ***p< 0.001; **p< 0.01; *p< 0.05. ns = not significant. A one-tailed student's t-test was used for comparisons in (b) and a two-tailed student's t-test was used for comparisons in (e) and (g).
To engineer dCas13a for in vivo imaging and reduce background noise due to unbound protein, we incorporated a negative-feedback system based upon zinc finger self-targeting and KRAB domain repression 16 (Fig. 4c and Supplementary Note 5). In comparison to dCas13a, dCas13a-NF effectively re-localized when targeted to ACTB mRNA (Extended Data Fig. 9a). To further characterize translocation of dCas13a-NF, we targeted ACTB transcripts with two guides and found that both guides increased translocation compared to a non-targeting guide (3.1-3.7× cellular/nuclear signal ratio; p < 0.001) (Fig. 4d,e and Extended Data Fig. 9b-d). To further validate dCas13a-NF imaging, we analyzed the correlation of dCas13a-NF signal to ACTB mRNA fluorescent in situ hybridization (FISH) signal (Extended Data Fig. 10a) and found that there was significant correlation and signal overlap for the targeting guides versus the non-targeting guide conditions (R = 0.27 and 0.30 for guide 1 and 2, respectively, and R = 0.00 for the non-targeting guide condition; p < 0.0001) (Extended Data Fig. 10b). To observe a phenotype for mRNA tracking, we investigated the accumulation of mRNA into stress granules17,18 by combining dCas13a-NF imaging of transcripts with visualization of stress granules marker G3BP121. In fixed samples, we found significant correlations between the dCas13a-NF signal and the G3BP1 fluorescence for ACTB-targeting guides compared to non-targeting controls (R = 0.49 and 0.50 for guide 1 and guide 2, respectively, and 0.08 for the non-targeting guide; p < 0.001) (Fig. 4f-g) Given co-localization in fixed samples, we next performed stress granule tracking in live cells and found that dCas13a-NF targeted to ACTB localized to significantly more stress granules per cell over time than the corresponding non-targeting control (p < 0.05) (Extended Data Fig. 10c-d and Supplementary Note 6).
The class 2 type VI CRISPR-Cas effector Cas13a can be effectively reprogrammed with guide RNAs to knockdown or bind transcripts in mammalian cells. Cas13a knockdown is comparable to RNAi knockdown efficiency, but with drastically reduced off-targets, and is a versatile platform with the ability for nuclear RNA knockdown, multiplexed gene knockdown, and further engineering of the protein for improved functionality. Importantly, we do not observe any evidence for collateral activity of LwaCas13a in mammalian cells (Supplementary Note 4). RNA knockdown with Cas13a can be applied to perturbing RNAs in multiple biological contexts, including genome-wide pooled knockdown screening, interrogation of lncRNA and nascent transcript function, allele-specific knockdown, and RNA viral therapeutics. In addition, dCas13a and derivatives enable RNA pulldown to study RNA-protein interactions, imaging via reconstitution of split fluorophores, translational modulation, RNA base editing, epitranscriptomic perturbation, splicing modulation, or targeted induction of apoptosis based on RNA expression levels, which would be useful for studying specific cell populations or killing cancerous cells. We have shown Cas13a to be a robust platform for both programmable knockdown and binding of RNAs in mammalian and plant cells, suggesting it may be generally extended to other eukaryotic organisms, paving the way for a range of transcriptome analysis tools.
Methods
Cloning of orthologs for activity screen and recombinant expression
We synthesized human codon-optimized versions of fifteen Cas13a orthologs (Genscript, Jiangsu, China) (Supplementary Table 9) and cloned them into pACYC184 under expression by a pLac promoter. Adjacent to the Cas13a expression cassette, we cloned the ortholog's corresponding direct repeats flanking either a β-lactamase targeting or non-targeting spacer. Spacer array expression was driven by the J23119 promoter.
For purification of LwaCas13a, we cloned the mammalian codon-optimized LwaCas13a sequence into a baterial expression vector for protein purification (6× His/Twin Strep SUMO, a pET-based expression vector received as a gift from Ilya Finkelstein, University of Texas-Austin).
All plasmids used in this study are listed in Supplementary Table 2. Information on Cas13a orthologs used in this study can be found in Supplementary Table 9.
Bacterial in vivo testing for Cas13a activity and PFS identity
Briefly, Cas13a is programmed to target a 5′ stretch of sequence on the β-lactamase transcript flanked by randomized PFS nucleotides. Cas13a cleavage activity results in death of bacteria under ampicillin selection and PFS depletion is subsequently analyzed by next generation sequencing. In order to allow for quantitative comparisons between orthologs, we cloned each Cas13a ortholog under a pLac promoter along with a single-spacer CRISPR array nearby under expression of the pJ23119 small RNA promoter.
To test for activity of Cas13a orthologs, 90 ng of ortholog expression plasmids, with either targeting or non-targeting guide, was co-transformed with 25 ng of a previously described β-lactamase target plasmid8 into NovaBlue Singles competent cells (Millipore). Post-transformation, cells were diluted, plated on LB-agar supplemented with 100 μg/uL ampicillin and 25 μg/uL chloramphenicol, and incubated at 37°C overnight. Transformants were counted next day.
For determination of LshCas13a and LwaCas13a PFS identity, 40 ng of ortholog expression plasmids with either targeting or non-targeting spacer was co-transformed with 25 ng of β-lactamase target plasmid into 2 aliquots of NovaBlue Giga Singles (Millipore) per biological replicate. Two biological replicates were performed. Post-transformation, cells were recovered at 37°C in 500 uL of SOC (ThermoFisher Scientific) per biological replicate for 1 hour, plated on bio-assay plates (Corning) with LB-agar (Affymetrix) supplemented with 100 μg/uL ampicillin and 25 μg/uL chloramphenicol, and incubated at 37°C for 16 hours. Colonies were then harvested by scraping, and plasmid DNA was purified with NuceloBond Xtra EF (Macherey-Nagel) for subsequent sequencing.
Harvested plasmid samples were prepared for next generation sequencing by PCR with barcoding primers and Illumina flow cell handles using NEBNext High Fidelity 2X Master Mix (New England Biosciences). PCR products were pooled and gel extracted using a Zymoclean gel extraction kit (Zymo Research) and sequenced using a MiSeq next generation sequencing machine (Illumina).
Computational analysis of PFS
From next generation sequencing of the LshCas13a and LwaCas13a PFS screening libraries, we aligned the sequences flanking the randomized PFS region and extracted the PFS identities. We collapsed PFS identities to 4 nucleotides to improve sequence coverage, counted the frequency of each unique PFS, and normalized to total read count for each library with a pseudocount of 1. Enrichment of each distribution as displayed in Fig. 1e was calculated against the pACYC184 control (no protein/guide locus) as -log2(fcondition/fpACYC184), where fcondition is the frequency of PFS identities in the experimental condition and fpACYC184 is the frequency of PFS identities in the pACYC184 control. For analysis of a conserved PFS motif, top depleted PFS identities were calculated using each condition's non-targeting control as follows: -log2(fi,targeting/fi,non-targeting) where fi,targeting is the frequency of PFS identities in condition i with targeting spacer and fi,non-targeting is the frequency of PFS identities in condition i with non-targeting spacer. PFS motifs were analyzed for a range of thresholds as shown in Extended Data Figure 1d,e.
Purification of LwaCas13a
Purification of LwaCas13a was performed as previously described10. Briefly, LwaCas13a bacterial expression vectors were transformed into Rosetta 2(DE3)pLysS singles Competent Cells (Millipore) and 4 L of Terrific Broth 4 growth media (TB) was seeded with a starter culture. Cell protein expression was induced with IPTG and after overnight growth, cell pellet was harvested and stored at -80°C. Following cell lysis, protein was bound using a StrepTactin Sepharose resin (GE) and protein was eluted by SUMO protease digestion (ThermoFisher). Protein was further purified by cation exchange using a HiTrap SP HP cation exchange column (GE Healthcare Life Sciences) and subsequently by gel filtration using a Superdex 200 Increase 10/300 GL column (GE Healthcare Life Sciences), both steps via FPLC (AKTA PURE, GE Healthcare Life Sciences). Final fractions containing LwaCas13a protein were pooled and concentrated into Storage Buffer (600 mM NaCl, 50 mM Tris-HCl pH 7.5, 5% Glycerol, 2 mM DTT) and aliquots were frozen at -80°C for long-term storage.
Cloning of mammalian expression constructs
The human codon optimized Cas13a gene was synthesized (Genscript) and cloned into a mammalian expression vector with either a nuclear export sequence (NES) or nuclear localization sequence (NLS) under expression by the EF1-α promoter. Because of the stability conferred by monomeric-super-folded GFP (msfGFP), we fused msfGFP to the C-terminus of LwaCas13a. The full-length direct-repeat of LwaCas13a was used for cloning the guide backbone plasmid with expression under a U6 promoter. The catalytically-inactive LwaCas13a-msfGFP construct (dead Cas13a or dCas13a) was generated by introducing R474A and R1046A mutations in the two HEPN domains. A drug-selectable version of LwaCas13a-msfGFP was generated by cloning the protein into a backbone with Blasticidin selection marker linked to the C-terminus via a 2A peptide sequence. The negative feedback version of the dCas13a-msfGFP construct was generated by cloning zinc-finger binding site upstream of the promoter of dCas13a-msfGFP and fusing a Zinc finger and KRAB domain to the C-terminus.
The reporter luciferase construct was generated by cloning Cypridinia luciferase (Cluc) under expression by CMV and Gaussia luciferase (Gluc) under expression by EF1-α both on a single vector. Expression of both luciferases on a single vector allows one luciferase to serve as a dosing control for normalization of knockdown of the other luciferase, controlling for variation due to transfection conditions.
For the endogenous knockdown experiments in Fig. 1g, guides and shRNAs were designed using the RNAxs siRNA design algorithm22. The prediction tool was used to design shRNAs and guides were designed in the same location to allow for comparison between shRNA and Cas13a knockdown.
The rice actin promoter (pOsActin) was PCR amplified from pANIC6A23 and each Cas13a was PCR amplified from existing Cas13a constructs. These fragments were ligated into existing plant expression plasmids such that each Cas13a was driven by the rice actin promoter and transcription was terminated by the HSP terminator. Cas13a gRNAs were expressed from the rice U6 promoter (pOsU6). The gRNA target sequence was identical for each gene whereas the scaffold sequence was Cas13a-specific. In these experiments, we targeted the rice 5-enolpyruvylshikimate-3-phosphate synthase (OsEPSPS) gene, which is the target of glyphosate-based herbicides, and the rice hydroxycinnamoyl-CoA shikimate/quinate hydroxycinnamoyl transferase (OsHCT) gene, which is necessary for proper plant growth.
All guides and shRNAs used in this study are listed in Supplementary Tables 1 and 3.
Protoplast Preparation
Green rice protoplasts (Oryza sativa L. ssp. japonica var. Nipponbare) were prepared as previously described24 with slight modifications. Seedlings were grown for 14 days and protoplasts resuspended in MMG buffer containing 0.1 M CaCl2. This modified MMG buffer was used to prepare fresh 40% PEG buffer as well as in place of WI buffer. Finally, protoplasts were kept in total darkness for 48 hours post-transformation. All other conditions were as previously described.
Nucleic acid target and crRNA preparation for in vitro reactions and collateral activity
For generation of nucleic acid targets, oligonucleotides were PCR amplified with KAPA Hifi Hot Start (Kapa Biosystems). dsDNA amplicons were gel extracted and purified using a MinElute gel extraction kit (Qiagen). The resulting purified dsDNA was transcribed via overnight incubation at 30°C with the HiScribe T7 Quick High Yield RNA Synthesis kit (New England Biolabs). Transcribed RNA was purified using the MEGAclear Transcription Clean-up kit (Thermo Fisher). All RNA targets used in this study are listed in Supplementary Table 4 and 6.
To generate crRNAs, oligonucleotides were ordered as DNA (Integrated DNA Technologies) with an additional 5′ T7 promoter sequence. crRNA template DNA was annealed with a T7 primer (final concentrations 10 uM) and transcribed via overnight incubation at 37°C with the HiScribe T7 Quick High Yield RNA Synthesis kit (New England Biolabs). The resulting transcribed crRNAs were purified with RNAXP clean beads (Beckman Coulter), using a 2× ratio of beads to reaction volume, supplemented with additional 1.8× ratio of isopropanol (Sigma). crRNA constructs used for in vitro experiments study are listed in Supplementary Table 5 and crRNA constructs used for collateral detection are listed in Supplementary Table 6.
LwaCas13a cleavage and collateral activity detection
For biochemical characterization of LwaCas13a, assays were performed as previously described8. Briefly, nuclease assays were performed with 160 nM of end-labeled ssRNA target, 200 nM purified LwaCas13a, and 100 nM crRNA, unless otherwise indicated. All assays were performed in nuclease assay buffer (40 mM Tris-HCl, 60 mM NaCl, 6 mM MgCl2, pH 7.3). For array processing, 100 ng of in vitro transcribed array was used per nucelease assay. Reactions were allowed to proceed for 1 hour at 37°C (unless otherwise indicated) and were then quenched with proteinase buffer (proteinase K, 60 mM EDTA, and 4 M Urea) for 15 minutes at 37°C. The reactions were then denatured with 4.5 M urea denaturing buffer at 95°C for 5 minutes. Samples were analyzed by denaturing gel electrophoresis on 10% PAGE TBE-Urea (Invitrogen) run at 45°C. Gels were imaged using an Odyssey scanner (LI-COR Biosciences).
Collateral activity detection assays were performed as previously described25. Briefly, reactions consisted of 45 nM purified LwaCas13a, 22.5 nM crRNA, 125 nM quenched fluorescent RNA reporter (RNAse Alert v2, Thermo Scientific), 2 μL murine RNase inhibitor (New England Biolabs), 100 ng of background total human RNA (purified from HEK293FT culture), and varying amounts of input nucleic acid target, unless otherwise indicated, in nuclease assay buffer (40 mM Tris-HCl, 60 mM NaCl, 6 mM MgCl2, pH 7.3). Reactions were allowed to proceed for 1-3 hr at 37°C (unless otherwise indicated) on a fluorescent plate reader (BioTek) with fluorescent kinetics measured every 5 min.
RNA extraction and qRT-PCR
Total RNA was isolated after 48 hours of incubation using Trizol and the accompanying protocol. One nanogram of total RNA was used in the SuperScript III Plantinum SYBR Green One-Step qRT-PCR Kit (Invitrogen) using the accompanying protocol. All samples were run in technical triplicate of three biological replicates in a 384-well format on a LightCycler 480 Instrument (Roche). All PCR primers were verified as being specific based on melting curve analysis and are as follows: OsEPSPS (Os06g04280), 5′ – TTG CCA TGA CCC TTG CCG TTG TTG – 3′ and 5′ – TGA TGA TGC AGT AGT CAG GAC CTT – 3′; OsHCT (Os11g07960), 5′ – CAA GTT TGT GTA CCC GAG GAT TTG – 3′ and 5′ – AGC TAG TCC CAA TAA ATA TGC GCT – 3′; OsEF1a (Os03g08020), 5′ – CTG TAG TCG TTG GCT GTG GT – 3′ and 5′ – CAG CGT TCC CCA AGA AGA GT – 3′. Primers for OsEF1a were previously described26. All data are presented as the mean plus/minus the standard error with each sample relative to the expression of EF1a.
Cloning of tiling guide screens
For tiling guide screens, spacers were designed to target mRNA transcripts at even intervals to fully cover the entire length of the transcript. Spacers were ordered from IDT, annealed, and golden-gate cloned into LwaCas13a guide expression constructs with either a tRNAval promoter, for Gluc and Cluc screens, or U6 promoter, for all endogenous screens.
Mammalian cell culture and transfection for knockdown with LwaCas13a
All mammalian cell experiments were performed in the HEK293FT line (ATCC) unless otherwise noted. HEK293FT cells were cultured in Dulbecco's Modified Eagle Medium with high glucose, sodium pyruvate, and GlutaMAX (Thermo Fisher Scientific) supplemented with 10% fetal bovine serum (VWR Seradigm) and 1X Penicillin-Streptomycin (Thermo Fisher Scientific). Cells were passaged to maintain confluency below 70%. For experiments involving A375 (ATCC), cells were cultured in RPMI Medium 1640 (Thermo Fisher Scientific) supplemented with 9% fetal bovine serum (VWR Seradigm) and 1X Penicillin-Streptomycin (Thermo Fisher Scientific).
To test knockdown of endogenous genes, Lipofectamine 2000 (Thermo Fisher Scientific) transfections were performed with 150 ng of LwaCas13a plasmid and 250 ng of guide plasmid per well, unless otherwise noted. Experiments testing knockdown of reporter plasmids were supplemented with 12.5 ng reporter construct per well. 16 hours prior to transfection, cells were plated in 96-well plates at approximately 20,000 cells/well and allowed to grow to 90% confluency overnight. For each well, plasmids were combined with Opti-MEM® I Reduced Serum Medium (Thermo Fisher) to a total of 25 uL, and separately 0.5 uL of Lipofectamine 2000 was combined with 24.5 uL of Opti-MEM. Plasmid and lipofectamine solutions were then combined, incubated for 5 min, and slowly pipetted onto cells to prevent disruption.
Transformation of green rice protoplasts
For the green rice experiments, plasmids expressing each LwaCas13a and the corresponding guide RNA were mixed in equimolar ratios such that a total of 30mg of DNA was used to transform a total of 200,000 protoplasts per transformation.
Measurement of luciferase activity
Media containing secreted luciferase was harvested at 48 hours post transfection, unless otherwise noted. Media was diluted 1:5 in PBS and then luciferase activity was measured using the BioLux Cypridinia and Biolux Gaussia luciferase assay kits (New England Biolabs) on a Biotek Synergy 4 plate reader with an injection protocol. All replicates were performed as biological replicates.
Harvest of total RNA and quantitative PCR
For gene expression experiments, cell harvesting and reverse transcription for cDNA generation was performed using a previously described modification27 of the commercial Cells-to-Ct kit (Thermo Fisher Scientific) 48 hours post-transfection. Transcript expression was then quantified with qPCR using Fast Advanced Master Mix (Thermo Fisher Scientific) and TaqMan qPCR probes (Thermo Fisher Scientific, Supplementary Table 7 and 8) with GAPDH control probes (Thermo Fisher Scientific). All qPCR reactions were performed in 5uL reactions with 4 technical replicates in 384-well format, and read out using a LightCycler 480 Instrument II (Roche). For multiplexed targeting reactions, readout of different targets was performed in separate wells.
Expression levels were calculated by subtracting housekeeping control (GAPDH) Ct values from target Ct values to normalize for total input, resulting in ΔCt levels. Relative transcript abundance was computed as 2˄(-ΔCt). All replicates were performed as biological replicates
For analysis of RNA quality post-knockdown with LwaCas13a, total RNA was harvested by lysing cells using TRI Reagent® and purifying the RNA using the Direct-zol RNA MiniPrep Plus kit (Zymo). 4 ng of total RNA was analyzed using a RNA 6000 Pico Bioanalyzer kit (Agilent).
Computational analysis of target accessibility
To first analyze target accessibility, top guides from the tiling screen were analyzed to determine whether they grouped closer together than expected under the assumption that if there were regions of accessibility, multiple guides in that region would be expected to be highly active. Top guides were defined as the top 20% performing guides for the Gluc tiling screen and top 30% performing guides for the Cluc, KRAS, and PPIB tiling screens. A null probability distribution was generated for pair-wise distances between guides by randomly simulated 10,000 guide positions and then compared to experimentally determined top guide pair-wise distances.
Accessibility was predicted using the RNApl fold algorithm in the Vienna RNA software suite28. The default window size of 70 nt was used and probability of a target region being unpaired was calculated as the average of the 28 single-nucleotide unpaired probabilities across the target region. These accessibility curves were smoothened and compared to smoothened knockdown curves across each of the four transcripts and correlations between the two factors were computed using Pearson's correlation coefficient. The probability space of these two factors was also visualized by performing 2D kernel density estimation across the two variables.
RNA sequencing and analysis
For specificity analysis of LwaCas13a knockdown,RNA sequencing was performed on mRNA from knockdown experiments involving both LwaCas13a and shRNA constructs. Total RNA was prepared from transfection experiments after 48 hours using the Qiagen RNeasy Plus Mini mit. mRNA was then extracted using the NEBNext Poly(A) mRNA Magnetic Isolation Module and RNA-seq libraries were prepared using the NEBNext Ultra Directional RNA Library Prep Kit for Illumina. RNA-sequencing libraries were sequenced on an Illumina NextSeq instrument with at least 10M reads per library.
An index was generated using the RefSeq GRCh38 assembly and reads were aligned and quantified using Bowtie and RSEM v1.2.31 using default parameters29. Transcript per million (TPM) values were used for expression counts and were transformed to log-space by taking the log2(TPM+1).
To find differentially expressed genes, Student's t-test was performed on the three targeting replicates versus the three non-targeting replicates. The statistical analysis was only performed on genes that had a log2(TPM+1) value greater than 2.5 in at least two of the 6 replicates. Only genes that had a differential expression greater than 2 or less than 0.75 and a false discovery rate < 0.10 were reported to be significantly differentially expressed.
Cross-correlations between replicates and averages of replicates were performed using Kendall's tau coefficient. The variation of shRNA vs Cas13a libraries was analyzed by considering the distribution of standard deviations for gene expression across the 6 replicates (3 targeting and 3 non-targeting replicates) and plotted as violin plots.
Cell viability assay
Mammalian cells were transfected with luciferase reporter target, guide plasmid, and either LwaCas13a or drug-selectable LwaCas13a. 24 hours post-transfection, cells were split 1:5 into fresh media and drug-selectable LwaCas13a samples were supplemented with 10 ug/mL Blasticidin S (Thermo Fisher Scientific). After 48 hours of additional growth, cells were assayed for luciferase knockdown, maintenance of LwaCas13a expression via GFP fluorescence measurement on a multimode plate reader (Biotek Neo2), and cell growth by CellTiter-Glo® Luminescent Cell Viability Assay (Promega).
Quantifying dCas13a binding with RIP
For RNA immunoprecipitation experiments, HEK293FT cells were plated in 6-well plates and transfected with 1.3 ug of dCas13a expression plasmid and 1.7 ug of guide plasmid, with an additional 150 ng of reporter plasmid for conditions involving reporter targeting. 48 hours post transfection, cells were washed twice with ice-cold PBS (Sigma) and fixed with 0.2% paraformaldehyde (Electron Microscopy Sciences) in PBS for 15 min at room temperature. After fixation, the paraformaldehyde was removed, 125 mM glycine in PBS was added to quench crosslinking, and the cells were incubated for 10 minutes. Cells were washed twice again with ice-cold PBS, harvested by scraping, and the cell suspension was centrifuged at 800 g for 4 min to pellet the cells. The supernatant was removed and the pellet was washed with PBS prior to lysis. Cells were lysed with 200 μL of 1X RIPA Buffer (Cell Signaling) supplemented with cOmplete™ ULTRA Tablets, EDTA-free (Sigma) and Ribonuclease inhibitor (Sigma R1158). Cells were allowed to lyse on ice for 10 min and then sonicated for 2 min with a 30 sec on/30 sec off cycle at low intensity on a Bioruptor sonicator (Diagenode). Insoluble material pelleted by centrifugation at 16,000 g for 10 min at 4°C, and the supernatant containing cleared lysate was used for pulldown with magnetic beads.
To conjugate antibodies to magnetic beads, 100 μL/sample of Dynabeads® Protein A for Immunoprecipitation (Thermo Fisher Scientific) were pelleted by application of a magnet, and the supernatant was removed. Beads were resuspended in 200 μL of wash buffer (PBS supplemented with 0.02% Tween-20 (Sigma)) and 5 μg of rabbit anti-Mouse IgG (Sigma M7023) was added. The sample was incubated for 10 min at room temperature on a rotator to allow antibody to conjugate to the beads. After incubation, beads were pelleted via magnet, supernatant was removed, and beads were washed twice with wash buffer. The pellet was resuspended in 100 μL wash buffer and split into two 50 μL volumes for conjugation of anti-HA antibody (Thermo Fisher Scientific 26183) or IgG antibody control (Sigma I5381). For each antibody, 2.5 μg of antibody was added with 200 μL wash buffer and incubated for 10 min at room temperature on a rotator. Post-incubation, beads were pelleted via magnet and washed twice with wash buffer, and resuspended in 200 μL 1X RIPA with Ribonuclease inhibitor (Sigma R1158) and protease inhibitor cocktail (Sigma P8340). 100 μL of sample lysate was added to beads and rotated overnight at 4°C.
After incubation with sample lysate, beads were pelleted, washed three times with 1X RIPA, 0.02% Tween-20, and then washed with DNase buffer (350 mMTris-HCl [pH 6.5]; 50 mM MgCl2; 5 mM DTT). Beads were resuspended in DNase buffer and TURBO DNase (Life Technologies) was added to final concentration of 0.08 units/μl. DNase was incubated 30 min at 37C on a rotator. Proteins were then digested by addition of Proteinase K (New England Biosciences) to a final concentration of 0.1 units/μl and incubated at 37°C with rotation for an additional 30 min. For denaturation and purification, urea (Sigma) was added to a final concentration of 2.5 M, samples were incubated for 30 min, and RNA was purified using a Direct-Zol RNA miniprep (Zymo Research). Purified RNA was reverse transcribed to cDNA using the qScript Flex cDNA (Quantabio) and pulldown was quantified with qPCR using Fast Advanced Master Mix and TaqMan qPCR probes (Supplementary Table 7 and 8). All qPCR reactions were performed in 5 μL reactions with 4 technical replicates in 384-well format, and read out using a LightCycler 480 Instrument II. Enrichment was quantified for samples as compared to their matched IgG antibody controls.
Translocation measurement of LwaCas13a and LwaCas13a-NF
HEK293FT cells were plated in 24-well tissue culture plates on poly-D-lysine coverslips (Corning) and transfected with 150ng dCas13a-NF vector and 300 ng guides for imaging ACTB. For translocation experiments, cells were fixed with 4% PFA and permeabilized with 0.2% Triton X-100 after 48 hours and mounted using anti-fade mounting medium with DAPI (Vectashield). Confocal microscopy was performed using a Nikon Eclipse Ti1 with Andor Yokagawa Spinning disk Revolution WD system.
Nuclear export of dCas13a-NF-msfGFP with guides targeting ACTB mRNA was analyzed by measuring the average cytoplasmic and nuclear msfGFP fluorescence and comparing the ratio across many cells between targeting and non-targeting conditions.
Fluorescent in situ hybridization (FISH) of ACTB transcript
HEK293FT cells were plated in 24-well tissue culture plates on poly-D-lysine coverslips (Corning) and transfected with 75 ng dCas13a-NF vector and 250 ng guides for imaging ACTB. After 48 hours, cells were fixed with 4% PFA for 45 minutes. The QuantiGene view RNA ISH Cell assay kit (Affymetrix) was used for performing the FISH on the cell samples and the protocol was followed as described by the manufacturer. After finishing the FISH procedure, coverslips were mounted using anti-fade mounting medium (Vectashield). Confocal microscopy was performed using a Nikon Eclipse Ti1 with Andor Yokagawa Spinning disk Revolution WD system.
Tracking of LwaCas13a to stress granules
HEK293FT cells were plated in 24-well tissue culture plates on poly-D-lysine coverslips (Corning) and transfected with 75 ng dCas13a-NF vector and 250 ng guides for imaging ACTB. For stress granule experiments, 200 μM sodium arsenite was applied for 1 hour prior to fixing and permeabilizing the cells. For immunofluorescence of G3BP1, cells were blocked with 20% goat serum, and incubated over night at room temperature with anti-G3BP1 primary antibody (Abnova H00010146-B01P). Cells were then incubated with secondary antibody labeled with Alexa Fluor 594 and mounted using anti-fade mounting medium with DAPI (Vectashield). Confocal microscopy was performed using a Nikon Eclipse Ti1 with Andor Yokagawa Spinning disk Revolution WD system.
Stress granule co-localization with dCas13a-NF-msfGFP was calculated using the average msfGFP and G3BP1 signal per cell using Pearson's correlation coefficient. The colocalization analyses were performed in the image analysis software FIJI 30 using the Coloc 2 plugin.
For live imaging experiments, HEK293FT cells were plated in 96-well tissue culture plates and transfected with 150 ng dCas13a-NF vector, 300 ng guides for imaging ACTB, and 5 ng of G3BP1-RFP reporter. After 48 hours, the cells were subjected to 0 μM or 400 μM sodium arsenite and imaged every 15 minutes every 2 hours on an Opera Phenix High Content Screening System (PerkinElmer) using the spinning disk confocal setting with 20× water objective. Cells were maintained at 37°C in a humidified chamber with 50% CO2. Live cell dCas13a-NF-msfGFP colocalization with G3BP1-RFP in stress granules was measured using the Opera Phenix Harmony software (PerkinElmer).
Extended Data
Extended Data Fig. 1. Evaluation of LwaCas13a PFS preferences and comparisons to LshCas13a.

a, Sequence comparison tree of the fifteen Cas13a orthologs evaluated in this study. b, Ratios of in vivo activity from Fig. 1B. c, Distributions of PFS enrichment for LshCas13a and LwaCas13a in targeting and non-targeting samples. d, Number of LshCas13a and LwaCas13a PFS sequences above depletion threshold for varying depletion thresholds. e, Distributions of PFS enrichment for LshCas13a and LwaCas13a in targeting samples, normalized to non-targeting samples. f, Sequence logos and counts for remaining PFS sequences after LshCas13a cleavage at varying enrichment cutoff thresholds. g, Sequence logos and counts for remaining PFS sequences after LwaCas13a cleavage at varying enrichment cutoff thresholds.
Extended Data Fig. 2. Biochemical characterization of LwaCas13a RNA cleavage activity.
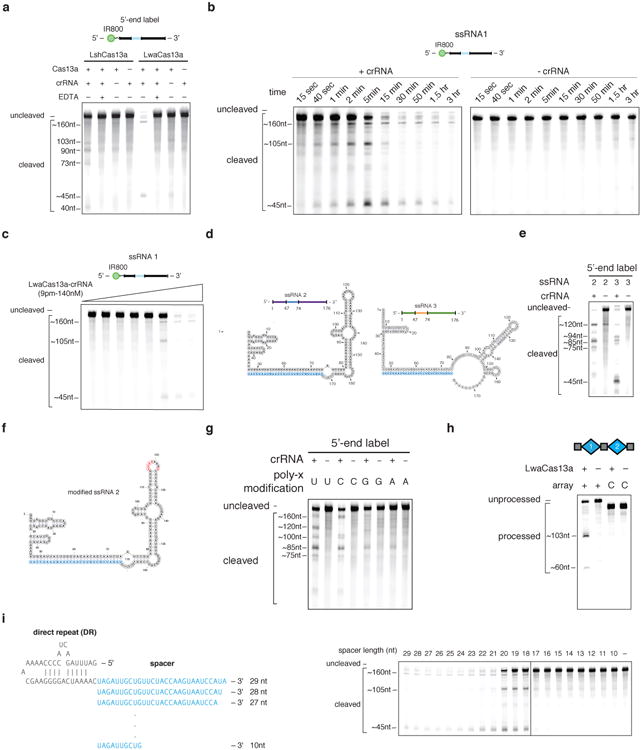
a, LwaCas13a has more active RNAse activity than LshCas13a. b, Gel electrophoresis of ssRNA1 after incubation with LwaCas13a and with and without crRNA 1 for varying amounts of times. c, Gel electrophoresis of ssRNA1 after incubation with varying amounts of LwaCas13a-crRNA complex. d, Sequence and structure of ssRNA 4 and ssRNA 5. crRNA spacer sequence is highlighted in blue. e, Gel electrophoresis of ssRNA 4 and ssRNA 5 after incubation with LwaCas13a and crRNA 1. f, Sequence and structure of ssRNA 4 with sites of poly-x modifications highlighted in red. crRNA spacer sequence is highlighted in blue. g, Gel electrophoresis of ssRNA 4 with each of 4 possible poly-x modifications incubated with LwaCas13a and crRNA 1. h, LwaCas13a can process pre-crRNA from the L. wadei CRISPR-Cas locus. i, Cleavage efficiency of ssRNA 1 for crRNA spacer truncations after incubation with LwaCas13a.
Extended Data Fig. 3. Engineering and optimization of LwaCas13a for mammalian knockdown.

a, Knockdown of Gluc transcript by LwaCas13a and Gluc guide 1 spacers of varying length. b, Knockdown of Gluc transcript with Gluc guide 1 and varying amounts of transfected LwaCas13a plasmid. c, Knockdown of Gluc transcript by LwaCas13a and varying amounts of transfected Gluc guide 1 and 2 plasmid. d, Knockdown of Gluc transcript using guides expressed from either U6 or tRNAVal promoters. e, Knockdown of KRAS transcript using guides expressed from either U6 or tRNAVal promoters. f, Knockdown of KRAS and CXC4 transcripts by LwaCas13a using guides transfected in A375 cells with shRNA comparisons. g, Knockdown of Gluc transcript and endogenous transcripts PPIB, KRAS,and CXCR4 with active and catalytically dead Cas13a. h, Validation of the top three guides from the arrayed knockdown Gluc and Cluc screens with shRNA comparisons. i, Arrayed knockdown screen of 93 guides evenly tiled across the XIST transcript. All values are mean ± SEM with n = 3. **p< 0.01; *p< 0.05. ns = not significant. A two-tailed student's T-test was used for comparisons.
Extended Data Fig. 4. LwaCas13a targeting efficiency is influenced by accessibility along the transcript.

a, First row: Top knockdown guides are plotted by position along target transcript. The top 20% of guides are chosen for Gluc and top 30% of guides for Cluc, KRAS, and PPIB. Second row: Histograms for the pairwise distance between adjacent top guides for each transcript (blue) compared to a random null-distribution (red). Inset shows the cumulative frequency curves for these histograms. A shift of the blue curve (actual measured distances) to the left of the red curve (null distribution of distances) indicates that guides are closer together than expected by chance. b, Gluc, Cluc, PPIB, and KRAS knockdown partially correlates with target accessibility as measured by predicted folding of the transcript. c,Kernel density estimation plots depicting the correlation between target accessibility (probability of a region being base-paired) and target expression after knockdown by LwaCas13a. d, First row: Correlations between target expression and target accessibility (probability of a region being base-paired) measured at different window sizes (W) and for different k-mer lengths. Second row: P-values for the correlations between target expression and target accessibility (probability of a region being base-paired) measured at different window sizes (W) and for different k-mer lengths. The color scale is designed such that p-values > 0.05 are shades of red and p-values < 0.05 are shades of blue.
Extended Data Fig. 5. Detailed evaluation of LwaCas13a sensitivity to mismatches in the guide:target duplex at varying spacer lengths.

a, Knockdown of KRAS evaluated with guides containing single mismatches at varying positions across the spacer sequence. b, Knockdown of PPIB evaluated with guides containing single mismatches at varying positions across the spacer sequence. c, Knockdown of Gluc evaluated with guides containing non-consecutive double mismatches at varying positions across the spacer sequence. The wild-type sequence is shown at the top with mismatch identities shown below. d, Collateral cleavage activity on ssRNA 1 and 2 for varying spacer lengths. (n=4 technical replicates; bars represent mean ± s.e.m.) e, Specificity ratios of guide tested in (d). Specificity ratios are calculated as the ratio of the on-target RNA (ssRNA 1) collateral cleavage to the off-target RNA (ssRNA 2) collateral cleavage. (n=4 technical replicates; bars represent mean ± s.e.m.) f, Collateral cleavage activity on ssRNA 1 and 2 for 28 nt spacer crRNA with synthetic mismatches tiled along the spacer. (n=4 technical replicates; bars represent mean ± s.e.m.) g, Specificity ratios, as defined in (e), of crRNA tested in (f). (n=4 technical replicates; bars represent mean ± s.e.m.) h, Collateral cleavage activity on ssRNA 1 and 2 for 23 nt spacer crRNA with synthetic mismatches tiled along the spacer. (n=4 technical replicates; bars represent mean ± s.e.m.) i, Specificity ratios, as defined in (e), of crRNA tested in (h). (n=4 technical replicates; bars represent mean ± s.e.m.) j, Collateral cleavage activity on ssRNA 1 and 2 for 20 nt spacer crRNA with synthetic mismatches tiled along the spacer. (n=4 technical replicates; bars represent mean ± s.e.m.) k, Specificity ratios, as defined in (e), of crRNA tested in (j). (n=4 technical replicates; bars represent mean ± s.e.m.).
Extended Data Fig. 6. LwaCas13a is more specific than shRNA knockdown on endogenous targets.
a, Left: Expression levels in log2(transcripts per million (TPM)) values of all genes detected in RNA-seq libraries of non-targeting shRNA-transfected control (x-axis) compared to KRAS-targeting shRNA (y-axis). Shown is the mean of three biological replicates. The KRAS transcript data point is colored in red. Right: Expression levels in log2(transcripts per million (TPM)) values of all genes detected in RNA-seq libraries of non-targeting LwaCas13a-guide-transfected control (x-axis) compared to KRAS-targeting LwaCas13a-guide (y-axis). Shown is the mean of three biological replicates. The KRAS transcript data point is colored in red. b, Left: Expression levels in log2(transcripts per million (TPM)) values of all genes detected in RNA-seq libraries of non-targeting shRNA-transfected control (x-axis) compared to PPIB-targeting shRNA (y-axis). Shown is the mean of three biological replicates. The PPIB transcript data point is colored in red. Right: Expression levels in log2(transcripts per million (TPM)) values of all genes detected in RNA-seq libraries of non-targeting LwaCas13a-guide-transfected control (x-axis) compared to PPIB-targeting LwaCas13a-guide (y-axis). Shown is the mean of three biological replicates. The PPIB transcript data point is colored in red. c, Comparisons of individual replicates of non-targeting shRNA conditions (first row) and Gluc-targeting shRNA conditions (second row). d, Comparisons of individual replicates of non-targeting guide conditions (first row) and Gluc-targeting guide conditions (second row). e, Pairwise comparisons of individual replicates of non-targeting shRNA conditions against the Gluc-targeting shRNA conditions. f, Pairwise comparisons of individual replicates of non-targeting guide conditions against the Gluc-targeting guide conditions.
Extended Data Fig. 7. Detailed analysis of LwaCas13a and RNAi knockdown variability (standard deviation) across all samples.

a, Heatmap of correlations (Kendall's tau) for log2(transcripts per million (TPM+1)) values of all genes detected in RNA-seq libraries between targeting and non-targeting replicates for shRNA or guide targeting either luciferase reporters or endogenous genes. b, Heatmap of correlations (Kendall's tau) for log2(transcripts per million (TPM+1)) values of all genes detected in RNA-seq libraries between all replicates and perturbations. c,Distributions of standard deviations for log2(transcripts per million (TPM+1)) values of all genes detected in RNA-seq libraries among targeting and non-targeting replicates for each gene targeted for either shRNA or guide.
Extended Data Fig. 8. LwaCas13a knockdown is specific to the targeted transcript with no activity on a measured off-target transcript.

a, Heatmap of absolute Gluc signal for first 96 spacers tiling Gluc. b, Heatmap of absolute Cluc signal for first 96 spacers tiling Gluc. c, Relationship between absolute Gluc signal and normalized luciferase for Gluc tiling guides. d, Relationship between absolute Cluc signal and normalized luciferase for Gluc tiling guides. e, Relationship between PPIB 2-Ct levels and PPIB knockdown for PPIB tiling guides. f, Relationship between GAPDH 2-Ct levels and PPIB knockdown for PPIB tiling guides. g, Relationship between KRAS 2-Ct levels and KRAS knockdown for KRAS guides. h, Relationship between GAPDH 2-Ct levels and KRAS knockdown for KRAS guides. i, Bioanalyzer traces of total RNA isolated from cells transfected with Gluc-targeting guides 1 and 2 or non-targeting guide from the experiment with active Cas13a in Extended Data Fig. 3g. The RNA-integrity number (RIN) is shown and 18S rRNA and 28S rRNA peaks are labeled above. A student's t-test shows no significant difference for the RIN between either of the targeting conditions and the non-targeting condition. The curves are shown as a mean of three replicates and the shaded area in red around the curves show the s.e.m. j, The Bioanalyzer trace for the RNA ladder with peak sizes labeled above.
Extended Data Fig. 9. dCas13a-NF can be used for ACTB imaging.
a, Comparison between localization of dCas13-GFP and dCas13a-GFP-KRAB constructs for imaging ACTB. Scale bars, 10μm b, Additional fields of view of the dCas13a-NLS-msfGFP negative-feedback construct delivered with a non-targeting guide. Scale bars, 10μm. c, Additional fields of view of the dCas13a-NLS-msfGFP negative-feedback construct delivered with ACTB guide 3. Scale bars, 10μm. d, Additional fields of view of the dCas13a-NLS-msfGFP negative-feedback construct delivered with ACTB guide 4. Scale bars, 10μm.
Extended Data Fig. 10. dCas13a-NF can image stress granule formation in living cells.
a, Representative images from RNA FISH of the ACTB transcript in dCas13a-NF-expressing cells with corresponding ACTB-targeting and non-targeting guides. Cell outline is shown with a dashed line. Scale bars, 10μm b, Overall signal overlap between ACTB RNA FISH signal and dCas13a-NF quantified by the Mander's overlap coefficient (left) and Pearson's correlation (right). Correlations and signal overlap are calculated pixel-by-pixel on a per cell basis. All values are mean ± SEM with n = 3. ****p< 0.0001; ***p< 0.001; **p < 0.01. A two-tailed student's T-test was used for comparisons. c, Representative images from live-cell analysis of stress granule formation in response to 400 uM sodium arsenite treatment. Scale bars, 20μm d, Quantitation of stress granule formation in response to sodium arsenite treatment. Quantitation is based on overlapping dCas13a-NF and G3BP1 puncta. All values are mean ± SEM with n = 3. ****p< 0.0001; ***p< 0.001; **p< 0.01; *p< 0.05. ns = not significant. A two-tailed student's T-test was used for comparisons.
Supplementary Material
Acknowledgments
We thank M. Alimova, D. Feldman,F. Chen, J.G. Doench, J.M. Engreitz, N. Habib, D. Tenen, A. Allen, R. Macrae, and R. Belliveau for discussions and support. O.A.A. is supported by a Paul and Daisy Soros Fellowship and National Defense Science and Engineering Fellowship. J.S.G. is supported by a D.O.E. Computational Science Graduate Fellowship. R.P.B, J.L, and D.T.H. are supported by the NIH through NIAID (R01AI117043). A.D. is supported by an NSF Graduate Research Fellowship and a Air Force Office of Scientific Research grant (FA9550-14-1-0060). Zika work was partially funded by Marc and Lynne Benioff to P.C.S. and antibiotic resistance work was partially funded by Josh and Anita Bekenstein to D.T.H. A.R. is supported by the Howard Hughes Medical Institute. F.Z. is a New York Stem Cell Foundation-Robertson Investigator. F.Z. is supported by the NIH through NIMH (5DP1-MH100706 and 1R01-MH110049), NSF, Howard Hughes Medical Institute, the New York Stem Cell, Simons, Paul G. Allen Family, and Vallee Foundations; and James and Patricia Poitras, Robert Metcalfe, and David Cheng. Cas13a/C2c2 expression plasmids are available from Addgene under UBMTA. Support forums and computational tools are available via the Zhang lab website (http://www.genome-engineering.org) and Github (https://github.com/fengzhanglab)
Footnotes
Author Contributions: O.O.A, J.S.G, and F.Z. conceived and designed the study. O.O.A, J.S.G, P.E., J.J., and V.V. performed experiments. O.O.A and J.S.G analyzed data. S.H. performed select microscopy experiments. J.J.B. performed the plant protoplasts knockdown experiments. O.O.A, J.S.G, E.S.L, and F.Z. wrote the paper with input from D.F.V and A.T. and help from all authors.
Code availability: Relevant code for data analysis is available on Github (https://github.com/fengzhanglab)
Data availability: High throughput sequencing data related to this study is available at BioProject PRJNA383832.
References
- 1.Fire A, et al. Potent and specific genetic interference by double-stranded RNA in Caenorhabditis elegans. Nature. 1998;391:806–811. doi: 10.1038/35888. [DOI] [PubMed] [Google Scholar]
- 2.Elbashir SM, et al. Duplexes of 21-nucleotide RNAs mediate RNA interference in cultured mammalian cells. Nature. 2001;411:494–498. doi: 10.1038/35078107. [DOI] [PubMed] [Google Scholar]
- 3.Root DE, Hacohen N, Hahn WC, Lander ES, Sabatini DM. Genome-scale loss-of-function screening with a lentiviral RNAi library. Nat Methods. 2006;3:715–719. doi: 10.1038/nmeth924. [DOI] [PubMed] [Google Scholar]
- 4.Jackson AL, et al. Expression profiling reveals off-target gene regulation by RNAi. Nat Biotechnol. 2003;21:635–637. doi: 10.1038/nbt831. [DOI] [PubMed] [Google Scholar]
- 5.Tyagi S. Imaging intracellular RNA distribution and dynamics in living cells. Nat Methods. 2009;6:331–338. doi: 10.1038/nmeth.1321. [DOI] [PubMed] [Google Scholar]
- 6.Shmakov S, et al. Diversity and evolution of class 2 CRISPR-Cas systems. Nat Rev Microbiol. 2017;15:169–182. doi: 10.1038/nrmicro.2016.184. [DOI] [PMC free article] [PubMed] [Google Scholar]
- 7.Shmakov S, et al. Discovery and Functional Characterization of Diverse Class 2 CRISPR-Cas Systems. Mol Cell. 2015;60:385–397. doi: 10.1016/j.molcel.2015.10.008. [DOI] [PMC free article] [PubMed] [Google Scholar]
- 8.Abudayyeh OO, et al. C2c2 is a single-component programmable RNA-guided RNA-targeting CRISPR effector. Science. 2016;353 doi: 10.1126/science.aaf5573. aaf5573. [DOI] [PMC free article] [PubMed] [Google Scholar]
- 9.Ran FA, et al. In vivo genome editing using Staphylococcus aureus Cas9. Nature. 2015;520:186–191. doi: 10.1038/nature14299. [DOI] [PMC free article] [PubMed] [Google Scholar]
- 10.Gootenberg JS, et al. Nucleic acid detection with CRISPR-Cas13a/C2c2. Science. 2017 In press. [Google Scholar]
- 11.Dahlman JE, et al. Orthogonal gene knockout and activation with a catalytically active Cas9 nuclease. Nat Biotechnol. 2015;33:1159–1161. doi: 10.1038/nbt.3390. [DOI] [PMC free article] [PubMed] [Google Scholar]
- 12.Garneau NL, Wilusz J, Wilusz CJ. The highways and byways of mRNA decay. Nat Rev Mol Cell Biol. 2007;8:113–126. doi: 10.1038/nrm2104. [DOI] [PubMed] [Google Scholar]
- 13.Hutchinson JN, et al. A screen for nuclear transcripts identifies two linked noncoding RNAs associated with SC35 splicing domains. BMC Genomics. 2007;8:39. doi: 10.1186/1471-2164-8-39. [DOI] [PMC free article] [PubMed] [Google Scholar]
- 14.Subramanian A, et al. Gene set enrichment analysis: a knowledge-based approach for interpreting genome-wide expression profiles. Proc Natl Acad Sci U S A. 2005;102:15545–15550. doi: 10.1073/pnas.0506580102. [DOI] [PMC free article] [PubMed] [Google Scholar]
- 15.Rath S, et al. Human RNase L tunes gene expression by selectively destabilizing the microRNA-regulated transcriptome. Proc Natl Acad Sci U S A. 2015;112:15916–15921. doi: 10.1073/pnas.1513034112. [DOI] [PMC free article] [PubMed] [Google Scholar]
- 16.Gross GG, et al. Recombinant probes for visualizing endogenous synaptic proteins in living neurons. Neuron. 2013;78:971–985. doi: 10.1016/j.neuron.2013.04.017. [DOI] [PMC free article] [PubMed] [Google Scholar]
- 17.Unsworth H, Raguz S, Edwards HJ, Higgins CF, Yague E. mRNA escape from stress granule sequestration is dictated by localization to the endoplasmic reticulum. FASEB J. 2010;24:3370–3380. doi: 10.1096/fj.09-151142. [DOI] [PubMed] [Google Scholar]
- 18.Nelles DA, et al. Programmable RNA Tracking in Live Cells with CRISPR/Cas9. Cell. 2016;165:488–496. doi: 10.1016/j.cell.2016.02.054. [DOI] [PMC free article] [PubMed] [Google Scholar]
- 19.Wyss-Coray T. Ageing, neurodegeneration and brain rejuvenation. Nature. 2016;539:180–186. doi: 10.1038/nature20411. [DOI] [PMC free article] [PubMed] [Google Scholar]
- 20.Protter DS, Parker R. Principles and Properties of Stress Granules. Trends Cell Biol. 2016;26:668–679. doi: 10.1016/j.tcb.2016.05.004. [DOI] [PMC free article] [PubMed] [Google Scholar]
- 21.Tourriere H, et al. The RasGAP-associated endoribonuclease G3BP assembles stress granules. J Cell Biol. 2003;160:823–831. doi: 10.1083/jcb.200212128. [DOI] [PMC free article] [PubMed] [Google Scholar] [Retracted]
- 22.Tafer H, et al. The impact of target site accessibility on the design of effective siRNAs. Nat Biotechnol. 2008;26:578–583. doi: 10.1038/nbt1404. [DOI] [PubMed] [Google Scholar]
- 23.Mann DG, et al. Gateway-compatible vectors for high-throughput gene functional analysis in switchgrass (Panicum virgatum L.) and other monocot species. Plant Biotechnol J. 2012;10:226–236. doi: 10.1111/j.1467-7652.2011.00658.x. [DOI] [PubMed] [Google Scholar]
- 24.Zhang Y, et al. A highly efficient rice green tissue protoplast system for transient gene expression and studying light/chloroplast-related processes. Plant Methods. 2011;7:30. doi: 10.1186/1746-4811-7-30. [DOI] [PMC free article] [PubMed] [Google Scholar]
- 25.Gootenberg JS, et al. Nucleic acid detection with CRISPR-Cas13a/C2c2. Science. 2017 doi: 10.1126/science.aam9321. [DOI] [Google Scholar]
- 26.Jain M, Nijhawan A, Tyagi AK, Khurana JP. Validation of housekeeping genes as internal control for studying gene expression in rice by quantitative real-time PCR. Biochem Biophys Res Commun. 2006;345:646–651. doi: 10.1016/j.bbrc.2006.04.140. [DOI] [PubMed] [Google Scholar]
- 27.Joung J, et al. Genome-scale CRISPR-Cas9 knockout and transcriptional activation screening. Nat Protoc. 2017;12:828–863. doi: 10.1038/nprot.2017.016. [DOI] [PMC free article] [PubMed] [Google Scholar]
- 28.Bernhart SH, Hofacker IL, Stadler PF. Local RNA base pairing probabilities in large sequences. Bioinformatics. 2006;22:614–615. doi: 10.1093/bioinformatics/btk014. [DOI] [PubMed] [Google Scholar]
- 29.Li B, Dewey CN. RSEM: accurate transcript quantification from RNA-Seq data with or without a reference genome. BMC Bioinformatics. 2011;12:323. doi: 10.1186/1471-2105-12-323. [DOI] [PMC free article] [PubMed] [Google Scholar]
- 30.Schindelin J, et al. Fiji: an open-source platform for biological-image analysis. Nat Methods. 2012;9:676–682. doi: 10.1038/nmeth.2019. [DOI] [PMC free article] [PubMed] [Google Scholar]
Associated Data
This section collects any data citations, data availability statements, or supplementary materials included in this article.