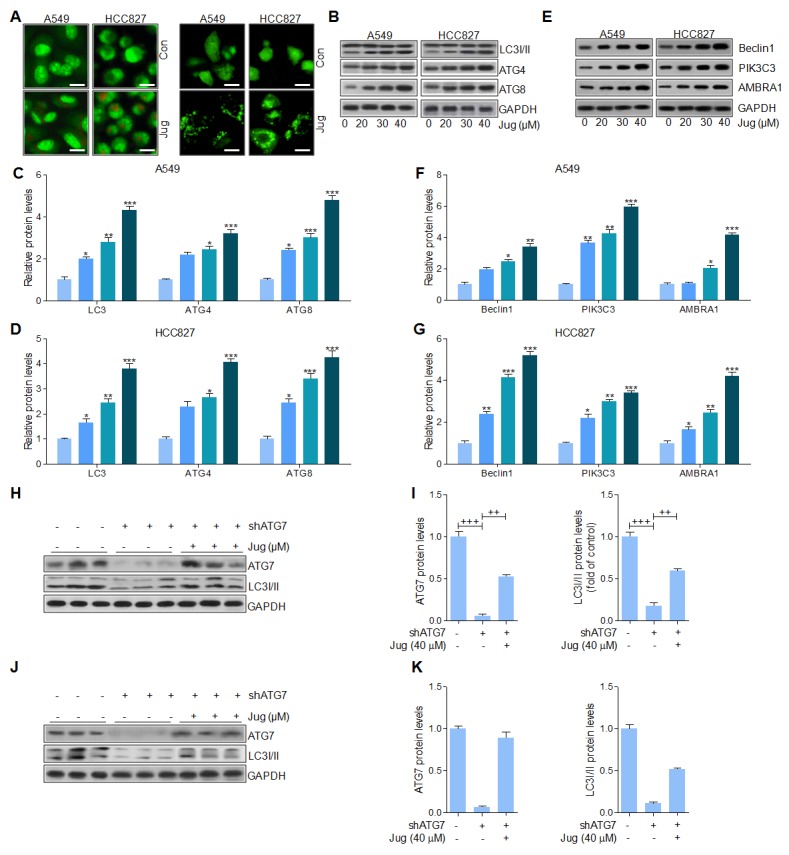
Figure 7. Juglanin induced lung cancer cell death through autophagy induction.

(A) A549 and H1975 cells were treated with 40 μM juglanin for 24 h. Next, the acidic vacuoles formation was analyzed by Acridine Orange (AO) staining (Left). And LC3-GFP puncta was used to analyze the autophagy condition of lung cancer cells treated as indicated (Right). (B) A549 and H1975 cells were administrated with various concentrations of jugalnin for 24 h. And western blot analysis was used to calculate LC3I/II, ATG7 and ATG3 protein levels. The quantification of the immunoblotting data from (C) A549 and (D) H1975 was shown. (E) The protein expression levels of autophagy induction-related signals, including Beclin1, and PIK3C3 were calculated through western blot analysis. And the quantification of these signals in (F) A549 and (G) H1975 cells was displayed. (H) ATG7 was knockdown in A549 cells treated with or without juglanin at 40 μM. Then, western blot analysis was used to evaluate ATG7 and LC3I/II levels. (I) The quantification of ATG7 and LC3 following immunoblotting in A549 cells was displayed. (J) ATG7 was silenced in H1975 cells treated with or without 40 μM juglanin. Then, western blot analysis was performed to determine ATG7 and LC3I/II levels. (K) The quantification of ATG7 and LC3 according to the immunoblotting in H1975 cells was shown. The data are presented as mean ± S.E.M. of three separate experiments performed in duplicate. ** P < 0.01 and *** P < 0.001 compared to Control group (Con) without any treatment.+ P < 0.05, ++ P < 0.01 and +++ P < 0.001 were considered with significant difference.
