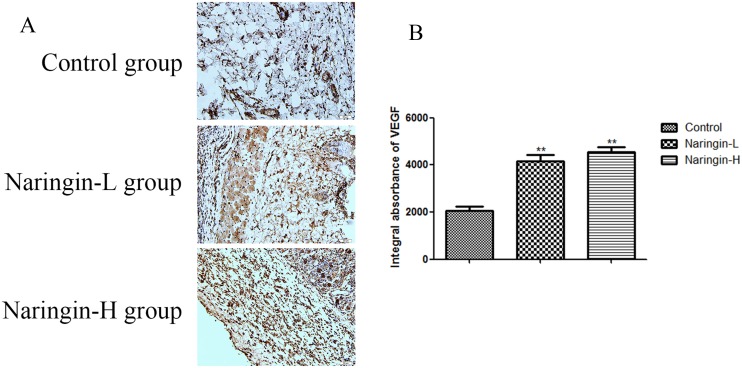
Figure 5.
(A) Comparison of VEGF expression in the intermediate area II of the three groups. The immunohistochemistry test and observed under magnification 200. (B) IA value was detected to compare the level of VEGF (**p < 0.01 vs. the control group). IA, integral absorbance; VEGF, vascular endothelial growth factor.

