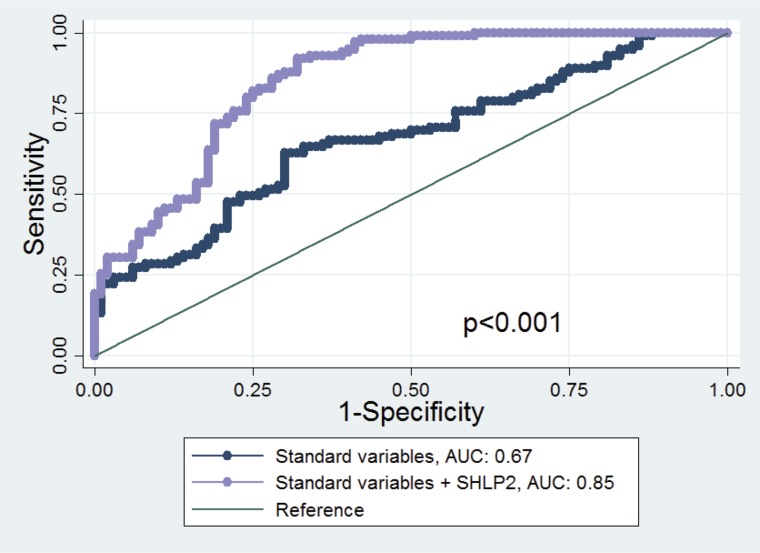
Figure 3. ROC curve and AUC statistics before and after adding SHLP2 in the model.
The true positive rate (sensitivity) is plotted in function of the false positive rate (1−specificity) for the model excluding or including SHLP2 levels. The AUC is a measure of how well a quantitative test can distinguish between subjects with and without prostate cancer. The AUC of the model including only age, DRE, race and PSA to predict PCa risk was 0.67. This improved to 0.85 when SHLP2 was added to the model (p < 0.001).

