

The amyloid precursor–like protein 1 (APLP1) plays a role in synaptic adhesion and synaptogenesis. In this work, we use quantitative fluorescence microscopy to demonstrate the existence of APLP1–APLP1 trans interaction across cell–cell junctions and propose a model explaining the molecular mechanism driving APLP1 multimerization.
Abstract
The amyloid precursor–like protein 1 (APLP1) is a type I transmembrane protein that plays a role in synaptic adhesion and synaptogenesis. Past investigations indicated that APLP1 is involved in the formation of protein–protein complexes that bridge the junctions between neighboring cells. Nevertheless, APLP1–APLP1 trans interactions have never been directly observed in higher eukaryotic cells. Here, we investigated APLP1 interactions and dynamics directly in living human embryonic kidney cells using fluorescence fluctuation spectroscopy techniques, namely cross-correlation scanning fluorescence correlation spectroscopy and number and brightness analysis. Our results show that APLP1 forms homotypic trans complexes at cell–cell contacts. In the presence of zinc ions, the protein forms macroscopic clusters, exhibiting an even higher degree of trans binding and strongly reduced dynamics. Further evidence from giant plasma membrane vesicles suggests that the presence of an intact cortical cytoskeleton is required for zinc-induced cis multimerization. Subsequently, large adhesion platforms bridging interacting cells are formed through APLP1–APLP1 trans interactions. Taken together, our results provide direct evidence that APLP1 functions as a neuronal zinc-dependent adhesion protein and allow a more detailed understanding of the molecular mechanisms driving the formation of APLP1 adhesion platforms.
INTRODUCTION
The amyloid precursor protein family members APP (amyloid precursor protein), APLP1 (amyloid precursor–like protein 1), and APLP2 (amyloid precursor–like protein 2) are type I transmembrane proteins with a crucial role in synaptogenesis and brain development (Coulson et al., 2000; Muller et al., 2017). Cleavage of APP via various secretases (e.g., the α-, β-, and γ-secretases [ Vassar et al., 1999; Selkoe, 2001; Eggert et al., 2004; Li and Südhof, 2004]) leads to the release of soluble protein fragments, including the Aβ-peptides found in amyloid plaques in the brains of Alzheimer’s disease patients (Blennow et al., 2006). APP family proteins have been shown to be involved also in neuron differentiation, neurite outgrowth, and synaptic plasticity (Heber et al., 2000; Wang et al., 2009; Weyer et al., 2011; Tyan et al., 2012; Shariati and De Strooper, 2013). All three proteins are pre- and postsynaptically expressed and up-regulated during postnatal development (Schilling et al., 2017).
Among the three proteins, APLP1 is predominantly expressed in the CNS and has the highest surface expression (Kaden et al., 2009). Recent results from coculture assays suggested that APLP1 expression has synaptogenic activity on primary cortical neurons (Schilling et al., 2017). Further, we recently reported that metal ions, especially zinc, affect APLP1 oligomerization (Mayer et al., 2014) and trigger the assembly of cis dimers into large protein clusters at the plasma membrane (PM) and their enrichment at cell–cell contact sites (Mayer et al., 2016). Using a cell-substrate adhesion assay, we showed that zinc enhances adhesion of cortical neurons to immobilized APLP1 ectodomains. This evidence, together with results from cell-aggregation experiments and biochemical studies, supports the hypothesis that APLP1 can form homo- or heterotypic trans multimers mediating cell–cell interaction (Soba et al., 2005; Kaden et al., 2009). However, direct evidence for APLP1 trans interactions in living cells and the role of zinc in modifying these molecular interactions have not been investigated yet.
Here, we address this issue by applying fluorescence fluctuation techniques, namely scanning fluorescence correlation spectroscopy (sFCS) and cross-correlation number and brightness (ccN&B) analysis, to quantify APLP1 dynamics and protein–protein interactions directly in living cells. Both techniques are based on a statistical analysis of fluorescence fluctuations caused by the diffusive motion of fluorescent molecules through the focal volume of a confocal microscope and can provide quantitative information about protein–protein interaction (Digman et al., 2008; Ries et al., 2009; Hilsch et al., 2014; Bobone et al., 2017). Whereas sFCS is particularly suitable for measuring diffusive dynamics in the PM (Ries and Schwille, 2006), N&B analysis can map molecular aggregation in space (Digman et al., 2008; Hilsch et al., 2014; Bobone et al., 2017). Using these techniques with two spectrally distinct fluorescent labels allows us to probe interactions among different species via cross-correlation analysis of the signals measured in two spectral channels (Schwille et al., 1997; Bacia et al., 2006; Digman et al., 2009; Machánˇ and Wohland, 2014). We show that APLP1 undergoes trans homo-multimerization and a consequent reduction in mobility at cell–cell contacts. Also, we demonstrate that zinc induces the formation of large, APLP1-rich adhesion platforms characterized by strong protein–protein trans interactions. Finally, we provide evidence that the cellular cytoskeleton is crucial for APLP1 cis and trans clustering and, as a consequence, for APLP1-mediated cell–cell adhesion. Our data shed light on the molecular basis of APLP1–APLP1 interaction and provide direct evidence that this protein functions as a zinc-dependent cell–cell adhesion receptor.
RESULTS
APLP1 partially interacts in trans at cell–cell contact sites
Previous studies hypothesized that APLP1 is involved in trans interactions between neighboring cells (Soba et al., 2005; Kaden et al., 2009; Mayer et al., 2016). However, whether such interactions involve APLP1 on one side directly or indirectly interacting with APLP1 on the adjacent cell (rather than, e.g., APLP1 interacting exclusively with other proteins) remains unclear. To investigate the existence of APLP1–APLP1 trans interactions, we specifically monitored the presence of homotypic trans complexes. We transiently expressed APLP1–yellow fluorescent protein (APLP1-YFP) or APLP1-mCardinal (APLP1-Card) in human embryonic kidney (HEK) cells. In both cases, the fluorescent labels were fused to the intracellular side of the protein to avoid interference with the extracellular binding domains (Baumkötter et al., 2012). The two cell populations were mixed 4 h after transfection. On these mixed samples, we performed two-color sFCS measurements at contacts between APLP1-YFP– and APLP1-Card–expressing cells, where the proteins are colocalized and have a mostly homogeneous distribution (see, e.g., the continuous arrow in Figure 1A). To avoid cross-talk interferences, we excited and detected the two spectral channels sequentially. It is worth noting that the large distance between the fluorophores (∼50–100 nm) would not allow fluorescence energy transfer measurements.
FIGURE 1:

APLP1-YFP and APLP1-Card interact in trans at cell–cell contact sites. (A) HEK cells expressing APLP1-YFP (green) or APLP1-Card (red). Yellow arrows represent sFCS line scans (solid arrow, two-color scan at cell–cell contact; dashed arrow, one-color scan outside junction). Scale bar is 5 µm. (B) Representative correlation functions and fit curves for two-color sFCS analysis of APLP1 at cell–cell contacts. Red, ACF in red channel (APLP1-Card); green, ACF in green channel (APLP1-YFP); blue, CCF calculated for both spectral channels. Fit curves (solid lines) were obtained from fitting a two-dimensional diffusion model to the data. (C) Relative cross-correlation from two-color sFCS measurements of APLP1-YFP and APLP1-Card mixed cells (n = 17 cells, three independent samples). Cross-correlation values for myr-palm-Card-YFP tandem–expressing cells, measured under the same conditions, are shown as positive control for cross-correlation (“positive,” n = 14 cells, three independent samples; see also Supplemental Figure S1). Cross-correlation values for mixed cells expressing myr-palm-YFP and myr-palm-Card, measured under the same conditions, are shown as negative control for cross-correlation (“negative,” n = 17 cells, three independent samples; see also Supplemental Figure S1). (D) Representative ACF for APLP1-YFP from one-color sFCS measurement outside junction and fit (solid line) of a two-dimensional diffusion model. (E) Diffusion coefficients of APLP1 at cell–cell contacts (n = 26 cells, four independent samples) and outside junctions (n = 17 cells, three independent samples) calculated from ACF-derived diffusion times of APLP1-YFP. Error bars represent mean ± SD Asterisks indicate statistically significant differences with ***p < 0.0001 determined with Welch’s two-sided t test.
From sFCS measurements, we calculated the auto-correlation function (ACF; green [YFP] and red [Card] data points in Figure 1B) and cross-correlation function (CCF; blue data points in Figure 1B) of the fluorescence fluctuations and fitted a two-dimensional diffusion model to the data (green, red, and blue curves). From the amplitude ratios of the three curves, we obtained the relative cross-correlation, which is a measure of the correlation of fluorescence fluctuations in the green (APLP1-YFP) and red (APLP1-Card) channels. Relative cross-correlation varies between 0 (i.e., no red–green complexes) and 1 (i.e., highest number of red–green complexes). The decay times of the ACFs provide information about diffusion dynamics of APLP1s in the membrane (discussed in the next paragraph). It is worth noting that in order to maximize the fluorescence fluctuation signal, cells with the lowest detectable protein expression were selected.
sFCS analysis revealed a positive cross-correlation between fluorescence fluctuations in the two spectral channels, that is, evidence of codiffusion of YFP- and Card-labeled APLP1 (Figure 1, B and C). The average relative cross-correlation of 0.45 ± 0.21 (mean ± SD, n = 17 cells from three independent measurements; Figure 1C) is ∼50% of the maximum relative cross-correlation detected for complete binding (0.96 ± 0.18, mean ± SD, n = 14 cells from three independent measurements; Supplemental Figure S1), as verified with a myristoylated-palmitoylated-mCardinal-YFP (myr-palm-Card-YFP) tandem construct as a positive cross-correlation control. As a negative control, we examined junctions between one cell expressing myr-palm-YFP and one expressing myr-palm-Card. In this case, we found a much lower relative cross-correlation (0.08 ± 0.10, mean ± SD, n = 17 cells from three independent measurements; Figure 1C and Supplemental Figure S2).
To estimate the stoichiometry of APLP1 complexes, we calculated the molecular brightness from sFCS data at cell–cell contacts. After a normalization using the molecular brightness of a monomeric standard (see Materials and Methods), the normalized brightness provides a direct measurement of protein multimerization state (e.g., a normalized brightness value of 1 indicates the presence of monomers, a value of 2 indicates the presence of dimers, and so on). For APLP1-YFP, we obtained a normalized brightness distribution centered around 3.0 ± 2.9 (Figure 2D, median ± SD, n = 17 from three independent measurements). Note that sFCS brightness analysis cannot resolve mixtures of multimers with different sizes but, rather, provides an average multimerization value. In conclusion, these data indicate that small APLP1 oligomers (on average, trimers) on one cell membrane interact in trans with other small APLP1 oligomers in the facing membrane. It is worth noting that our technical approach cannot exclude the presence of other PM components in the observed trans complexes. Therefore, it might be also possible that APLP1 trans interactions are mediated by other, yet unidentified, proteins. Furthermore, the measured average cross-correlation value suggests that there is a significant fraction of APLP1 on each side of the junction that is not involved in trans interactions. In a simplified scenario in which only one APLP1 multimeric species is present and all APLP1 is fluorescent, ∼45% of the protein would be part of trans complexes.
FIGURE 2:

Zinc induces formation of slow APLP1-YFP/APLP1-Card clusters at cell–cell contacts showing enhanced trans interactions. (A) HEK cells expressing APLP1-YFP (green) or APLP1-Card (red) 20 min after incubation with 50 μM ZnCl2. The yellow arrow represents a typical two-color sFCS line scan across a protein cluster in the cell–cell junction. Scale bar is 5 µm. (B) Representative correlation functions and fit curves for two-color sFCS measurements according to a two-dimensional diffusion model (see the text for details). Red, ACF in red channel (APLP1-Card); green, ACF in green channel (APLP1-YFP); blue, CCF calculated between the two spectral channels. (C) Cross-correlation values from all measurements (three independent experiments) for zinc-treated APLP1 cells (17 cells), nontreated cells (17 cells), and cells expressing myr-palm-Card-YFP tandem (14 cells; see also Figure 1) as positive control for cross-correlation. Asterisks indicate statistically significant differences with ***p < 0.001 determined with Welch’s two-sided t test. (D) Brightness of APLP1-YFP with and without zinc, calculated from sFCS measurements in cell–cell contacts (normalized to myr-palm-YFP brightness). Error bars represent mean ± SD.
Diffusion of APLP1 within cell–cell contact sites moderately decreases in the absence of zinc
If APLP1 is involved in specific interactions bridging two facing cells, reduced protein dynamics might be expected at cell–cell contacts (Trimble and Grinstein, 2015). To quantify the diffusion coefficient of APLP1 in living cells, we performed sFCS measurements within and outside junctions in HEK cells expressing APLP1-YFP and/or APLP1-Card (see, e.g., the two arrows in Figure 1A). We did not observe significant differences between the dynamics of APLP1-YFP and APLP1-Card and, therefore, restricted our analysis to APLP1-YFP. From the decay times of the ACFs (Figure 1, B and D), we calculated the diffusion coefficients in both PM regions, as described in Materials and Methods. Briefly, diffusion times were obtained by fitting a two-dimensional diffusion model to the ACF shown, for example, in Figure 1, B and D. Typical observed diffusion times for APLP1-YFP were ∼50 ms outside junctions and ∼100 ms within junctions. Through calibration of the size of the observation volume, we were able to obtain diffusion coefficients (D). As shown in Figure 1E, we found a significant reduction of APLP1 diffusion in cell–cell contacts (DAPLP1 = 0.09 ± 0.06 μm2/s, mean ± SD, n = 26 cells from three independent samples) compared with noncontact areas (DAPLP1 = 0.25 ± 0.09 μm2/s, mean ± SD, n = 17 cells from three independent samples).
To verify that the reduction in mobility is not induced by, for example, differences in membrane organization (e.g., lipid or protein composition, underlying cytoskeleton) between cell–cell contacts and other regions of the PM, we monitored the diffusion of myr-palm-YFP (associated to the PM inner leaflet [ Engel et al., 2010]) and GPI-YFP (glycosylphosphatidylinositol-anchored YFP, associated to the PM outer leaflet [ Scolari et al., 2009]). We found no difference in diffusion coefficients of either construct between the two regions of the PM (D ∼1 μm2/s; see Supplemental Figure S3). Thus, the reduction in APLP1 diffusivity in cell–cell contacts seems to be due to specific interactions involving the protein.
Zinc induces formation of APLP1 clusters at cell–cell contacts with reduced diffusivity and enhanced trans interactions
Recently, we found that physiological concentrations of zinc in the micromolar range trigger the formation of APLP1 multimers and their enrichment at cell–cell contact sites (Mayer et al., 2014, 2016). We hypothesized that these multimers may involve APLP1 trans interactions and act as cell–cell adhesion complexes. To clarify the effect of zinc on APLP1 trans interactions, we performed two-color sFCS experiments after a 20-min incubation of the samples with 50 µM ZnCl2. After zinc addition, we observed a strong colocalization of APLP1-YFP and APLP1-Card at cell–cell contact sites and the formation of large protein clusters within ∼2 min (see, e.g., Figures 2A and 3B and Supplemental Figure S4).
FIGURE 3:

Two-color ccN&B analysis reveals trans interactions among APLP1 molecules in zinc-induced macroscopic clusters. (A) Fluorescence image frame extracted from a ccN&B image stack of a typical contact area between APLP1-YFP– and APLP1-Card–expressing cells. (B) Fluorescence image frame of APLP1-YFP/APLP1-Card contact area acquired 20 min after zinc incubation. (C) Image frame from ccN&B image stack measured on myr-palm-YFP/myr-palm-Card cell–cell contact (negative control). (D–F) Cross-correlation brightness (Bcc) histograms of all examined pixels and cells in the context of ccN&B analysis of cell–cell contacts in APLP1 samples without zinc (D; n = 18 cells from three independent measurements), with zinc (E; n = 19 cells from three independent measurements) and in myr-palm-YFP/myr-palm-Card control sample (F; n = 26 cells from three independent measurements). Vertical red lines correspond to Bcc = 0. (G, H) Normalized brightness histograms of APLP1-YFP in the absence of zinc (G) and after 20 min ZnCl2 incubation (H), measured at APLP1-YFP/APLP1-Card junctions. Normalized brightness histograms were obtained from the analysis of the same cells and regions of interest used for the calculation of Bcc. Inset in G shows a magnification in the normalized brightness range of –2 to 10.
We performed sFCS measurements across these clusters for ∼10 min on several cell–cell junctions and obtained the corresponding correlation functions (Figure 2B), that is, two ACFs for APLP1-YFP (green) and APLP1-Card (red) and a CCF (blue) between the two channels. As anticipated, correlation functions showed large decay times of ∼10 s and low signal-to-noise ratios at large correlation times. The data noise, caused by the extremely slow diffusion and limited acquisition times, prevented a quantitative analysis of protein dynamics. Thus, diffusion coefficients could only be estimated to be on the order of 10–3 µm2/s (i.e., ∼100-fold reduction compared with diffusion in the absence of zinc). On the other hand, we were able to calculate the cross-correlation values from the fluorescence fluctuations in both channels at short correlation times (i.e., the leftmost points of the CCF in Figure 2B, blue data points and line). The measured average relative cross-correlation of 0.8 ± 0.3 (mean ± SD, n = 17 cells) is ∼35% higher than the one measured before zinc treatment (Figure 2C) and close to the maximum cross-correlation measured on myr-palm-Card-YFP tandem–expressing cells (0.96 ± 0.18, mean ± SD, n = 14 cells from three independent measurements; Supplemental Figure S1). This indicates that most of APLP1 is involved in trans interactions. In a simplified example in which only one APLP1 multimeric species is present and all APLP1 is fluorescent, ∼80% of the protein would be part of trans complexes. Note that, because of the presence of photobleaching, the measured relative cross-correlation might be slightly lower than the real one and, therefore, the reported values are to be considered low estimates.
We also calculated the brightness of APLP1 clusters from sFCS data and found a strong increase in brightness upon zinc addition compared with values measured without zinc (Figure 2D). The measured values are in the range of ∼10–50 monomers per cis multimer, that is, up to ∼100 APLP1 monomers in a whole protein cluster across the cell junction.
The large APLP1 clusters observed at cell–cell contacts have a typical size of ∼102–103 nm. Thus, sFCS (i.e., scanning in a line pattern with diffraction-limited thickness) captures only a portion of the clusters. To monitor APLP1 trans interactions along the whole contact region, we performed ccN&B because this method can map molecular aggregation in space (Digman et al., 2008, 2009; Hilsch et al., 2014; Bobone et al., 2017). This analysis provides single-channel brightness and cross-correlation brightness values (Bcc), pixel by pixel. The normalized single-channel brightness value is a direct indication of the multimeric state of a fluorescent protein complex. The normalization procedure is performed exactly as already described for sFCS. Bcc values are a measurement of the interaction between spectrally distinguished molecules. Bcc values distributed around 0 indicate the absence of fluorescence fluctuation cross-correlation, that is, the lack of interaction between YFP- and Card-labeled molecules. Positive Bcc average values indicate the presence of an interaction (i.e., coordinated diffusion) between YFP- and Card-labeled molecules.
We analyzed several junctions of mixed cells expressing APLP1-YFP and APLP1-Card in the absence of zinc (see, e.g., Figure 3A) or in the presence of 50 µM ZnCl2 (see, e.g., Figure 3B). After selecting the pixels corresponding to these junctions as regions of interest, we calculated the single-channel normalized brightness and Bcc values pixel-wise and pooled the results from all measured junctions in histograms for the brightness of APLP1-YFP (Figure 3, G and H, normalized as described in Materials and Methods) and Bcc (Figure 3, D–F).
In both experimental conditions (i.e., no zinc or 50 µM ZnCl2), we measured a positive average value for the Bcc of the pixels corresponding to cell–cell contacts compared with a negative control (Figure 3, D–F). Without zinc, we determined an average Bcc of 0.068 ± 0.004 (mean ± SEM, n = 18 cells from three independent measurements). After zinc addition, we observed an increase of Bcc to 0.266 ± 0.006 (mean ± SEM, n = 19 cells from three independent measurements). The negative control sample consisted of mixed cells expressing either myr-palm-YFP or myr-palm-Card and was observed under the same acquisition conditions as those used for observation of the other samples. The Bcc distribution obtained in this case had a mean value of 0.022 ± 0.002 (mean ± SEM, n = 26 cells from three independent measurements).
The normalized brightness histograms of APLP1-YFP at cell–cell contacts show a shift from brightness values corresponding to small oligomers in the absence of zinc (Figure 3G, distribution peak ∼2) to large multimers in the presence of zinc (Figure 3H, range of ∼10–60), in good agreement with sFCS brightness data. Thus, we conclude that zinc enhances the formation of APLP1 clusters at cell–cell contacts. These clusters appear to be stabilized by protein trans interactions.
Zinc does not induce APLP1 multimerization in giant plasma membrane vesicles (GPMVs)
The appearance of large APLP1 clusters upon zinc addition raises the question of whether further cellular components are involved in APLP1 interactions and cluster formation. Considering the putative role of APLP1 trans clusters as adhesion complexes, the cortical actin cytoskeleton underlying the membranes is of particular interest. To unravel its role in APLP1 clustering, we investigated APLP1 interactions in cytoskeleton-free, yet native, membrane systems (Schneider et al., 2017). We produced GPMVs from APLP1-YFP–expressing cells and measured the diffusion coefficient and molecular brightness of APLP1-YFP with sFCS in the absence and presence of zinc ions. Interestingly, upon zinc addition, the lateral organization of APLP1 in the vesicular membrane remains homogeneous (Figure 4, A and B). In both conditions, we measured the same average diffusion coefficient for the protein in the membrane, that is, 2.1 ± 1.3 μm2/s (median ± SD, n = 33 GPMVs from three independent measurements) with zinc and 2.1 ± 1.1 μm2/s (median ± SD, n = 33 GPMVs from three independent measurements) without zinc (Figure 4C). A more detailed analysis reveals also that APLP1 diffusion is comparable to the monomeric reference myr-palm-YFP in GPMVs, whereas it is much slower in cells (outside junctions): Dmyr-palm-YFP/DAPLP1-YFP is 5 ± 1 in cells (Figure 1E and Supplemental Figure S3), whereas the corresponding value measured in GPMVs is 1.5 ± 0.7 (Figure 4C).
FIGURE 4:

APLP1-YFP oligomerization and diffusion in GPMVs are not affected by zinc. (A) A GPMV forming from an APLP1-YFP–expressing HEK cell. Yellow arrow represents an sFCS line scan across the GPMV. (B) A GPMV forming from an APLP1-YFP–expressing HEK cell incubated with 50 µM ZnCl2 for 20 min after 45 min of incubation with NEM (see Materials and Methods). (C) Diffusion coefficients measured for APLP1-YFP (before and after incubation with zinc) and myr-palm-YFP in GPMVs. (D) Normalized brightness values measured for APLP1-YFP in GPMVs before and after incubation with zinc. Values are normalized to the average brightness measured for myr-palm-YFP in GPMVs under the same conditions. Data are pooled from 33 GPMVs measured in three independent experiments. Error bars represent mean ± SD. “ns” indicates no statistically significant differences were determined with Welch’s two-sided t test.
To determine the oligomerization state of APLP1 in the GPMVs, we measured the brightness of myr-palm-YFP in GPMVs on the same day and normalized the measured APLP1-YFP brightness to that value. As shown in Figure 4D, the average normalized brightness of APLP1 is 1.9 ± 1.4 (median ± SD, n = 33 GPMVs from three independent measurements) in the absence of zinc and 2.0 ± 2.3 (median ± SD, n = 33 from three independent measurements) in the presence of 50 µM zinc ions. These data indicate that the protein forms, on average, cis dimers in GPMVs independent of the presence of zinc.
APLP1 does not interact in trans at contacts of cells and GPMVs
The experiments on GPMVs described in the preceding paragraph focused on the role of the cytoskeleton in influencing APLP1 cis interactions and macromolecular clustering. To extend these experiments to trans interactions and adhesion, we performed measurements on GPMV-cell contacts, both in the presence and absence of zinc. GPMVs produced from APLP1-YFP–expressing cells were mixed with APLP1-Card–expressing cells (see Materials and Methods for details), and vesicles in contact with fluorescent cells were analyzed. (Note that an analogous experiment carried out by mixing GPMVs containing APLP1-YFP and GPMVs containing APLP1-Card could not be performed because stable contacts between GPMVs were observed only very rarely.) In the absence of zinc, we observed a homogeneous distribution of APLP1 in the contact area, both in GPMVs and in cells (Figure 5A). Upon zinc addition, we observed rapid clustering of APLP1 only at the PM of intact cells but no change in the homogeneous distribution of APLP1 in GPMVs. We observed neither an enrichment of APLP1-YFP nor the formation of APLP1-YFP/APLP1-Card clusters at the GPMV-cell contacts (see Figure 5B). To quantitatively probe APLP1 trans interactions at GPMV-cell contacts, we performed two-color sFCS measurements across these contacts in both the presence and absence of zinc. Figure 5 shows the ACFs and CCFs obtained from the analysis of fluorescence fluctuations before (Figure 5C) and after (Figure 5D) the addition of 50 µM ZnCl2. The amplitudes of the obtained curves were used to calculate relative cross-correlations, as described in the preceding paragraphs. In both cases, we detected no significant cross-correlation of the GPMV and cell signal, that is, no correlated dynamics of APLP1-YFP and APLP1-Card at GPMV-cell contact sites. As shown in Figure 5E, the relative cross-correlation values obtained in the absence (0.07 ± 0.05, mean ± SD, n = 6 cells from three independent measurements) and presence (0.05 ± 0.09, mean ± SD, n = 12 cells from three independent measurements) of zinc were in the range of the values obtained for the negative control in cell–cell measurements (0.08 ± 0.10, mean ± SD, n = 17 cells from three independent measurements; Supplemental Figure S2 and Figure 1C). Thus, we conclude that APLP1 trans interactions are not detectable at contacts between GPMVs and cells, independently from the presence of zinc. The analysis of ACFs shown in Figure 5, C and D, also yields normalized brightness and diffusion times (and diffusion coefficients) for APLP1 at the contacts between cells and GMPVs in the absence and presence of zinc. Tables 1 and 2 show a summary of the obtained results and include those reported in the preceding paragraphs as well. In the absence of zinc, we observed a reduction of APLP1 (in GPMVs) dynamics at cell-GPMV junctions, similar to what we observed in cell–cell junctions. Interestingly, dynamics of APLP1 in cells were not affected in this case. In the presence of zinc, we observed only a 30% reduction in APLP1 diffusivity in GPMVs (Figure 5F). The observed decrease in protein dynamics is very small compared with that observed in cell membranes under the same conditions. Similarly, we observed only a modest increase in APLP1 (in GPMVs) multimerization in cell-GPMV junctions compared with the increase observed for cell–cell junctions under the same conditions (see also Figures 2D, 3, G and H, and 5G).
FIGURE 5:

APLP1 does not interact in trans at GPMV-cell contacts independently from zinc. (A, B) A GPMV containing APLP1-YFP in contact with an APLP1-Card–expressing HEK cell before (A) and after (B) 20-min zinc incubation. Yellow arrows represent a two-color sFCS line scan across the contact area. Scale bar is 5 μm. (C, D) Representative correlation functions and fit curves for two-color sFCS measurements without (C) and with (D) zinc. Red, ACF in red channel (APLP1-Card in cell); green, ACF in green channel (APLP1-YFP in GPMV); blue, CCF calculated between the two spectral channels. Correlation curves (solid lines) were obtained by fitting a two-dimensional diffusion model to the data. (E–G) Cross-correlation values (E), diffusion coefficients in GPMVs (F; normalized to APLP1 average value), and normalized brightness of APLP1-YFP in GPMVs (G) from all GPMV-cell contact measurements (six cells without and 12 cells with zinc in three independent experiments, shown as mean ± SD).
TABLE 1:
Summary of diffusion coefficients measured via sFCS.
| Cell PM | Cell–cell | GPMV | Cell-GPMV(GPMV side) | Cell-GPMV(cell side) | |
|---|---|---|---|---|---|
| APLP1 | 0.25 ± 0.09 | 0.09 ± 0.06 | 2.1 ± 1.1 | 1.04 ± 0.23 | 0.30 ± 0.11 |
| APLP1 + Zn | (∼10–2–10–3) | ∼10–3 | 2.1 ± 1.3 | 0.7 ± 0.3 | N/A |
| myr-palm-YFP | 1.3 ± 0.4 | 1.3 ± 0.3 | 3.2 ± 1.3 | N/A | N/A |
| GPI-YFP | 1.1 ± 0.3 | 1.1 ± 0.3 | N/A | N/A | N/A |
Diffusion coefficients (D [µm²/s)] were measured by analyzing the decay of sFCS ACFs outside cell–cell junctions, within cell–cell junctions, in free-standing GPMVs, and in junctions between cells and GPMVs. In the latter case, values are provided for APLP1-YFP in GPMVs (GPMV side) or APLP1-Card in cells (cell side). Measurements were performed also in the presence of 50 µM ZnCl2 (see the text) and for model membrane-associated proteins myr-palm-YFP and GPI-YFP. Values are shown as mean ± SD.
TABLE 2:
Summary of normalized brightness values measured via sFCS.
| Cell PM | Cell–cell | GPMV | Cell-GPMV (GPMV side) | |
|---|---|---|---|---|
| APLP1 | N/A | 3.0 ± 2.9 | 1.9 ± 1.4 | 1.8 ± 1.2 |
| APLP1 + Zn | N/A | 21 ± 20 | 2.0 ± 2.3 | 6 ± 7 |
Normalized APLP1-YFP brightness was measured by analyzing sFCS ACFs outside cell–cell junctions, within cell–cell junctions, in free-standing GPMVs, and in junctions between cells and GPMVs. In the latter case, values are provided only for APLP1-YFP in GPMVs (GPMV side). Measurements were also performed in the presence of 50 µM ZnCl2 (see the text). Values are shown as median ± SD.
Finally, in order to further investigate the possibility that the actin meshwork is involved in APLP1 multimerization, we stained filamentous actin in cells expressing APLP1-Card using Lifeact–green fluorescent protein (Lifeact-GFP; Riedl et al., 2010). Our results (Supplemental Figure S5) indicate that the presence of zinc induces accumulation of filamentous actin at cell–cell junctions, in proximity of APLP1 trans clusters.
DISCUSSION
APP and its paralogues APLP1 and APLP2 have an important role in nervous system development and associated pathologies (Vassar et al., 1999; Coulson et al., 2000; Selkoe, 2001; Eggert et al., 2004; Li and Südhof, 2004; Blennow et al., 2006). Various studies proposed that APLP1 acts as a homotypic neuronal adhesion receptor (Soba et al., 2005; Kaden et al., 2009; Mayer et al., 2016; Schilling et al., 2017) although, until now, little evidence of protein–protein trans interactions (i.e., among proteins from two different cells at a junction) has been provided in living cells (Soba et al., 2005; Kaden et al., 2009).
In this study, we addressed the mechanisms of multimerization and the diffusion dynamics of APLP1 with experimental assays that allowed us to specifically probe cis and trans interactions of APLP1 directly in living HEK cells. This specific cellular model was chosen based on earlier studies (Mayer et al., 2014, 2016) demonstrating that zinc-mediated multimerization at the PM occurs similarly in HEK and neuronal cells. Furthermore, HEK cells do not express endogenous APLP1 (Lorent et al., 1995; Su et al., 2004). As a consequence, APLP1 multimers contain only fluorescent APLP1 molecules, and their stoichiometry can be correctly characterized by fluorescence fluctuation analysis.
Cross-correlation sFCS and N&B analysis indicate the presence of trans binding of small APLP1 cis oligomers (i.e., APLP1-YFP/APLP1-Card complexes), as evidenced by the data in Figures 1C and 3D. It is worth noting that the techniques used in this work detect the formation of (cis or trans) complexes by quantifying the codiffusion of its components. It cannot be excluded, in general, that such complexes also include proteins other than APLP1. Nevertheless, brightness measurements clearly indicate that the observed cis oligomers contain, on average, approximately three APLP1 monomers (see Figures 2D and 3G). Notably, APLP1 trans binding appears to be incomplete, that is, a considerable fraction of APLP1 proteins forms exclusively cis oligomers and does not interact with other APLP1 molecules in the neighboring cell. The existence of intermolecular interactions involving APLP1 occurring specifically at cell–cell junctions is also corroborated by our diffusion measurements. We found a significantly reduced mobility of APLP1 at cell–cell contacts compared with other areas of the PM (Figure 1E), in good agreement with previously published fluorescence recovery after photobleaching data (Kaden et al., 2009).
Recent studies indicated a crucial role of metal ions, predominantly zinc and copper, in driving the oligomerization of APP family proteins (Baumkötter et al., 2014; Mayer et al., 2014; Wild et al., 2017). Zinc ions binding to the extracellular domain of the protein induce multimerization of APLP1 and enrichment of these multimers at cell–cell contact sites (Mayer et al., 2014, 2016). Nevertheless, the role of zinc in specifically promoting APLP1 trans interactions in a junction between living cells had not been directly proven yet. For this reason, we performed experiments on mixed-cell populations expressing two differently labeled APLP1 constructs in the presence of zinc. We observed a rapid formation of large protein platforms at cell–cell contact sites containing APLP1 from both neighboring cells (see Figures 2A and 3B and Supplemental Figure S4). Two-color sFCS measurements indicated remarkably slow dynamics for these APLP1 clusters (i.e., 10–3 μm2/s, which is 100-fold lower than APLP1 without zinc), probably because of their size. Furthermore, we detected a cross-correlation significantly higher than that measured in the absence of zinc (Figure 2C). Using a complementary approach (i.e., ccN&B), we found once more a cross-correlation significantly higher than that measured in the absence of zinc (Figure 3, D and E) or for a negative control sample featuring no trans interactions (Figure 3F). Thus we conclude that zinc enhances, at least indirectly, the formation of APLP1 trans complexes along cell–cell contacts. On the basis of a brightness analysis (Figures 2D and 3H) deriving from both sFCS and cross-correlation analysis, we found that these complexes can consist of up to ≈50–100 APLP1 monomers interacting in trans through the junction.
Several studies on various cell–cell interactions show that adhesion and signaling of transmembrane receptors are closely linked to the cytoskeletal organization underneath the membrane (Nelson, 2008; Mui et al., 2016). The cytoskeleton also strongly affects lateral distribution and dynamics of membrane constituents (lipids, proteins), for example, by restricting the free diffusion of transmembrane proteins spatially (Kusumi et al., 1993; Kusumi and Sako, 1996; Iino et al., 2001; Fujiwara et al., 2002; Saha et al., 2015). Given the size and putative role of APLP1 clusters as adhesion platforms, it might be possible that the cellular cytoskeleton is involved in APLP1–APLP1 interactions. Therefore, we investigated APLP1 diffusion and oligomerization in cell-derived GPMVs, a cytoskeleton-free, native membrane model system (Sezgin et al., 2012; Schneider et al., 2017). To our surprise, we did not find any zinc-induced alteration of APLP1 localization, diffusion, or brightness. Both before and after zinc treatment, APLP1-YFP was homogeneously distributed in GPMVs. Of interest, APLP1 normalized brightness measured via sFCS was ∼2, indicating the presence of APLP1 cis dimers on average in both the presence and absence of zinc. This value is in line with previous measurements of APLP1 cis oligomerization in cells using N&B (Mayer et al., 2016) and biochemical studies (Mayer et al., 2014) and indicates that zinc does not have a significant effect on APLP1–APLP1 interaction in this specific model. Furthermore, we observed that APLP1 diffusion in the PM is significantly slower than a model inner leaflet–associated protein (myr-palm-YFP). On the other hand, APLP1 and myr-palm-YFP dynamics are very similar in GPMVs, suggesting that APLP1 interacts with the cytoskeleton in intact cells (Figure 4C). These observations support the possibility that APLP1 dynamics and lateral interactions are influenced by the stable actin mesh via, for example, a corralling mechanism (see, e.g., the “picket fence” model [ Kusumi et al., 2012]). This putative specific interaction between cytoskeleton and APLP1 (e.g., via the YENPTY motif; see Guénette et al. [2017] and Sosa et al. [2017]) appears to be required for zinc-induced cis oligomerization to occur.
The results we presented so far are in full agreement with the model we have previously proposed, according to which, in general, zinc ions mediate APLP1–APLP1 interactions. Nevertheless, it is not yet clear whether zinc mediates both cis and trans interaction via the same molecular mechanism. To investigate this issue, we produced mixed samples of GPMVs and cells and probed APLP1 trans interactions at GPMV-cell contact sites using two-color sFCS. This experiment aimed at verifying whether zinc can, in general, also promote trans interactions between small cis oligomers and large cis multimers (or, alternatively, whether large cis multimers are required on both cells). In contrast to the case of cell–cell contacts, we detected no significant cross-correlation between the fluorescence signals from APLP1 in GPMVs and in cell membranes, also in the presence of zinc (Figure 5E). Also, no spatial colocalization of large protein domains was observed. In more detail, we observed zinc-induced APLP1 clustering in cells, as expected from the previous results, whereas APLP1 in the neighboring GPMV remained homogeneously distributed, featuring only a minor reduction in diffusivity and a modest increase in brightness compared with those observed in intact cell membranes (see Tables 1 and 2). It must be noted, however, that GPMVs differ from PMs not only in the absence of cytoskeleton, but also in terms of lipid composition and transmembrane asymmetry (Sezgin et al., 2012). On one hand, these factors might also affect protein dynamics and protein–protein interaction. On the other hand, previous studies (Guénette et al., 2017; Sosa et al., 2017) and the direct observation of filamentous actin enrichment at the sites of zinc-induced APLP1 clustering (Supplemental Figure S5) support the possibility that the cytoskeleton plays an important role in APLP1–APLP1 interactions.
Taken together, our results indicate that zinc promotes the formation of large APLP1 cis multimers in the presence of an intact cytoskeleton. Nevertheless, the absence of trans interactions between large cis multimers and small cis oligomers in the presence of zinc suggests that the metal does not directly mediate such trans interactions. We propose, therefore, that zinc promotes first the formation of large cis multimers (see Figure 6). Subsequently, interactions between facing cis multimers are established and likely stabilized by the large free energy gain derived from multiple and concurrent APLP1–APLP1 trans interactions. In agreement with this model, trans interactions involving small cis multimers can occur but appear weaker and/or transient in the absence (Figures 1C and 3D) or presence (Figure 5) of zinc. This model is also supported by recent observations indicating that zinc binding is mediated by the E2 domain of APLP1 (Mayer et al., 2014), whereas trans interactions occur via the E1 domain (Stahl et al., 2014).
FIGURE 6:

Model for APLP1–APLP1 interaction in the presence of zinc and formation of APLP1 cell–cell adhesion platforms. In the absence of zinc, only small cis oligomers are present. Trans interactions among protein complexes across cell–cell junctions are weak. Our data regarding protein diffusion suggest the existence of possible interactions between APLP1 and cortical actin network (red). The exact nature of such interaction has yet to be identified. In the presence of physiological zinc concentration (and an intact cortical actin cytoskeleton), APLP1 cis oligomers coalesce into large cis multimers (∼10–50 molecules, figure not drawn to scale). Such protein clusters interact strongly across the cell junction, possibly because of the establishment of multiple APLP1–APLP1 trans interactions. It might be possible that unknown proteins (green) are also included in APLP1 multimers.
On the basis of previous measurements (Mayer et al., 2014, 2016), we argue that the results we obtained for HEK cells might be transferable and highly relevant also in the context of cell–cell interaction in the nervous system in vivo. In more detail, it was shown that APLP1 forms clusters along the soma and dendritic PM of rat hippocampal neurons in the presence of zinc (Mayer et al., 2014). In addition, we previously observed zinc-enhanced cell adhesion of cortical neurons on a substrate printed with immobilized APLP1 ectodomain (Mayer et al., 2016). Finally, a very recent study shows that APLP1 is pre- and postsynaptically expressed in brain tissue and up-regulated during postnatal development coinciding with synaptogenesis (Schilling et al., 2017). According to the model presented in this work, the formation of large cis complexes (caused by the presence of zinc ions and supported by the actin cortex) is required for the establishment of stable APLP1–APLP1 trans interactions and, therefore, might enable APLP1 to function as a synaptic adhesion molecule in vivo.
MATERIALS AND METHODS
Cell culture
HEK cells from the 293T line (ACC 305; DMSZ, Braunschweig, Germany) were cultured in DMEM with the addition of fetal bovine serum (10%) and l-glutamine (1%) and passaged every 3 d and no more than 10 times. Mycoplasma contamination tests and morphology tests were performed every 3 mo and 2 wk, respectively. All solutions, buffers, and media used for cell culture were purchased from PAN-Biotech (Aidenbach, Germany). For one-color experiments and measurements involving the myr-palm-Card-YFP tandem, 6 × 10⁵ cells were seeded in 35-mm dishes (CellVis, Mountain View, CA) with optical glass bottoms 24 h before transfection. For cell-mixing experiments, cells were seeded in a six-well plate (Eppendorf, Wesseling-Berzdorf, Germany) with 8 × 10⁵ cells per well.
Plasmids and cloning
The APLP1-YFP (Mayer et al., 2014) and mCardinal-N1 (Chu et al., 2014) plasmids were used to clone the APLP1-Card plasmid. The mCardinal-N1/-C1 constructs were gifts from Michael Davidson (Florida State University; Addgene plasmids no. 54590 and 54799). APLP1 insert was amplified using custom-designed primers and a standard PCR protocol, digested by XhoI and AgeI Fast Digest Enzymes (Thermo Fisher Scientific, Darmstadt, Germany), and ligated to the digested mCardinal-N1 vector with T4 DNA Ligase (Thermo Fisher Scientific, Darmstadt, Germany). Myr-palm-YFP (myristoylated and palmitoylated peptide fused to YFP) was a gift from Andreas Herrmann (Humboldt Universitaet zu Berlin). It encodes the amino acid sequence MGCIKSKRKDNLNDDEPPVAT derived from the N-terminus of the Lyn kinase (Engel et al., 2010). A monomeric YFP was first obtained from pEYFP-N1 (Addgene plasmid no. 2689) including the A206K mutation in order to reduce any tendency to build homodimers (von Stetten et al., 2012). The myristoylation/palmitoylation sequence was then subcloned into the multicloning site of mEYFP-N1 (Engel et al., 2010). GPI-YFP, also containing the A206K mutation, was a gift from Roland Schwarzer (Gladstone Institute, San Francisco; Schwarzer et al., 2014).
The myr-palm-Card plasmid was cloned using a modified mCardinal-C1 vector. First, a ScaI restriction site was inserted into the mCardinal-C1 vector by using the QuickChange protocol. Second, the myr-palm peptide was amplified from the myr-palm-YFP plasmid using custom-designed primers. After digestion with NheI and ScaI, the peptide was ligated to the digested mCardinal-C1 vector.
To clone the myr-palm-Card-YFP plasmid, YFP was amplified from myr-palm-YFP using custom-made primers. YFP insert and myr-palm-Card vector were digested with HindIII and KpnI, and the products were ligated using the T4 DNA Ligase. CD86 was amplified from CD86–enhanced green fluorescent protein (a kind gift from Richard J. Ward, University of Glasgow; Zakrys et al., 2014) using custom-made primers, digested with KpnI and AgeI restriction enzymes, and ligated with the digested mEYFP-N1 vector using the T4 DNA Ligase, thus obtaining CD86-YFP. Sequences of all vectors were verified by DNA sequencing (LGC Berlin, Germany). Lifeact-GFP was a kind gift from the Eggeling Lab (Oxford University; Schneider et al., 2017).
Preparation for microscopy experiments
For one-color measurements, cells were transfected 16–20 h before the experiment using between 250 ng (myr-palm-Card/-YFP) and 1 μg (APLP1-Card/-YFP) plasmid per dish. Plasmids were incubated for 20 min with 2.5–4 μl Turbofect (Thermo Fisher Scientific, Darmstadt, Germany) per dish and 50 μl serum-free medium according to the manufacturer instructions and then added dropwise to the cells. For cell-mixing experiments, cells were washed 4 h after transfection with phosphate-buffered saline (+/+) and detached by gentle shaking using 50 μl trypsin EDTA. Then, cells were resuspended in 2 ml medium by pipetting up and down, mixed, and seeded on new dishes.
For measurements of APLP1 multimerization, culture medium was replaced by 4-(2-hydroxyethyl)-1-piperazineethanesulfonic acid (HEPES) buffer (10 mM HEPES, pH 7.1, containing 135 mM NaCl, 6 mM KCl, and 5.5 mM glucose) after two washing steps with the same buffer. When zinc was required, the buffer was supplemented with 50 μM ZnCl2. Microscopy was performed after 20 min of incubation in zinc-containing buffer at room temperature.
GPMV preparation
GPMVs were produced following the N-ethylmaleimide (NEM) protocol (Sezgin et al., 2012). Briefly, cells were washed twice and incubated for 45 min in NEM buffer (2 mM NEM, 10 mM HEPES, 150 mM NaCl, 2 mM CaCl2, pH 7.4) at 37°C. Afterward, the NEM buffer was replaced by the HEPES buffer used for all imaging experiments. For sFCS measurements, blebs that were still attached to cells were selected to avoid out-of-focus movement or drift.
For GPMV-cell contact measurements, blebbing of APLP1-YFP–expressing cells was induced for 45 min in NEM buffer. After incubation, most of the GPMVs were still attached to adherent cells. Cells were washed once in HEPES buffer and detached in 150 μl HEPES buffer by pipetting and gentle shaking. The resulting 150-μl suspension was added to the center of a dish containing APLP1-Card–expressing cells previously washed with HEPES buffer. To increase the number of GPMVs and thus the probability of finding GPMVs and cells in contact, GPMVs from two dishes were pooled and added to one cell dish. After 10 min of initial settling, HEPES buffer was added to a final volume of 2 ml per dish. Imaging was started 30 min after mixing to allow GPMVs to settle down. When zinc was required, 50 μM ZnCl2 was added after settling and incubated for 20 min before imaging.
Confocal microscopy imaging
Confocal imaging, sFCS, and ccN&B measurements were performed on a Zeiss LSM780 system (Carl Zeiss, Oberkochen, Germany) using a 40×, 1.2 numerical aperture water-immersion objective. Samples were excited with a 488-nm argon laser (YFP fluorophore) or a 561-nm diode laser (Card fluorophore). For one-color measurements, fluorescence was detected between 499 and 695 nm, after passing through a 488-nm dichroic mirror, using GaAsP detectors. For two-color measurements, fluorophores were excited and detected sequentially for different regions of the spectrum. Excitation and detection light were separated using a 488/561-nm dichroic mirror. YFP fluorescence was detected between 499 and 695 nm, and mCardinal fluorescence was detected between 570 and 695 nm.
sFCS
For one-color sFCS measurements, a line scan of 128 × 1 pixels (pixel size 160 nm) was performed perpendicular to the membrane with a 472.73-µs (for GPMV measurements) or 945.45-µs scan time (for cell measurements). Typically, 250,000–300,000 lines were acquired (total scan time ∼2–4 min) in photon counting mode. Laser powers were adjusted to keep depletion due to photobleaching below 50%. Typical values were ∼0.7 µW for cell measurements and ∼1.8 µW for GPMV measurements. For two-color measurements, a scan time of 1890 µs was used for both channels, that is, sequential scans with 945.45 µs per channel. In the absence of zinc (faster APLP1 dynamics), ∼0.7-µW (488-nm) and ∼3-µW (561-nm) laser powers were used. In the presence of zinc (and thus much slower APLP1 dynamics), a 5-ms break in between each complete scan was introduced, and 100,000 scans were acquired with laser powers of ∼0.35 µW (488 nm) and ∼1.5 µW (561 nm). To maximize the fluorescence fluctuation signal, cells with the lowest detectable protein expression were selected. Scanning data were exported as TIFF files, imported, and analyzed in MATLAB (MathWorks, Natick, MA) using custom-written code. sFCS analysis follows the procedure described in Ries and Schwille (2006). Briefly, all lines were aligned as kymographs and divided into blocks of 1000 lines. In each block, lines were summed up column-wise, and the x position with maximum fluorescence was determined. This position defines the position of the membrane in each block and is used to align all lines to a common origin. Then, all aligned line scans were averaged over time and fitted with a Gaussian function. The pixels corresponding to the membrane were defined as the pixels that are within ±2.5 σ of the peak. In each line, these pixels were integrated, providing the membrane fluorescence time series F(t). When needed, a background correction was applied by subtracting the average pixel fluorescence value in the cytosol multiplied by 2.5 σ (in pixel units) from the membrane fluorescence, in blocks of 1000 lines (Dörlich et al., 2015). To correct for depletion due to photobleaching, the fluorescence time series was fitted with a two-component exponential function, and the previously introduced correction formula was applied (Ries et al., 2009). For two-color measurements, the alignment and correction procedure was independently performed for each channel. Finally, ACFs (Gauto) and, in the case of two-color experiments (g = green channel, r = red channel), CCFs (Gcross) were calculated as follows:
 |
 |
where  .
.
A model for two-dimensional diffusion in the membrane and a Gaussian focal volume geometry was fitted to the ACFs (Ries and Schwille, 2006):
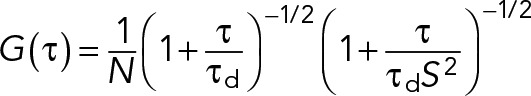 |
To calibrate the focal volume, point fluorescence correlation spectroscopy (FCS) measurements with Alexa 488 and rhodamine B dissolved in water at 50 nM were performed. In the fitting routine, the structure parameter S was fixed to the value determined in the calibration measurement (typically around 5). For one-color measurements, the particle number N and diffusion time τd were obtained from the fit. Diffusion coefficients (D) were calculated using the calibrated waist of the focal volume, 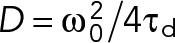 . The molecular brightness was calculated by dividing the mean count rate by the particle number determined from the fit,
  . For two-color measurements, all correlation functions were used to fit the diffusion model described above. Relative cross-correlation values were calculated from the amplitudes of the ACFs and CCFs:
 |
where  is the amplitude of the CCF and
  is the amplitude of the ACF in the ith channel (i = r, g). Diffusion coefficients and brightness values were calculated from the obtained fit parameters of the ACFs. Average diffusion coefficients and brightness values in the text are provided as mean or median (in the case of strongly skewed data distributions) ± SD from all measured cells or GPMVs.
ccN&B analysis
ccN&B experiments were performed as described in Digman et al. (2009) with a modified acquisition mode. Briefly, 100 images of 512 × 512 pixels were acquired per measurement using a 74-nm pixel size and 6.3-µs pixel dwell time sequentially for the two detection channels (switching channel every line). Laser powers were maintained low enough to keep bleaching below 10% of the initial fluorescence signal (typically ∼0.7 µW for 488 nm and ∼3 µW for 561 nm). For measurements in the presence of zinc, a 5-s break was introduced between each frame (in order to account for the slow dynamics of APLP1 clusters). CZI image output files were imported into MATLAB using the Bioformats package (Linkert et al., 2010) and analyzed using a self-written script. Before further analysis, pixels corresponding to cell–cell contacts were selected manually as regions of interest. Frames were aligned to the first frame by maximizing the spatial correlation between subselections in consecutive frames, averaged over both channels, as a function of arbitrary translations (Trullo et al., 2013). Brightness values (in both spectral channels and cross-correlation brightness) were calculated as described in Digman et al. (2008, 2009), and a boxcar algorithm was applied to filter extraneous long-lived fluctuations (Hellriegel et al., 2011; Mayer et al., 2016). Pixels with count rates >2 MHz were excluded from the analysis to avoid pile-up effects. To further calibrate the detector response, we measured the brightness on a reflective metal surface in each channel. The thus-obtained brightness-versus-intensity plot (which should be constant and equal to 0 for all intensity values) was used to correct the actual experimental data (Digman et al., 2008). Brightness and cross-correlation data are presented as histograms displaying values of all pixels corresponding to cell–cell contacts. Final values are provided as average or median (in the case of strongly skewed data distributions) cross-correlation brightness ± SEM.
Brightness calibration and fluorophore maturation
The molecular brightness, that is, the photon count rate per molecule, is used as a measure of the multimerization state by calibration with the brightness of a monomeric reference. This analysis is often based on the assumption that all fluorophores within a multimer are fluorescent. However, fluorescent proteins can undergo dark state transitions or be in a nonmature, nonfluorescent state (Chen et al., 2010). This issue has been reported in particular for red fluorescent proteins (Hendrix et al., 2008) and can be noticed in different amplitudes of the fluorescence ACF of tandem dimers (Foo et al., 2012). We have observed that the ACF amplitude for the Card channel is typically much higher than that of YFP in two-color sFCS measurements of a myr-palm-Card-YFP tandem control (Supplemental Figure S1). We attribute this effect to a lower maturation probability of Card compared with YFP. Therefore, to maximize the dynamic range of the brightness analysis, we restricted our analysis to YFP.
To estimate the maturation probability of YFP, we designed a myr-palm-YFP-YFP tandem and measured its brightness using sFCS and N&B. We found a normalized brightness of ∼1.6 for the dimer, which corresponds to a maturation probability pm of ≈60%. We used this value to normalize all brightness data of APLP1-YFP (sFCS and N&B) using the transformation
 |
where  is the measured apparent molecular brightness and B1 is the molecular brightness of a monomer (e.g., myr-palm-YFP). The transformation formula was derived assuming a binomial probability distribution for the fluorescence of the n fluorescence units in an n-mer. The normalized brightness indicates then the true oligomeric size of the complexes. This calibration procedure was applied to both sFCS and N&B measurements.
Code availability
MATLAB custom-written code is available upon request from the corresponding author.
Supplementary Material
Acknowledgments
This work was supported by grants from the Deutsche Forschungsgemeinschaft (MU901 and CH 1238/3 to G.M. and S.C., respectively) and Canadian Institute of Health Research Grant no. MOP-133411 (to G.M.). G.M. holds a Canada Research Chair in Molecular Pharmacology.
Abbreviations used:
- ACF
auto-correlation function
- APLP1 and -2
amyloid precursor–like proteins 1 and 2
- APP
amyloid precursor protein
- Card
mCardinal
- CCF
cross-correlation function
- ccN&B
cross-correlation number and brightness
- FCS
fluorescence correlation spectroscopy
- GPI
glycosylphosphatidylinositol
- GPMV
giant plasma membrane vesicle
- HEK
human embryonic kidney
- HEPES
4-(2-hydroxyethyl)-1-piperazineethanesulfonic acid
- myr
myristoylated
- N&B
number and brightness
- NEM
N-ethylmaleimide
- palm
palmitoylated
- PM
plasma membrane
- sFCS
scanning fluorescence correlation spectroscopy
- YFP
yellow fluorescent protein.
Footnotes
This article was published online ahead of print in MBoC in Press (http://www.molbiolcell.org/cgi/doi/10.1091/mbc.E17-07-0459) on October 11, 2017.
REFERENCES
- Bacia K, Kim SA, Schwille P. Fluorescence cross-correlation spectroscopy in living cells. Nat Methods. 2006;3:83–89. doi: 10.1038/nmeth822. [DOI] [PubMed] [Google Scholar]
- Baumkötter F, Schmidt N, Vargas C, Schilling S, Weber R, Wagner K, Fiedler S, Klug W, Radzimanowski J, Nickolaus S, et al. Amyloid precursor protein dimerization and synaptogenic function depend on copper binding to the growth factor-like domain. J Neurosci. 2014;34:11159–11172. doi: 10.1523/JNEUROSCI.0180-14.2014. [DOI] [PMC free article] [PubMed] [Google Scholar]
- Baumkötter F, Wagner K, Eggert S, Wild K, Kins S. Structural aspects and physiological consequences of APP/APLP trans-dimerization. Exp Brain Res. 2012;217:389–395. doi: 10.1007/s00221-011-2878-6. [DOI] [PMC free article] [PubMed] [Google Scholar]
- Blennow K, de Leon MJ, Zetterberg H. Alzheimer’s disease. Lancet Neurol. 2006;368:387–403. doi: 10.1016/S0140-6736(06)69113-7. [DOI] [PubMed] [Google Scholar]
- Bobone S, Hilsch M, Storm J, Dunsing V, Herrmann A, Chiantia S. Phosphatidylserine lateral organization influences the interaction of influenza virus patrix protein 1 with lipid membranes. J Virol. 2017;91:e00267–17. doi: 10.1128/JVI.00267-17. [DOI] [PMC free article] [PubMed] [Google Scholar]
- Chen Y, Johnson J, Macdonald P, Wu B, Mueller JD. Observing protein interactions and their stoichiometry in living cells by brightness analysis of fluorescence fluctuation experiments. Methods Enzymol. 2010;472:345–363. doi: 10.1016/S0076-6879(10)72026-7. [DOI] [PubMed] [Google Scholar]
- Chu J, Haynes RD, Corbel SPY, Li P, González-González E, Burg JS, Ataie NJ, Lam AJ, Cranfill PJ, Baird MA, et al. Non-invasive intravital imaging of cellular differentiation with a bright red-excitable fluorescent protein. Nat Methods. 2014;11:572–578. doi: 10.1038/nmeth.2888. [DOI] [PMC free article] [PubMed] [Google Scholar]
- Coulson EJ, Paliga K, Beyreuther K, Masters CL. What the evolution of the amyloid protein precursor supergene family tells us about its function. Neurochem Int. 2000;36:175–184. doi: 10.1016/s0197-0186(99)00125-4. [DOI] [PubMed] [Google Scholar]
- Digman MA, Dalal R, Horwitz AF, Gratton E. Mapping the number of molecules and brightness in the laser scanning microscope. Biophys J. 2008;94:2320–2332. doi: 10.1529/biophysj.107.114645. [DOI] [PMC free article] [PubMed] [Google Scholar]
- Digman MA, Wiseman PW, Choi C, Horwitz AR, Gratton E. Stoichiometry of molecular complexes at adhesions in living cells. Proc Natl Acad Sci USA. 2009;106:2170–2175. doi: 10.1073/pnas.0806036106. [DOI] [PMC free article] [PubMed] [Google Scholar]
- Dörlich RM, Chen Q, Niklas Hedde P, Schuster V, Hippler M, Wesslowski J, Davidson G, Nienhaus GU. Dual-color dual-focus line-scanning FCS for quantitative analysis of receptor-ligand interactions in living specimens. Sci Rep. 2015;5:10149. doi: 10.1038/srep10149. [DOI] [PMC free article] [PubMed] [Google Scholar]
- Eggert S, Paliga K, Soba P, Evin G, Masters CL, Weidemann A, Beyreuther K. The proteolytic processing of the amyloid precursor protein gene family members APLP-1 and APLP-2 involves α-, β-, γ-, and ϵ-like cleavages. J Biol Chem. 2004;279:18146–18156. doi: 10.1074/jbc.M311601200. [DOI] [PubMed] [Google Scholar]
- Engel S, Scolari S, Thaa B, Krebs N, Korte T, Herrmann A, Veit M. FLIM-FRET and FRAP reveal association of influenza virus haemagglutinin with membrane rafts. Biochem J. 2010;425:567–573. doi: 10.1042/BJ20091388. [DOI] [PubMed] [Google Scholar]
- Foo YH, Naredi-Rainer N, Lamb DC, Ahmed S, Wohland T. Factors affecting the quantification of biomolecular interactions by fluorescence cross-correlation spectroscopy. Biophys J. 2012;102:1174–1183. doi: 10.1016/j.bpj.2012.01.040. [DOI] [PMC free article] [PubMed] [Google Scholar]
- Fujiwara T, Ritchie K, Murakoshi H, Jacobson K, Kusumi A. Phospholipids undergo hop diffusion in compartmentalized cell membrane. J Cell Biol. 2002;157:1071–1082. doi: 10.1083/jcb.200202050. [DOI] [PMC free article] [PubMed] [Google Scholar]
- Guénette S, Strecker P, Kins S. APP protein family signaling at the synapse: insights from intracellular APP-binding proteins. Front Mol Neurosci. 2017;10:87. doi: 10.3389/fnmol.2017.00087. [DOI] [PMC free article] [PubMed] [Google Scholar]
- Heber S, Herms J, Gajic V, Hainfellner J, Aguzzi A, Rülicke T, von Kretzschmar H, von Koch C, Sisodia S, Tremml P, et al. Mice with combined gene knock-outs reveal essential and partially redundant functions of amyloid precursor protein family members. J Neurosci. 2000;20:7951–7963. doi: 10.1523/JNEUROSCI.20-21-07951.2000. [DOI] [PMC free article] [PubMed] [Google Scholar]
- Hellriegel C, Caiolfa VR, Corti V, Sidenius N, Zamai M. Number and brightness image analysis reveals ATF-induced dimerization kinetics of uPAR in the cell membrane. FASEB J. 2011;25:2883–2897. doi: 10.1096/fj.11-181537. [DOI] [PMC free article] [PubMed] [Google Scholar]
- Hendrix J, Flors C, Dedecker P, Hofkens J, Engelborghs Y. Dark states in monomeric red fluorescent proteins studied by fluorescence correlation and single molecule spectroscopy. Biophys J. 2008;94:4103–4113. doi: 10.1529/biophysj.107.123596. [DOI] [PMC free article] [PubMed] [Google Scholar]
- Hilsch M, Goldenbogen BR, Sieben C, Höfer CT, Rabe P, Jr, Klipp E, Herrmann A, Chiantia S. Influenza A matrix pM1 multimerizes upon binding to lipid membranes. Biophys J. 2014;107:912–923. doi: 10.1016/j.bpj.2014.06.042. [DOI] [PMC free article] [PubMed] [Google Scholar]
- Iino R, Koyama I, Kusumi A. Single molecule imaging of green fluorescent proteins in living cells: E-cadherin forms oligomers on the free cell surface. Biophys J. 2001;80:2667–2677. doi: 10.1016/S0006-3495(01)76236-4. [DOI] [PMC free article] [PubMed] [Google Scholar]
- Kaden D, Voigt P, Munter L-M, Bobowski KD, Schaefer M, Multhaup G. Subcellular localization and dimerization of APLP1 are strikingly different from APP and APLP2. J Cell Sci. 2009;122:368–377. doi: 10.1242/jcs.034058. [DOI] [PubMed] [Google Scholar]
- Kusumi A, Fujiwara TK, Chadda R, Xie M, Tsunoyama TA, Kalay Z, Kasai RS, Suzuki KG. Dynamic organizing principles of the plasma membrane that regulate signal transduction: commemorating the fortieth anniversary of Singer and Nicolson’s fluid-mosaic model. Annu Rev Cell Dev Biol. 2012;28:215–250. doi: 10.1146/annurev-cellbio-100809-151736. [DOI] [PubMed] [Google Scholar]
- Kusumi A, Sako Y. Cell surface organization by the membrane skeleton. Curr Opin Cell Biol. 1996;8:566–574. doi: 10.1016/s0955-0674(96)80036-6. [DOI] [PubMed] [Google Scholar]
- Kusumi A, Sako Y, Yamamoto M. Confined lateral diffusion of membrane receptors as studied by single particle tracking (nanovid microscopy). Effects of calcium-induced differentiation in cultured epithelial cells. Biophys J. 1993;65:2021–2040. doi: 10.1016/S0006-3495(93)81253-0. [DOI] [PMC free article] [PubMed] [Google Scholar]
- Li Q, Südhof TC. Cleavage of amyloid-beta precursor protein and amyloid-beta precursor-like protein by BACE 1. J Biol Chem. 2004;279:10542–10550. doi: 10.1074/jbc.M310001200. [DOI] [PubMed] [Google Scholar]
- Linkert M, Rueden CT, Allan C, Burel J-M, Moore W, Patterson A, Loranger B, Moore J, Neves C, MacDonald D, et al. Metadata matters: access to image data in the real world. J Cell Biol. 2010;189:777–782. doi: 10.1083/jcb.201004104. [DOI] [PMC free article] [PubMed] [Google Scholar]
- Lorent K, Overbergh L, Moechars D, De Strooper B, Van Leuven F, Van den Berghe H. Expression in mouse embryos and in adult mouse brain of three members of the amyloid precursor protein family, of the alpha-2-macroglobulin receptor/low density lipoprotein receptor-related protein and of its ligands apolipoprotein E, lipoprotein lipase, alpha-2-macroglobulin and the 40,000 molecular weight receptor-associated protein. Neuroscience. 1995;65:1009–1025. doi: 10.1016/0306-4522(94)00555-j. [DOI] [PubMed] [Google Scholar]
- Machánˇ R, Wohland T. Recent applications of fluorescence correlation spectroscopy in live systems. FEBS Lett. 2014;588:3571–3584. doi: 10.1016/j.febslet.2014.03.056. [DOI] [PubMed] [Google Scholar]
- Mayer MC, Kaden D, Schauenburg L, Hancock MA, Voigt P, Roeser D, Barucker C, Than ME, Schaefer M, Multhaup G. Novel zinc-binding site in the E2 domain regulates amyloid precursor-like protein 1 (APLP1) oligomerization. J Biol Chem. 2014;289:19019–19030. doi: 10.1074/jbc.M114.570382. [DOI] [PMC free article] [PubMed] [Google Scholar]
- Mayer MC, Schauenburg L, Thompson-Steckel G, Dunsing V, Kaden D, Voigt P, Schaefer M, Chiantia S, Kennedy TE, Multhaup G. Amyloid precursor-like protein 1 (APLP1) exhibits stronger zinc-dependent neuronal adhesion than amyloid precursor protein and APLP2. J Neurochem. 2016;137:266–276. doi: 10.1111/jnc.13540. [DOI] [PubMed] [Google Scholar]
- Mui KL, Chen CS, Assoian RK. The mechanical regulation of integrin-cadherin crosstalk organizes cells, signaling and forces. J Cell Sci. 2016;129:1093–1100. doi: 10.1242/jcs.183699. [DOI] [PMC free article] [PubMed] [Google Scholar]
- Muller UC, Deller T, Korte M. Not just amyloid: physiological functions of the amyloid precursor protein family. Nat Rev Neurosci. 2017;18:281–298. doi: 10.1038/nrn.2017.29. [DOI] [PubMed] [Google Scholar]
- Nelson WJ. Regulation of cell-cell adhesion by the cadherin-catenin complex. Biochem Soc Trans. 2008;36:149–155. doi: 10.1042/BST0360149. [DOI] [PMC free article] [PubMed] [Google Scholar]
- Riedl J, Flynn KC, Raducanu A, Gartner F, Beck G, Bosl M, Bradke F, Massberg S, Aszodi A, Sixt M, Wedlich-Soldner R. Lifeact mice for studying F-actin dynamics. Nat Methods. 2010;7:168–169. doi: 10.1038/nmeth0310-168. [DOI] [PubMed] [Google Scholar]
- Ries J, Chiantia S, Schwille P. Accurate determination of membrane dynamics with line-scan FCS. Biophys J. 2009;96:1999–2008. doi: 10.1016/j.bpj.2008.12.3888. [DOI] [PMC free article] [PubMed] [Google Scholar]
- Ries J, Schwille P. Studying slow membrane dynamics with continuous wave scanning fluorescence correlation spectroscopy. Biophys J. 2006;91:1915–1924. doi: 10.1529/biophysj.106.082297. [DOI] [PMC free article] [PubMed] [Google Scholar]
- Saha S, Lee IH, Polley A, Groves JT, Rao M, Mayor S. Diffusion of GPI-anchored proteins is influenced by the activity of dynamic cortical actin. Mol Biol Cell. 2015;26:4033–4045. doi: 10.1091/mbc.E15-06-0397. [DOI] [PMC free article] [PubMed] [Google Scholar]
- Schilling S, Mehr A, Ludewig S, Stephan J, Zimmermann M, August A, Strecker P, Korte M, Koo EH, Muller UC, et al. APLP1 is a synaptic cell adhesion molecule, supporting maintenance of dendritic spines and basal synaptic transmission. J Neurosci. 2017;37:5345–5365. doi: 10.1523/JNEUROSCI.1875-16.2017. [DOI] [PMC free article] [PubMed] [Google Scholar]
- Schneider F, Waithe D, Clausen MP, Galiani S, Koller T, Ozhan G, Eggeling C, Sezgin E. Diffusion of lipids and GPI-anchored proteins in actin-free plasma membrane vesicles measured by STED-FCS. Mol Biol Cell. 2017;28:1507–1518. doi: 10.1091/mbc.E16-07-0536. [DOI] [PMC free article] [PubMed] [Google Scholar]
- Schwarzer R, Levental I, Gramatica A, Scolari S, Buschmann V, Veit M, Herrmann A. The cholesterol-binding motif of the HIV-1 glycoprotein gp41 regulates lateral sorting and oligomerization. Cell Microbiol. 2014;16:1565–1581. doi: 10.1111/cmi.12314. [DOI] [PubMed] [Google Scholar]
- Schwille P, Meyer-Almes FJ, Rigler R. Dual-color fluorescence cross-correlation spectroscopy for multicomponent diffusional analysis in solution. Biophys J. 1997;72:1878–1886. doi: 10.1016/S0006-3495(97)78833-7. [DOI] [PMC free article] [PubMed] [Google Scholar]
- Scolari S, Engel S, Krebs N, Plazzo AP, De Almeida RFM, Prieto M, Veit M, Herrmann A. Lateral distribution of the transmembrane domain of influenza virus hemagglutinin revealed by time-resolved fluorescence imaging. J Biol Chem. 2009;284:15708–15716. doi: 10.1074/jbc.M900437200. [DOI] [PMC free article] [PubMed] [Google Scholar]
- Selkoe DJ. Alzheimer’s disease: genes, proteins, and therapy. Physiol Rev. 2001;81:741–766. doi: 10.1152/physrev.2001.81.2.741. [DOI] [PubMed] [Google Scholar]
- Sezgin E, Kaiser H-J, Baumgart T, Schwille P, Simons K, Levental I. Elucidating membrane structure and protein behavior using giant plasma membrane vesicles. Nat Protoc. 2012;7:1042–1051. doi: 10.1038/nprot.2012.059. [DOI] [PubMed] [Google Scholar]
- Shariati SAM, De Strooper B. Redundancy and divergence in the amyloid precursor protein family. FEBS Lett. 2013;587:2036–2045. doi: 10.1016/j.febslet.2013.05.026. [DOI] [PubMed] [Google Scholar]
- Soba P, Eggert S, Wagner K, Zentgraf H, Siehl K, Kreger S, Löwer A, Langer A, Merdes G, Paro R, et al. Homo- and heterodimerization of APP family members promotes intercellular adhesion. EMBO J. 2005;24:3624–3634. doi: 10.1038/sj.emboj.7600824. [DOI] [PMC free article] [PubMed] [Google Scholar]
- Sosa LJ, Caceres A, Dupraz S, Oksdath M, Quiroga S, Lorenzo A. The physiological role of the amyloid precursor protein as an adhesion molecule in the developing nervous system. J Neurochem. 2017;143:11–29. doi: 10.1111/jnc.14122. [DOI] [PubMed] [Google Scholar]
- Stahl R, Schilling S, Soba P, Rupp C, Hartmann T, Wagner K, Merdes G, Eggert S, Kins S. Shedding of APP limits its synaptogenic activity and cell adhesion properties. Front Cell Neurosci. 2014;8:410. doi: 10.3389/fncel.2014.00410. [DOI] [PMC free article] [PubMed] [Google Scholar]
- Su AI, Wiltshire T, Batalov S, Lapp H, Ching KA, Block D, Zhang J, Soden R, Hayakawa M, Kreiman G, et al. A gene atlas of the mouse and human protein-encoding transcriptomes. Proc Natl Acad Sci USA. 2004;101:6062–6067. doi: 10.1073/pnas.0400782101. [DOI] [PMC free article] [PubMed] [Google Scholar]
- Trimble WS, Grinstein S. Barriers to the free diffusion of proteins and lipids in the plasma membrane. J Cell Biol. 2015;208:259–271. doi: 10.1083/jcb.201410071. [DOI] [PMC free article] [PubMed] [Google Scholar]
- Trullo A, Corti V, Arza E, Caiolfa VR, Zamai M. Application limits and data correction in number of molecules and brightness analysis. Microsc Res Tech. 2013;76:1135–1146. doi: 10.1002/jemt.22277. [DOI] [PubMed] [Google Scholar]
- Tyan S-H, Shih AY-J, Walsh JJ, Maruyama H, Sarsoza F, Ku L, Eggert S, Hof PR, Koo EH, Dickstein DL. Amyloid precursor protein (APP) regulates synaptic structure and function. Mol Cell Neurosci. 2012;51:43–52. doi: 10.1016/j.mcn.2012.07.009. [DOI] [PMC free article] [PubMed] [Google Scholar]
- Vassar R, Bennett BD, Babu-Khan S, Kahn S, Mendiaz EA, Denis P, Teplow DB, Ross S, Amarante P, Loeloff R, et al. Beta-secretase cleavage of Alzheimer’s amyloid precursor protein by the transmembrane aspartic protease BACE. Science. 1999;286:735–741. doi: 10.1126/science.286.5440.735. [DOI] [PubMed] [Google Scholar]
- von Stetten D, Noirclerc-Savoye M, Goedhart J, Gadella TWJ, Royant A, Royant A. Structure of a fluorescent protein from Aequorea victoria bearing the obligate-monomer mutation A206K. Acta Crystallogr F Struct Biol Commun. 2012;68:878–882. doi: 10.1107/S1744309112028667. [DOI] [PMC free article] [PubMed] [Google Scholar]
- Wang Z, Wang B, Yang L, Guo Q, Aithmitti N, Songyang Z, Zheng H. Presynaptic and postsynaptic interaction of the amyloid precursor protein promotes peripheral and central synaptogenesis. J Neurosci. 2009;29:10788–10801. doi: 10.1523/JNEUROSCI.2132-09.2009. [DOI] [PMC free article] [PubMed] [Google Scholar]
- Weyer SW, Klevanski M, Delekate A, Voikar V, Aydin D, Hick M, Filippov M, Drost N, Schaller KL, Saar M, et al. APP and APLP2 are essential at PNS and CNS synapses for transmission, spatial learning and LTP. EMBO J. 2011;30:2266–2280. doi: 10.1038/emboj.2011.119. [DOI] [PMC free article] [PubMed] [Google Scholar]
- Wild K, August A, Pietrzik CU, Kins S. Structure and synaptic function of metal binding to the amyloid precursor protein and its proteolytic fragments. Front Mol Neurosci. 2017;10:21. doi: 10.3389/fnmol.2017.00021. [DOI] [PMC free article] [PubMed] [Google Scholar]
- Zakrys L, Ward RJ, Pediani JD, Godin AG, Graham GJ, Milligan G. Roundabout 1 exists predominantly as a basal dimeric complex and this is unaffected by binding of the ligand Slit2. Biochem J. 2014;461:61–73. doi: 10.1042/BJ20140190. [DOI] [PubMed] [Google Scholar]
Associated Data
This section collects any data citations, data availability statements, or supplementary materials included in this article.