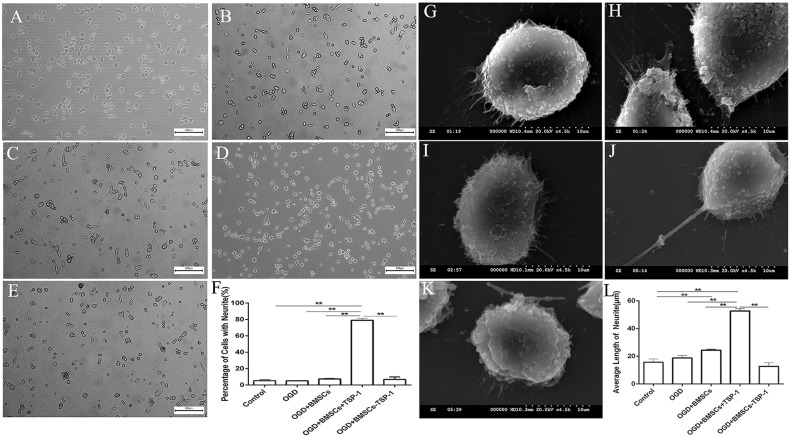
Figure 2. Effects of TSP-1-gene modified BMSCs on the neurite outgrowth in post-OGD VSC4.
1 motor neurons. (A-F) Comparison of the percentage of VSC4.1 with neurite after OGD injury through the optical microscope, with (A) Control, (B) OGD, (C) OGD+BMSCs, (D) OGD+BMSCs+TSP-1 and (E) OGD+BMSCs-TSP-1, Scale bars: 100μm. (F) The percentage of the number of the cells with neurite in the Control, OGD, OGD+BMSCs, OGD+BMSCs+TSP-1 and OGD+BMSCs-TSP-1 group. **P<0.01. (G-L) Comparison of the average length of neuritis after OGD injury through scanning electron microscopy, with (G) Control, (H) OGD, (I) OGD+BMSCs, (J) OGD+BMSCs+TSP-1 and (K) OGD+BMSCs-TSP-1, Scale bars:10μm. (L) The average length of cells with neurite in the Control, OGD+DMEM, OGD+BMSCs, OGD+BMSCs+TSP-1 and OGD+BMSCs-TSP-1 group. **P<0.01.

