Abstract
Conventional therapies for breast cancer brain metastases (BCBMs) have been largely ineffective because of chemoresistance and impermeability of the blood-brain barrier. A comprehensive understanding of the underlying mechanism that allows breast cancer cells to infiltrate the brain is necessary to circumvent treatment resistance of BCBMs. Here, we determined that expression of a long noncoding RNA (lncRNA) that we have named lncRNA associated with BCBM (Lnc-BM) is prognostic of the progression of brain metastasis in breast cancer patients. In preclinical murine models, elevated Lnc-BM expression drove BCBM, while depletion of Lnc-BM with nanoparticle-encapsulated siRNAs effectively treated BCBM. Lnc-BM increased JAK2 kinase activity to mediate oncostatin M– and IL-6–triggered STAT3 phosphorylation. In breast cancer cells, Lnc-BM promoted STAT3-dependent expression of ICAM1 and CCL2, which mediated vascular co-option and recruitment of macrophages in the brain, respectively. Recruited macrophages in turn produced oncostatin M and IL-6, thereby further activating the Lnc-BM/JAK2/STAT3 pathway and enhancing BCBM. Collectively, our results show that Lnc-BM and JAK2 promote BCBMs by mediating communication between breast cancer cells and the brain microenvironment. Moreover, these results suggest targeting Lnc-BM as a potential strategy for fighting this difficult disease.
Keywords: Cell Biology, Oncology
Keywords: Breast cancer
Introduction
Breast cancer brain metastasis (BCBM) is a serious health condition that negatively affects a patient’s quality of life, with median survival times between 4 and 6 months (1). Brain metastasis occurs in about 15% of women with newly diagnosed metastatic breast cancer (2). Clinically, patients with either the HER2-positive or the triple-negative type of breast cancer have significantly higher incidences of brain metastasis, ranging between 20% and 50% (3, 4). Although modern multidisciplinary care has been applied to treat cases of brain metastasis (5), the benefit of these treatments is limited by their palliative and localized tendencies (6). Therefore, there is an imperative need for the development of novel therapies based on the biological and molecular mechanisms of brain metastatic lesions. The blood-brain barrier (BBB), which is composed of nonfenestrated capillaries and astrocytes, effectively limits circulating tumor cells from entering the brain parenchyma (7). Animal models of brain metastasis show that metastatic cells arrested within brain capillary beds encounter brain microvascular endothelial cells, a necessary step for growth and invasion (8). Recent studies have revealed that L1 cell adhesion molecule (L1CAM) promotes breast cancer cell adhesion to brain capillaries and subsequent brain metastasis (9). Brain metastatic breast cancer cells secrete CCL2, to recruit myeloid cells, which promote the outgrowth of metastatic tumors (10). These studies signify the complicated and reciprocal crosstalk between tumor cells and the metastatic niche.
Long noncoding RNAs (lncRNAs) have been shown to modulate breast cancer–derived metastasis to the lung, liver, and lymph nodes (11–13). However, the role of lncRNAs in mediating BCBM is still unclear. Targeting of lncRNAs using locked nucleic acids or a siRNA-based strategy has been successfully applied in several preclinical models (12, 14). Here, we report that elevated expression of an lncRNA we refer to as Lnc-BM (long noncoding for brain metastasis) in primary breast cancer exhibits higher rates of recurrence to the brain. High Lnc-BM expression also promotes metastasis of breast cancer cells to the brain in preclinical mouse models. Furthermore, targeting of Lnc-BM by nanoparticle-coated siRNAs knocked down Lnc-BM in vivo and alleviated tumor burden in mouse brains. Mechanistically, Lnc-BM interacts with and activates the nonreceptor tyrosine kinase JAK2. The activated JAK2 phosphorylates STAT3, triggering activation of the downstream signaling pathway that includes the proteins ICAM1 and CCL2. ICAM1 is responsible for breast cancer cell adhesion to blood vessels of the brain and extravasation of metastatic lesions into the brain. CCL2 is a chemokine that is released into the microenvironment and that attracts macrophages to cancer cells. The attracted macrophages release the cytokines oncostatin M (OSM) and IL-6, both of which activate JAK2, triggering a positive-feedback loop that perpetuates the Lnc-BM/JAK2/STAT3 signaling axis that is crucial to the metastatic potential of breast cancer cells to the brain.
Results
Identification of Lnc-BM as a biomarker of BCBM.
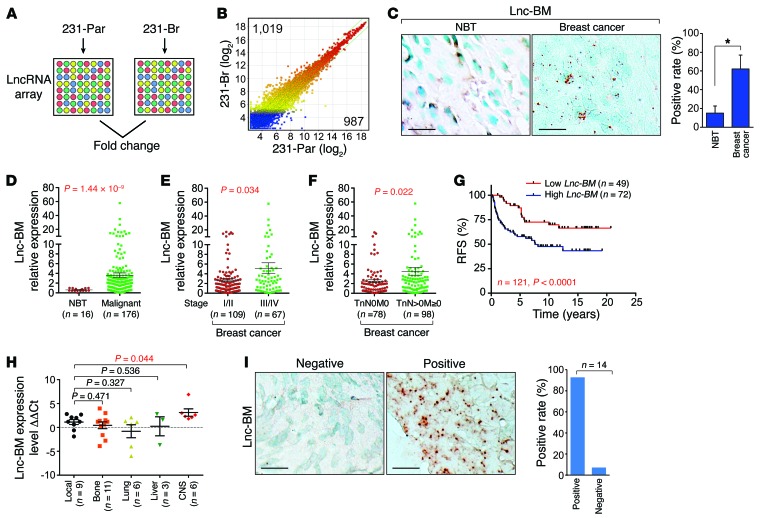
To identify BCBM-relevant lncRNAs, we assessed expression profiles of lncRNAs in parental MDA-MB-231 (231-Par) cells and isogenic brain metastatic cells (231-Br), by LncRNA array (Arraystar Inc.) (Figure 1, A and B; NCBI Gene Expression Omnibus [GEO] ID: GSE79540). Nine lncRNAs were upregulated in 231-Br compared with 231-Par according to the following criteria: (a) ratio of 231-Br/231-Par ≥2.5; (b) raw signal intensity ≥2,000; and (c) lncRNA length ≥300 (Supplemental Figure 1A; supplemental material available online with this article; https://doi.org/10.1172/JCI91553DS1). RP11-355I22.7 (AK055647) is referred to in this study as Lnc-BM. Compared with 231-Par cells, Lnc-BM expression was greatly upregulated in brain metastatic cells, but not in lung metastatic LM2 (15) or bone metastatic BoM-1833 (ref. 16 and Supplemental Figure 1, B–D). A splicing variant of SYT16 overlaps with Lnc-BM, which is undetectable in brain metastatic or nonbrain metastatic cells we tested (Supplemental Figure 1, B and C). The Lnc-BM sequence exhibited low protein coding potential (coding potential score, –1.18283, Coding Potential Calculator; http://lilab.research.bcm.edu/cpat/) and is primarily localized to the cytoplasm (Supplemental Figure 1, E and F).
Figure 1. Lnc-BM correlates with breast cancer and BCBM.
(A and B) LncRNA profiling in 231-Par and 231-Br cells. (C) RNAscope detection of Lnc-BM expression in human breast cancer and adjacent normal tissues. Left panel: Representative images. Right panel: Statistical analysis; 29 normal breast tissues (NBT), 118 breast cancer tissues, unpaired Student’s t test. Scale bars: 100 μm. (D–F) TissueScan Cancer Panels were analyzed by RT-qPCR for Lnc-BM expression in human breast cancer and adjacent normal tissues (1-way ANOVA). (G) Kaplan-Meier recurrence-free survival (RFS) analysis of Lnc-BM expression in breast cancer patients (n = 49 and 72 tissues, respectively, log rank test). (H) Determination of Lnc-BM expression in primary breast cancers with recurrence to local or distant sites by RT-qPCR. ΔCt: The Ct value of GAPDH was subtracted from the Ct value of Lnc-BM; ΔΔCt: the median of ΔCt of Lnc-BM from all samples was subtracted from the ΔCt value of each sample (1-way ANOVA). (I) RNAscope detection of Lnc-BM expression in BCBM tissues (n = 14 tissues). Scale bars: 100 μm. Data are mean ± SEM, *P < 0.05.
Using RNAscope, we found that only 15% of adjacent normal breast tissues compared with 62% of breast cancer tissues were Lnc-BM positive (Figure 1C and Supplemental Table 1). Lnc-BM was significantly overexpressed in breast cancer tissues versus normal tissues; in stages III–IV versus I–II of breast cancer; and in metastatic (TnN > 0M ≥ 0) versus nonmetastatic breast cancer (TnN0M0) (Figure 1, D–F). Consistently, Lnc-BM expression was elevated in TNBC cell lines and HER2-positive cell lines (BT474 and MDA-MB-361), both with brain metastatic potential (17, 18) when compared with normal mammary epithelial cells or estrogen receptor–positive (ER-positive) cells (Supplemental Figure 1G).
High Lnc-BM expression was negatively correlated with recurrence-free survival in breast cancer patients (Figure 1G). Importantly, primary breast cancer tissues with high Lnc-BM expression exhibited higher rates of recurrence to the CNS than local or other distant organs (Figure 1H), suggesting that Lnc-BM expression in the primary tumor may indicate an increased risk for brain metastasis. Furthermore, 92.9% of breast cancer brain metastatic tissues showed positive Lnc-BM staining (Figure 1I). These data suggest the importance of Lnc-BM in BCBM.
Using 4 pairs of independent single-guide RNAs (sgRNAs), we genetically depleted Lnc-BM using CRISPR/Cas9–mediated gene editing (19). The depletion of the RNA and genomic sequences was confirmed (Supplemental Figure 1, H and I).
Lnc-BM promotes BCBM.
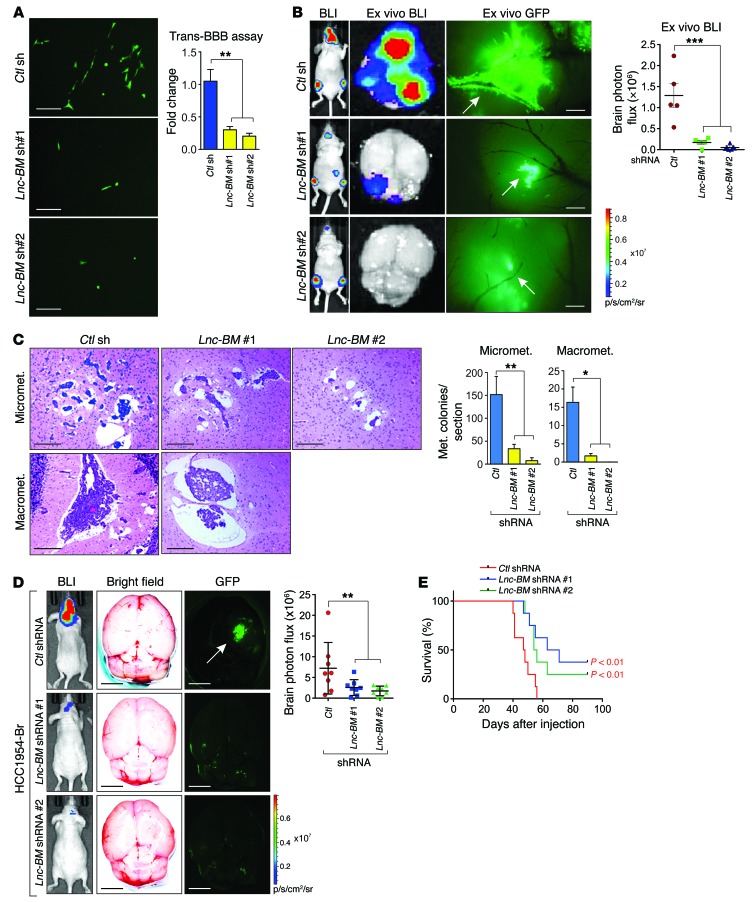
Experimental brain metastatic xenograft models via intracardiac or intra-arterial injections are the most established animal models to study brain metastasis (9). Breast cancer cell extravasation was repressed upon Lnc-BM knockdown, but not its cell proliferation (Figure 2A and Supplemental Figure 2, A and B). Four weeks after intracardiac injection, mice in the control group developed pervasive brain metastasis as detected by in vivo/ex vivo bioluminescence imaging and MRI (Figure 2B and Supplemental Figure 2C). Lnc-BM knockdown decreased the number and size of brain metastatic lesions (Figure 2B) but did not affect metastatic lesions in other areas (Supplemental Figure 2, D and E). Ex vivo GFP revealed that extravasated 231-Br cells bound to and spread along the surface of brain capillaries in the control group and that outgrowth occurred mainly on co-opted vessels, which were abolished by Lnc-BM depletion (Figure 2B, middle panel). Lnc-BM knockdown diminished micrometastases and macrometastases and increased cleaved caspase-3 in mouse brain tissues (Figure 2C and Supplemental Figure 2, F–I).
Figure 2. Lnc-BM is required and sufficient to promote BCBM.
(A) In vitro BBB transmigration activity of the 231-Br cells harboring control or Lnc-BM shRNAs. The number of transmigrated cells relative to the control cells is plotted (n = 3 independent experiments, unpaired Student’s t test). Scale bars: 100 μm. (B) Bioluminescence imaging (BLI) (n = 5 animals) of mouse, 4 weeks after intracardiac injection of 231-Br cells harboring indicated shRNAs (1-way ANOVA). Scale bars: 200 μm. White arrows: brain blood vessels. (C) Representative images and statistical analysis of H&E staining of mouse brain tumor burden at 35 days after intracardiac injection of 231-Br cells harboring indicated shRNAs (1-way ANOVA). Scale bars: 200 μm. n = 5 animals per group, 3 sections per brain. Micromet., micrometastatic lesions; Macromet., macrometastatic lesions. (D) Representative images of BLI (n = 8 animals), brain ex vivo bright field and ex vivo GFP, and statistical analysis of brain area photo flux (right panel) 5 weeks after intraarterial injection of HCC1954-Br cells stably expressing indicated shRNAs (1-way ANOVA). White arrow: brain metastatic lesions. Scale bars: 3 mm. (E) Kaplan-Meier plot of survival in the experiment of D (n = 8 animals per group, log rank test). Data are mean ± SEM, *P < 0.05, **P < 0.01, ***P < 0.001.
231-Par cells exhibited low brain metastasis potential after intracardiac injection; stable overexpression of Lnc-BM in these cells showed increased brain metastasis, but metastatic burden in other areas was not affected (Supplemental Figure 3, A–E). Ex vivo GFP indicated that the majority of 231-Par cells were congested in the vascular lumen but cells with overexpression of Lnc-BM penetrated through the BBB and formed metastatic lesions (Supplemental Figure 3C, middle panel). High Lnc-BM expression resulted in reduced cleaved caspase-3 staining and increased micrometastases/macrometastases in mouse brain tissues (Supplemental Figure 3, F–J).
To strengthen the linkage of Lnc-BM in brain metastasis, we used intra-arterial inoculation of 231-Br cells with or without Lnc-BM sgRNAs, finding that Lnc-BM depletion significantly impaired the development of brain metastasis lesions (Supplemental Figure 4, A and B). The median survival time (MST) of brain metastasis–bearing mice was significantly extended upon depletion of Lnc-BM (Supplemental Figure 4C). Among two HER2-positive breast cancer cell lines, HCC1954 parental (HCC1954-Par) and brain-seeking (HCC1954-Br) cells, elevated expression of Lnc-BM was detected in HCC1954-Br cells, in which Lnc-BM was stably knocked down by 2 independent shRNAs (Supplemental Figure 4D). Cells with Lnc-BM knockdown showed decreased cell extravasation (Supplemental Figure 4E). Brain metastatic lesions after intra-arterial injection of HCC1954-Br cells were reduced upon Lnc-BM knockdown (Figure 2D). The MST of brain metastasis–bearing mice was extended from 48 to 67 and 70 days, when Lnc-BM was depleted by 2 shRNAs, respectively (Figure 2E). Taken together, our data suggest the importance of Lnc-BM in promoting BCBM.
Chitosan nanoparticle–coated Lnc-BM siRNA suppresses BCBM in vivo.
The impermeability of the BBB complicates drug transport to the brain by limiting the delivery of many currently available therapeutic agents to the brain metastatic lesions (6). Previous research works have indicated that chitosan nanoparticles (NPs) can efficiently transport BBB-impermeable siRNAs to the brain (20), which may be valuable in targeting BCBM. We first confirmed the in vivo efficacy of siRNA delivery into the brain by NPs (Supplemental Figure 4G).
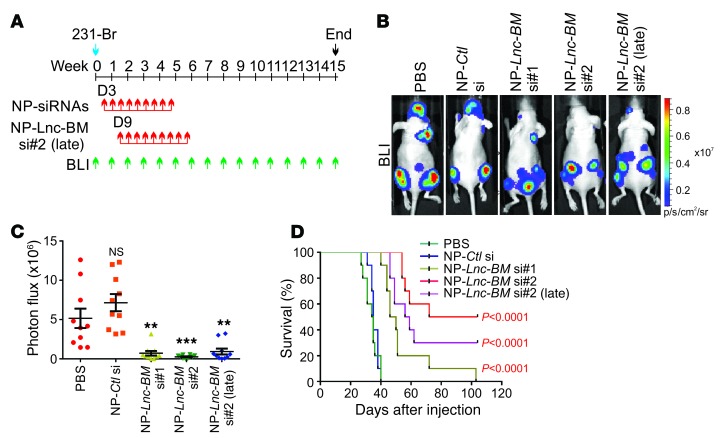
Then, NP-conjugated control siRNAs or siRNAs targeting Lnc-BM were delivered to brain metastasis–bearing mice (Figure 3A). NP-siRNA treatment (150 μg/kg) began on day 3 (early treatment) or day 9 (late treatment) (21) after tumor cell injection via the tail vein and continued 2 times per week until 9 doses had been given (Figure 3A). The knockdown efficiency of NP-siRNAs was confirmed by RNAscope staining of brain metastatic mouse tissues (Supplemental Figure 4, H and I). By week 4, NP-Lnc-BM siRNAs had significantly reduced brain metastatic burden compared with the control siRNA or PBS (Figure 3, B and C); however, metastatic lesions of other regions were not affected (Supplemental Figure 4, J–L). The MST of brain metastasis–bearing mice treated with PBS or the control siRNA was about 35 days. On the contrary, treatment with NP-siRNAs targeting Lnc-BM significantly prolonged the survival time of these mice [MST = 46, 72, and 56 days for si#1, si#2, and si#2 (late), respectively] (Figure 3D). Moreover, application of NP-siRNAs did not induce detectable toxicity to organs we examined (Supplemental Figure 4M). These results demonstrate that NP-delivered Lnc-BM siRNAs efficiently depleted Lnc-BM in vivo and suppressed BCBM in the preclinical model.
Figure 3. Inhibition of Lnc-BM represses BCBM.
(A) Flowchart of the experiments. (B and C) Representative BLI images (B) and quantification of BLI in the head region (C) of mice 4 weeks after intracardiac injection of 231-Br cells followed by i.v. administration of indicated nanoparticle-siRNAs (NP-siRNAs) (n = 10 animals, 1-way ANOVA). (D) Kaplan-Meier plot of survival in the experiment of B (n = 10 animals, log rank test). Data are mean ± SEM, **P < 0.01, ***P < 0.001.
Lnc-BM–dependent brain metastatic cancer cell vascular co-option impedes Fas ligand–induced apoptosis.
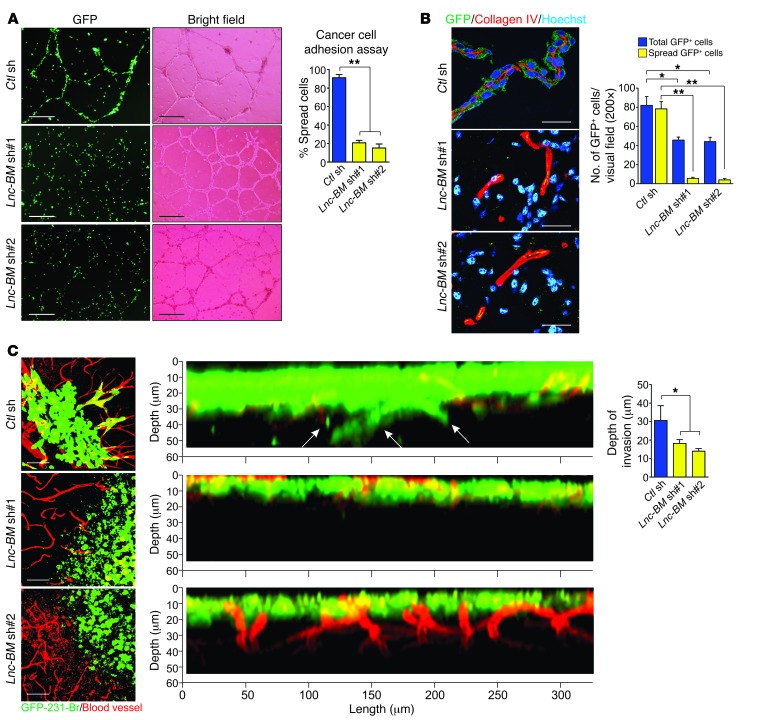
We examined the attachment of cancer cells to endothelial cells of blood vessels using a cancer cell adhesion assay. The primary cultured endothelial cells (HUVECs) formed tube structures when cultured on Matrigel, which mimics blood vessel features. Lnc-BM depletion significantly reduced this attachment (Figure 4A). In brain metastatic mouse tissues, GFP-labeled 231-Br cells spread on the abluminal surface of brain capillaries and formed a sheath around the vessels, whereas Lnc-BM–knockdown cells were round and failed to co-opt with vessels (Figure 4B).
Figure 4. Lnc-BM is required for brain metastatic cancer cell vascular co-option.
(A) 231-Br cells harboring indicated shRNAs were subjected to cancer cell adhesion assay. The number of cancer cells attached and spread along HUVECs relative to total cancer cells was plotted (n = 3 independent experiments, unpaired Student’s t test). Scale bars: 200 μm. (B) Immunofluorescence (IF) with indicated antibodies in brain metastasis–bearing mice 35 days after intracardiac injection of 231-Br cells harboring indicated shRNAs (n = 3 independent experiments, paired Student’s t test). Scale bars: 50 μm. (C) Representative confocal images of cancer cell vascular co-option and quantification of infiltrated depth (right panel) of brain slices cocultured with 231-Br cells harboring indicated shRNAs (n = 3 independent experiments, unpaired Student’s t test) . Scale bars: 50 μm. White arrows: infiltrated cells. Data are mean ± SEM, *P < 0.05, **P < 0.01.
To examine the role of Lnc-BM in promoting cancer cell vascular co-option in the brain parenchyma, mouse brain slices were cocultured with 231-Br cells. 231-Br cells harboring control shRNAs adhered to the capillaries and stretched over their surfaces (Figure 4C, left panel), followed by infiltration into mouse brain tissues (Figure 4C, middle and right panels). In contrast, Lnc-BM–deficient cells could not adhere to vessels or invade into brain tissues.
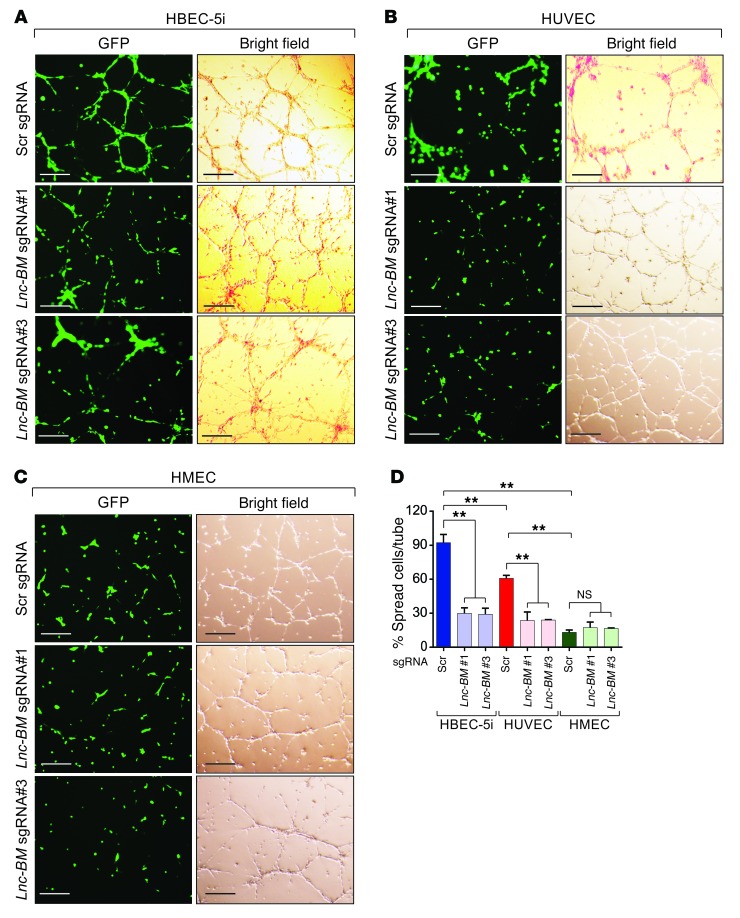
We hypothesized that brain-seeking cancer cells may be recruited to brain endothelium, mediated by Lnc-BM. To address this hypothesis, we cocultured 231-Br cells with human brain (cerebral) endothelial cells (HBECs), human (dermal) microvascular endothelial cells (HMECs), and human umbilical vein endothelial cells (HUVECs) (Figure 5, A–D). 231-Br cells showed the strongest recruitment to HBECs (Figure 5, A–D). Upon application of Lnc-BM sgRNAs, the association between cancer cells and endothelial cell tubes was significantly reduced when cancer cells were cocultured with HBECs and HUVECs (Figure 5D). Our data suggest that 231-Br cells exhibit the highest binding affinity for brain endothelium compared with endothelial cells from other organs, in an Lnc-BM–dependent manner.
Figure 5. Lnc-BM promotes cancer cell adhesion to brain endothelium.
Representative images (A–C) and statistical analysis (D) of cancer cell adhesion assay of 231-Br cells harboring indicated sgRNAs cocultured with HBECs (A), HUVECs (B), or HMECs (C). Scr, scramble. Scale bars: 200 μm. Data are mean ± SEM, n = 3 independent experiments. NS, P > 0.05; **P < 0.01; 1-way ANOVA.
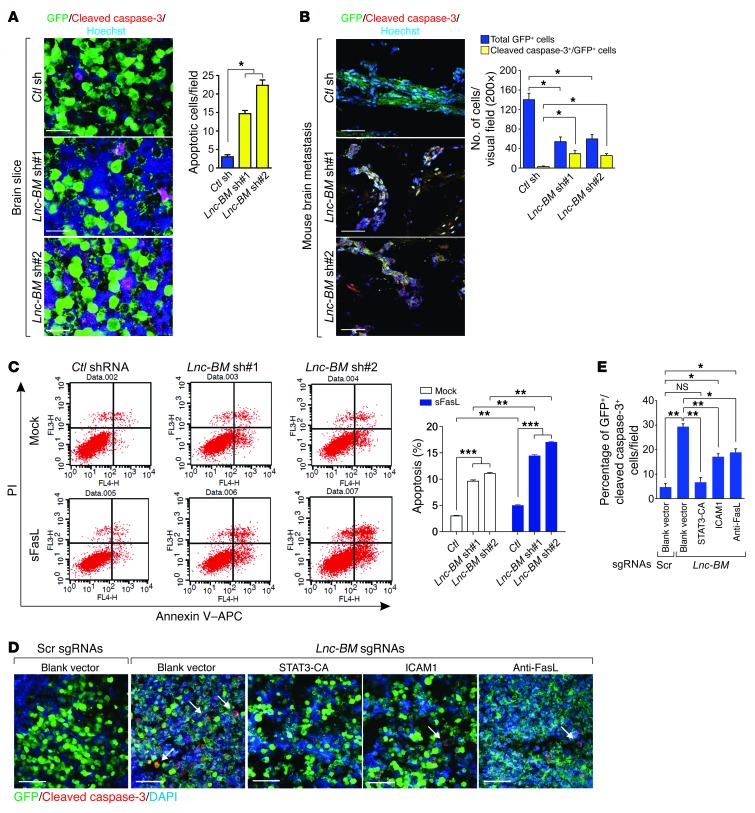
Activated astrocytes secrete soluble Fas ligand (sFasL), leading to apoptosis of brain metastatic cancer cells via Fas-mediated apoptosis; the process is attenuated by cancer cell vascular co-option (9). Lnc-BM knockdown cells underwent increased apoptosis compared with control cells (Figure 6, A and B). Lnc-BM knockdown facilitated FasL-induced apoptosis (Figure 6C). Using a brain slice culture, we found that overexpression of ICAM1 (described later) or of constitutively active STAT3 (STAT3-CA) (22), or the use of neutralizing FasL antibody, partially rescued cell apoptosis upon Lnc-BM depletion (Figure 6, D and E). FLICE inhibitor protein (FLIP, also known as CASP8 and FADD-like apoptosis regulator [CFLAR]) and B cell lymphoma 2 (Bcl2) are induced by STAT3 (23). We then determined the expression of FLIP and Bcl2 in Lnc-BM–knockdown cells and found that Lnc-BM depletion downregulates the expression of both FLIP and Bcl2 with or without FasL (Supplemental Figure 5). These data suggest that Lnc-BM is important for promoting vascular co-option and antagonizing FasL-dependent and independent apoptosis pathways in brain metastatic cells.
Figure 6. Lnc-BM impedes cancer cells from FasL-induced apoptosis.
(A and B) IF staining of cleaved caspase-3 in brain slices cocultured with 231-Br cells harboring indicated shRNAs (A) or in brain metastatic lesions (B, related to Figure 2C). Left panels: Representative images. Right panel: Statistical analysis (n = 3 independent experiments, unpaired Student’s t test). Scale bars: 100 μm. (C) FACS analyses of 231-Br cells transfected with indicated shRNAs followed by sFasL (200 ng/ml) treatment for 24 hours (n = 3 independent experiments, unpaired Student’s t test). (D and E) IF staining of cleaved caspase-3 in brain slices cocultured with 231-Br cells harboring scramble or Lnc-BM sgRNAs, followed by transfection of indicated expression constructs. (D) Representative images. (E) Statistical analysis (n = 3 independent experiments, unpaired Student’s t test). White arrows: apoptotic cells. Scale bars: 200 μm. Data are mean ± SEM; NS, P > 0.05; *P < 0.05, **P < 0.01, ***P < 0.001.
Lnc-BM mediates JAK2/STAT3 signaling that is triggered by OSM.
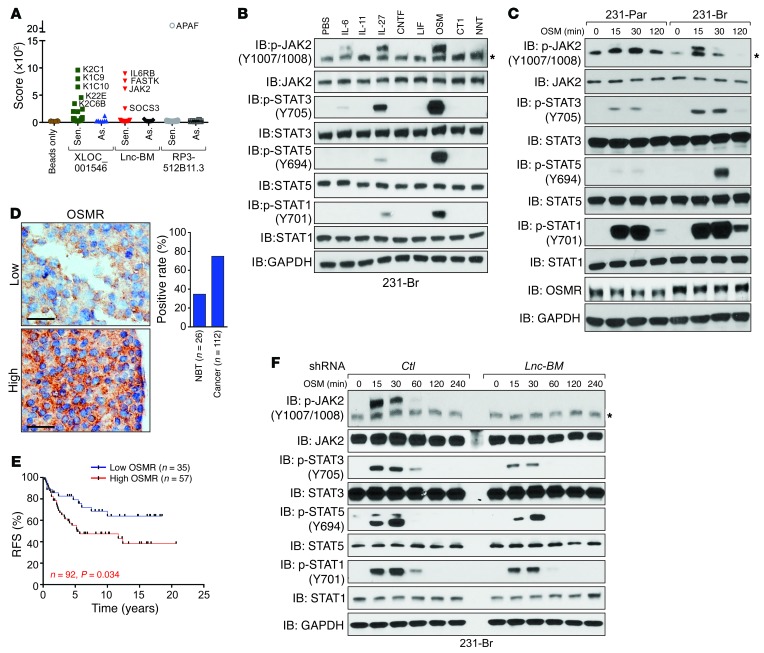
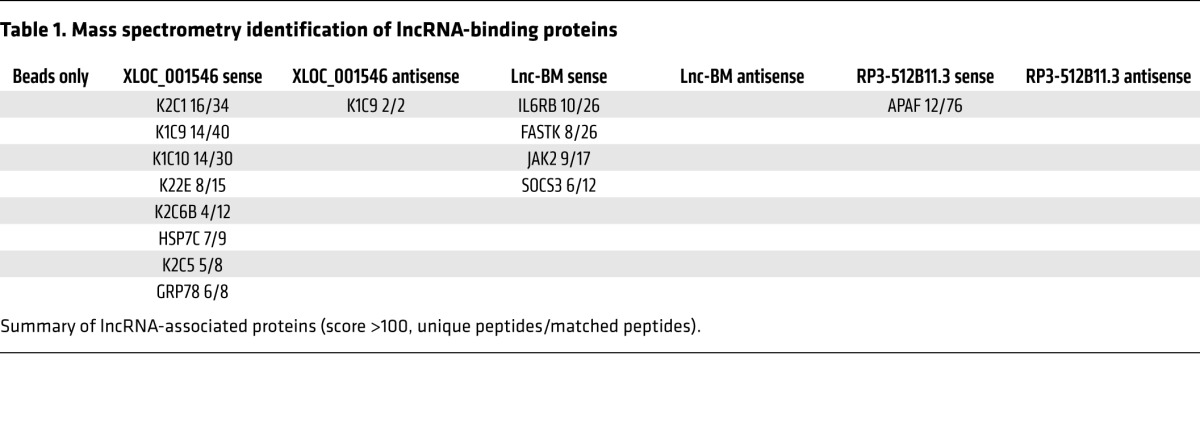
Using mass spectrometry, sense and antisense transcripts of the top 3 lncRNA candidates, XLOC_001546, Lnc-BM, and RP3-512B11.3, were subjected to lncRNA pull-down (ref. 12 and Figure 7A). Of these, only the sense Lnc-BM transcript associates with IL-6 receptor subunit β (IL6ST, IL6R-β, also known as gp130), JAK2, and suppressor of cytokine signaling 3 (SOCS3) (Figure 7A; Table 1; Supplemental Figure 6, A and B; and Supplemental Table 2).
Figure 7. Lnc-BM–mediated signaling pathway triggered by OSM is required for BCBM.
(A) Summary of protein identification score revealed by lncRNA pull-down followed by mass spectrometry analysis using sense (Sen.) or antisense (As.) transcripts of indicated lncRNAs. (B and C) IB detection using indicated antibodies in 231-Br cells treated with the indicated cytokines for 30 minutes (B) or in 231-Br and 231-Par cells treated with OSM (50 ng/ml) for the indicated times. *Unspecific band. (D) IHC staining of OSMR in human breast cancer (n = 112 tissues) and adjacent normal tissues (NBT; n = 26 tissues). Scale bars: 100 μm. (E) Kaplan-Meier RFS analysis of OSMR expression in breast cancer patients detected by IHC (n = 35 and 57 tissues, respectively, log rank test). (F) IB detection using indicated antibodies in 231-Br cells harboring indicated shRNAs treated with OSM for the indicated times. *Unspecific band.
Table 1. Mass spectrometry identification of lncRNA-binding proteins.
Homodimerization or heterodimerization between IL6ST and other cytokine receptors triggers phosphorylation of JAK2 and of STATs upon ligand binding (24). We screened 8 known IL6ST-associated cytokines (25) and found that OSM was the most potent ligand that triggered phosphorylation of JAK2 and of STATs in 231-Br cells (Figure 7B). Knockdown of either IL6ST or OSMR abolished OSM-induced JAK2 phosphorylation and the activation of JAK2 downstream targets (Supplemental Figure 6C). 231-Br cells exhibited higher OSMR protein levels and stronger phosphorylation of JAK2/STATs upon OSM treatment than parental cells (Figure 7C and Supplemental Figure 6, D and E). Furthermore, elevated OSMR expression was observed in breast cancer tissues compared with adjacent normal tissues; and those with unfavorable outcomes (Figure 7, D and E).
Lnc-BM knockdown substantially reduced OSM-induced phosphorylation of JAK2 and STATs (Figure 7F). Overexpression of Lnc-BM in 231-Par cells enhanced OSM-induced JAK2/STAT activation (Supplemental Figure 6F). These data were validated in Lnc-BM–low MCF7 and Lnc-BM–high BT474 cells (Supplemental Figure 6, G–J). In brain metastatic tissues from the in vivo model, phospho-JAK2 (p-JAK2) and p-STAT3 staining were decreased in the Lnc-BM–knockdown group but increased in the Lnc-BM overexpression group in comparison with the respective control groups (Supplemental Figure 2, F–H, and Supplemental Figure 3, G–I). Further, Lnc-BM knockdown did not affect interaction between JAK2 and OSMR or IL6ST (Supplemental Figure 6K), suggesting that Lnc-BM regulates JAK2/STAT signaling through modulation of JAK2 kinase activity.
JAK2 is required for Lnc-BM–mediated BCBM.
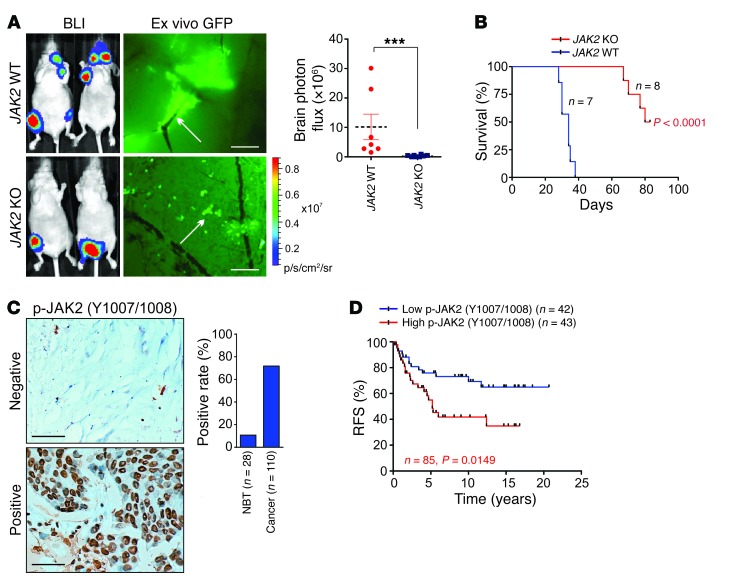
We used CRISPR/Cas9–mediated gene editing to knock out JAK2 in 231-Br cells (Supplemental Figure 7, A and B). JAK2-KO cells failed to associate with blood capillaries and exhibited reduced mobility (Supplemental Figure 7, C and D). JAK2 depletion inhibited development of metastatic lesions in mouse brains (Figure 8A and Supplemental Figure 7E), but bone metastatic burden was not affected (Supplemental Figure 7F). Moreover, MSTs of brain metastasis–bearing mice with JAK2-KO cells were approximately double those of mice with JAK2 WT cells (Figure 8B), suggesting that JAK2 is required for BCBM.
Figure 8. JAK2 is required for BCBM.
(A) BLI image (n = 7 and 8 animals) of mice 4 weeks after intracardiac injection of indicated cells. Left panel: Representative images. Right panel: Statistical analysis (1-way ANOVA). Scale bars: 200 μm. White arrows: mouse brain blood vessel. (B) Kaplan-Meier plot of brain-metastasis-free survival in the experiment of (A) (n = 7 and 8 animals, respectively, log rank test). (C) IHC staining of p-JAK2 in human breast cancer (n = 110 tissues) and adjacent normal tissues (NBT) (n = 28 tissues). Scale bars: 100 μm. (D) Kaplan-Meier RFS analysis of p-JAK2 in breast cancer patients detected by IHC (n = 42 and 43 tissues, respectively, log rank test). Data are mean ± SEM, ***P < 0.001.
Next, we evaluated p-JAK2 levels in human breast cancer, finding elevated levels in breast cancer tissues (Figure 8C), which were significantly correlated with shorter recurrence times for breast cancer patients (Figure 8D). Breast cancer patients with high Lnc-BM expression exhibited increased JAK2 phosphorylation status and vice versa (Supplemental Figure 7G), further confirming that Lnc-BM promotes BCBM by activating JAK2.
Lnc-BM modulates the kinase activity of JAK2.
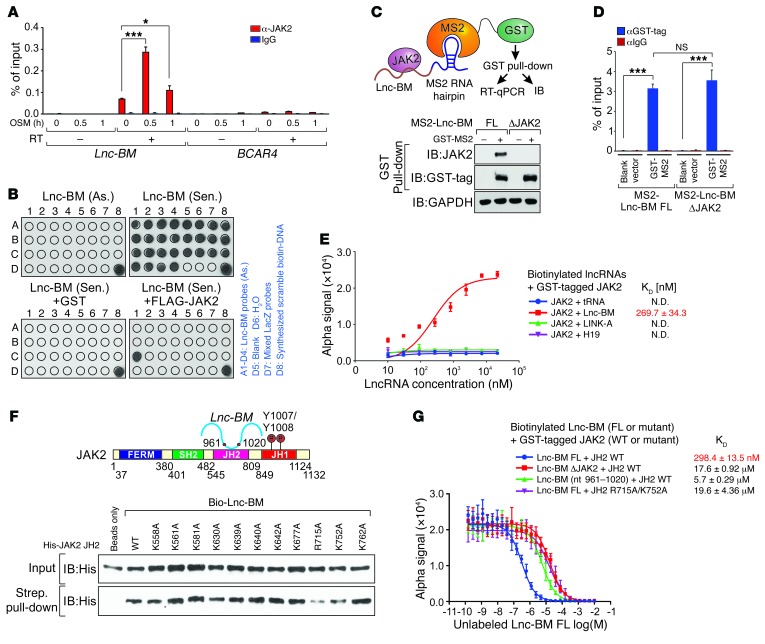
Lnc-BM directly interacted with JAK2, but not with IL6ST or SOCS3 (Supplemental Figure 8A). In 231-Br cells, JAK2 specifically interacted with Lnc-BM upon OSM stimulation, but not with BCAR4 (12), LINK-A (26), or other lncRNAs upregulated in brain metastatic cells (Figure 9A and Supplemental Figure 8B). Domain mapping studies indicated that the JH2 domain (aa 545–809) mediated Lnc-BM–JAK2 interaction (Supplemental Figure 8, C and D). We also identified the sequence of Lnc-BM (nt 961–1,020) that was responsible for JAK2 binding (Figure 9B). Deletion of this binding motif (referred to as Lnc-BM ΔJAK2) failed to associate with JAK2 (Supplemental Figure 8, E and F).
Figure 9. Lnc-BM associates with JAK2 in vitro and in vivo.
(A) RIP-qPCR detection of the indicated RNAs retrieved using indicated antibodies in 231-Br cells with OSM treatment for the indicated times (n = 3 independent experiments, paired Student’s t test). (B) In vitro RNA pull-down coupled with dot-blot assay using indicated RNA transcripts and recombinant proteins. Right panel: Annotation for each dot. (C and D) Graphic illustration of MS2-TRAP assay (C, top panel). IB (C, bottom panel) and RT-qPCR detection of MS2-Lnc-BM (D) of anti-GST immunoprecipitates in cells transfected with indicated expression constructs, followed by OSM stimulation (n = 3 independent experiments, paired Student’s t test). (E) Saturation curve KD determination of interaction between indicated lncRNAs and recombinant GST-tagged JAK2 (n = 3 independent experiments). (F) Top panel: Graphic illustration of Lnc-BM–JAK2 interaction. Bottom panel: IB detection of streptavidin pull-down using His-tagged JH2 WT/mutants and biotinylated Lnc-BM. (G) Competition binding assay KD determination of interaction between Lnc-BM FL/mutants and recombinant JH2 WT/mutants, with unlabeled Lnc-BM titrated from 10 μM to 0.1 nM (n = 3 independent experiments). Data are mean ± SEM; NS, P > 0.05; *P < 0.05, ***P < 0.001.
MS2-tagged RNA affinity purification (MS2-TRAP) (27, 28) expresses MS2 RNA hairpin (bacteriophage RNA hairpin)–tagged, full-length (FL) Lnc-BM or ΔJAK2 deletion mutant in Lnc-BM depletion cells in the presence of OSM (Figure 9C). In the presence of the MS2 binding protein (GST-MS2), the MS2-tagged Lnc-BM (WT or mutant) was bound by GST-MS2, and the RNA-protein complex was pulled down by glutathione agarose (Figure 9C). Our data indicate that similar amounts of MS2-Lnc-BM (FL or ΔJAK2 mutant) were retrieved by GST pull-down (Figure 9D). Lnc-BM-FL, but not the ΔJAK2 deletion mutant, associated with endogenous JAK2 (Figure 9C). Alpha assays were used to quantitatively assess the interaction between Lnc-BM and JAK2, using biotinylated Lnc-BM and GST-tagged JAK2 (JH2/JH1 domains) as the donor and acceptor pair. 269.7 nM of Lnc-BM reaches 50% maximal binding with JAK2, but not other lncRNAs that are highly expressed in breast cancer, including H19 (29) and LINK-A (ref. 26 and Figure 9E). Prediction of the secondary structure of Lnc-BM suggests that the 60-mer RNA fragment (nt 961–1,020) of Lnc-BM forms 3 stem-loop structures (Supplemental Figure 8G). The 3 stem loops were deleted individually, and we found that all 3 fragments contribute to the Lnc-BM–JH2 interaction (Supplemental Figure 8H).
Computational calculations using Bindup (30) indicate that the JH2 domain harbors a large patch of positive regions that may be involved in protein-RNA binding (Supplemental Figure 8I). The predicted binding site was confirmed by RBRpred (31). We individually mutated 11 positively charged amino acids to alanine and found that R715 and K752 were important for mediating Lnc-BM–JH2 interaction (Figure 9F and Supplemental Figure 8J). The RNA immunoprecipitation (RIP) assay (32) indicated that expression of FLAG-tagged JAK2 WT, but not R715A/K752A double mutant in JAK2-KO cells, associated with Lnc-BM upon OSM stimulation (Supplemental Figure 8K).
Using an alpha assay, we measured the binding affinity of Lnc-BM and the JH2 domain with mutants. Lnc-BM shows a KD value of 298.4 nM in interacting with His-tagged JH2 domain, which was significantly impaired by Lnc-BM ΔJAK2 or JH2 R715A/K752A mutant (Figure 9G). The RNA oligonucleotide representing Lnc-BM nt 961–1,020 exhibited insignificant association with the JH2 domain (Figure 9G), suggesting the importance of the 3D structure of RNA in RNA-protein binding.
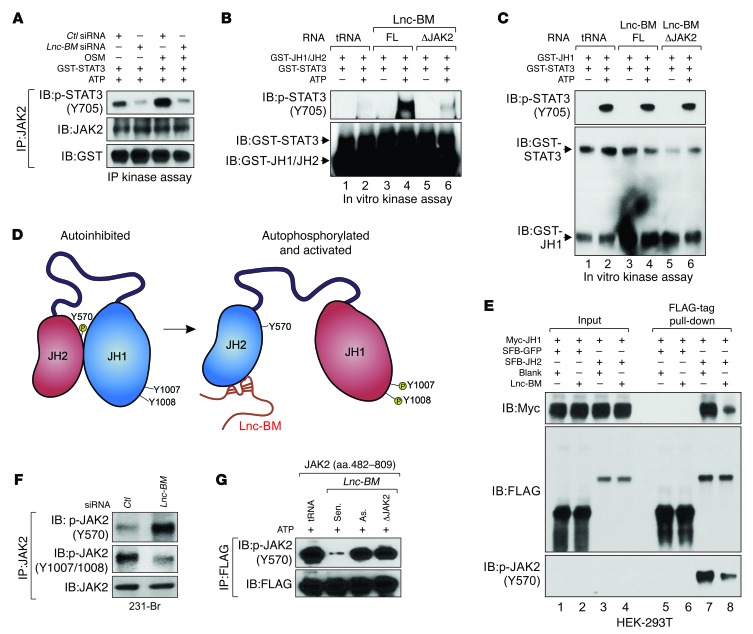
The kinase domain of JAK2 (JH1 domain) is self-inhibited by interaction between JH2 and JH1 domains (33). Lnc-BM knockdown abolished the kinase activity of immunoprecipitated JAK2 both with and without OSM stimulation (Figure 10A). Kinase assays using recombinant JH1/JH2 domains or JH1 domain indicated that the JH1 domain exhibited potent kinase activity, which was not affected by Lnc-BM; however, the kinase activity of the JH1/JH2 domains were enhanced in the presence of Lnc-BM-FL but not the ΔJAK2 mutant transcript (Figure 10, B and C). We reasoned that Lnc-BM binding with the JH2 domain may interfere with the JH2-JH1 domain interaction, leading to activation of JH1 tyrosine kinase activity (Figure 10D). To confirm this hypothesis, we coexpressed Myc-tagged JH1, SFB/FLAG-tagged JH2, and Lnc-BM in 293T cells and found that the interaction between exogenous Myc-JH1 and FLAG-JH2 was impaired in the presence of Lnc-BM-FL (Figure 10E, lane 8).
Figure 10. Lnc-BM modulates kinase activity of JAK2.
(A) Kinase assay using anti-JAK2 immunoprecipitates retrieved from 231-Br cells transfected with indicated siRNAs followed by OSM treatment. (B and C) In vitro kinase assay using recombinant JAK2 JH1/JH2 domain (B) or JAK2 JH1 domain (C), GST-STAT3, and indicated RNA transcripts in the presence and absence of ATP. (D) Graphic illustration of Lnc-BM–mediated JAK2 JH1/JH2 domain conformational alteration from autoinhibition to activation. (E) FLAG-tag pull-down followed by IB detection using antibodies in HEK-293T cells transfected with indicated vectors. (F) Anti-JAK2 immunoprecipitates were detected using indicated antibodies in 231-Br cells transfected with indicated siRNA. (G) Kinase assay using anti-FLAG immunoprecipitates in γ-2A cells transfected with SFB-JAK2 (aa 482–809), in the presence of indicated RNA transcripts and ATP.
JH2-dependent phosphorylation at Tyr570 mediates JH2-JH1 interaction and subsequent inhibition of JAK2 kinase activity (ref. 34 and Figure 10D). Lnc-BM overexpression significantly reduced Tyr570 phosphorylation (Figure 10E). Lnc-BM knockdown resulted in increased Tyr570 phosphorylation but suppressed JAK2 Tyr1007/1008 phosphorylation in 231-Br cells (Figure 10F). Moreover, Lnc-BM-FL sense transcript, but neither the antisense transcript nor Lnc-BM ΔJAK2, abolished phosphorylation of Tyr570 (Figure 10G). These data suggest that Lnc-BM may facilitate a potential conformational change in JAK2 from a “closed” (autoinhibited) to an “open” (activated) configuration. Lnc-BM binding to the JH2 domain inhibits JH2 kinase activity (indicated in blue), which leads to hypophosphorylation of Tyr570. These events result in a more accessible structure and enzymatic activation of the JH1 domain (indicated in red) (Figure 10D), which is essential for activation of downstream signaling cascades.
Mutations of JAK2 negative regulatory sites (Ser523 and Tyr570), JH2 domain kinase-inactivating mutant (K581A), and a natural mutant (V617F) led to constitutive activation of the JAK2 kinase by disrupting the interaction between the JAK2 JH1 and JH2 domains (34). Expression of these JAK2 mutants in JAK2-null γ-2A cells led to enhanced binding between Lnc-BM and the JH2 domain (Supplemental Figure 9A), suggesting that the potential “open” conformation of JAK2 is more accessible to Lnc-BM binding.
Next, we examined whether the Lnc-BM–JAK2 interaction and activation of STATs affected Lnc-BM expression. The half-life of Lnc-BM was significantly reduced upon treatment with a JAK2 inhibitor (TG101348) as well as in JAK2-KO cells (Supplemental Figure 9, B and C). siRNAs against STAT1, STAT3, or STAT5 did not affect Lnc-BM expression (Supplemental Figure 9, D and E), which suggests that the high levels of Lnc-BM expression found in brain metastatic cells are due to stabilization as opposed to transcriptional regulation.
Functional rescue experiments indicated that Lnc-BM knockdown impaired OSM-triggered, JAK2-dependent STAT3 phosphorylation (Supplemental Figure 9F). Lnc-BM-FL rescued OSM-induced phosphorylation of JAK2 and STAT3 and cell migration through the BBB, but not the Lnc-BM ΔJAK2 mutant (Supplemental Figure 9, G–J). In JAK2-depleted cells, expression of exogenous WT JAK2, but not the R715A/K752A mutant, restored OSM-induced STAT3 phosphorylation and cell mobility (Supplemental Figure 9, K and L). These data suggest that Lnc-BM–JAK2 interaction is critical for sustained STAT3 signaling activation and is important in brain metastasis.
ICAM1 supports vascular co-option and invasion of breast cancer cells.
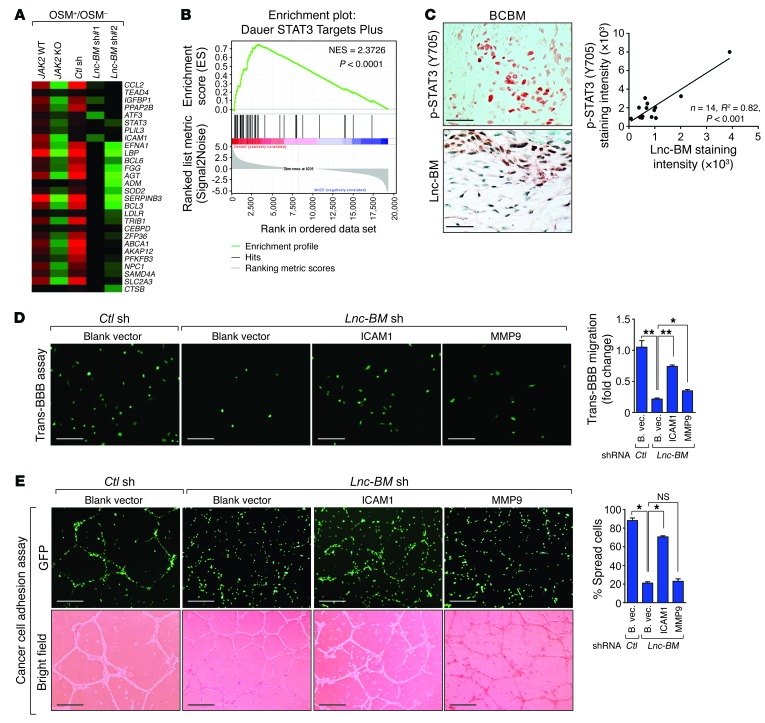
JAK2 triggers activation of 3 downstream signaling pathways, AKT, MAPK, and STAT1/3/5 (35). We profiled gene expression in cells with Lnc-BM depletion or JAK2 KO following OSM stimulation. Gene Set Enrichment Analysis (GSEA) and Gene Ontology analysis and quantitative reverse transcriptase PCR (RT-qPCR) indicated that 231-Br cells showed enrichment of STAT3 signature genes (36) upon OSM treatment, which was abolished in cells deficient in Lnc-BM or JAK2 (Figure 11, A and B, and Supplemental Figure 10, A and B; GEO GSE79534). In human brain metastatic breast cancer tissues, Lnc-BM expression was correlated with p-STAT3 status (Figure 11C). Using brain slice cultures, Lnc-BM–deficient 231-Br cells infected with STAT3-CA achieved restoration of the cancer cell vascular co-option and enhanced invasion of cancer cells into brain tissues (Supplemental Figure 10C).
Figure 11. ICAM1 facilitates breast cancer cell vascular co-option and invasion.
(A) Heatmap representation of the expression of STAT3 target genes in indicated cells treated with 50 ng/ml OSM or vehicle for 4 hours. The colors represent the fold changes of gene expression induced by OSM over vehicle. (B) GSEA of STAT3 target gene signature in A. NES, normalized enrichment score. (C) Top panel: Representative images of p-STAT3 and Lnc-BM staining in brain metastatic tissues of breast cancers. Bottom panel: Pearson’s correlation analysis (n = 14 tissues). Scale bars: 100 μm. (D and E) Trans-BBB assay (D) or cancer cell adhesion assay (E) was performed in Lnc-BM–deficient 231-Br cells stably overexpressing ICAM1 and MMP9 (n = 3 independent experiments, paired Student’s t test). B. vec., blank vector. Scale bars: 100 μm (D), 200 μm (E). Data are mean ± SEM; NS, P > 0.05; *P < 0.05, **P < 0.01.
We screened the expression of 84 molecules related to human extracellular matrix and adhesion, of which 5 were downregulated (>4-fold) in cells upon Lnc-BM knockdown (Supplemental Figure 10D). ICAM1 is coregulated by Lnc-BM and STAT3 (Supplemental Figure 10E). Stable expression of exogenous ICAM1, but not MMP9, rescued cancer cell adhesion to blood vessels, although both exogenous ICAM1 and MMP9 partially rescued Lnc-BM–dependent cell invasion (Figure 11, D and E, and Supplemental Figure 10, F and G). Consistently, restoration of ICAM1 expression in Lnc-BM–depleted cells allowed cancer cells to recover their ability to stretch over blood vessels and penetrate into the brain slices (Supplemental Figure 10H). These data suggest that the STAT3 target gene ICAM1 plays a key role in mediating Lnc-BM–dependent breast cancer vascular co-option and invasion.
Macrophage-secreted OSM and IL-6 induce JAK2/STAT3 signaling in brain metastatic cancer cells.
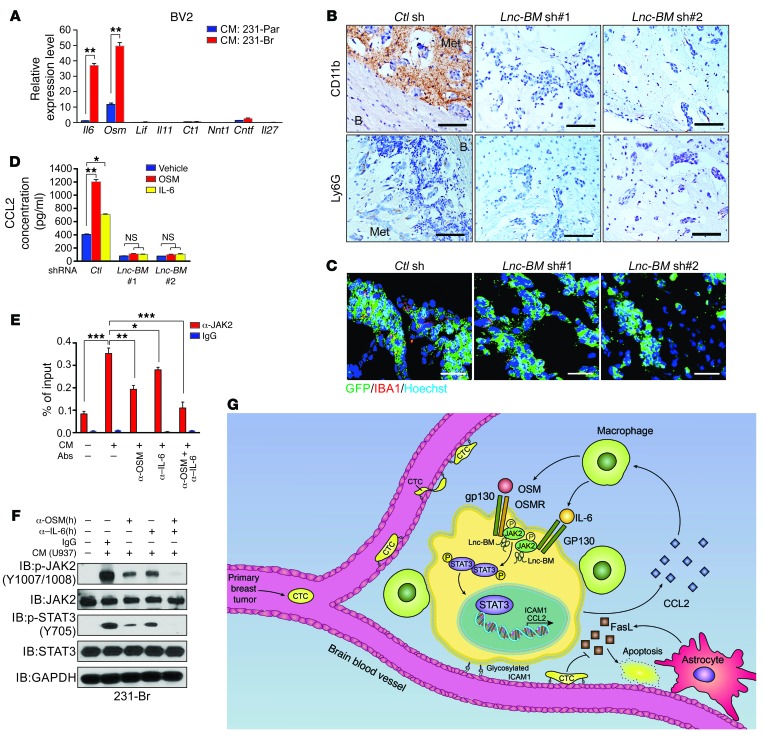
To determine the source of OSM, we measured the expression of IL6ST-associated cytokines in 231-Par, 231-Br, and BBB-constructing cells (8), finding that none of these cells produced undetectable OSM (Supplemental Figure 11, A–C). Recent evidence has demonstrated that brain-resident macrophages promote the outgrowth of metastatic cells (10). Therefore, we examined mouse brain-resident macrophages (BV2 cells), finding higher OSM expression in these cells than in other mouse cell lines (Supplemental Figure 11, D and E). Interestingly, conditioned media from 231-Br cells induced expression of IL-6 and OSM in BV2 cells and human macrophages differentiated from PMA-primed human monocytes (U937 cells) (Figure 12A and Supplemental Figure 11F).
Figure 12. Lnc-BM promotes recruitment of macrophages into the metastatic niche to form positive-feedback loop.
(A) RT-qPCR analysis of IL6ST-associated cytokine expression in BV2 cells incubated with conditioned media from indicated cells (n = 3 independent experiments, paired Student’s t test). (B and C) IHC detection of CD11b and Ly6G (B) or IF staining of IBA1 (C) in brain metastatic lesions of 231-Br cells harboring indicated shRNAs (related to Figure 2C; n = 5 animals per group, 3 sections per brain). B, brain tissue; Met, metastatic cancer cells. Scale bars: 200 μm (B), 100 μM (C). (D) ELISA detection of CCL2 concentration in conditioned media of 231-Br cells harboring indicated shRNAs treated with OSM (50 ng/ml) or IL-6 (50 ng/ml) for 12 hours (n = 3 independent experiments, paired Student’s t test). (E and F) RIP quantitative real-time PCR detection of Lnc-BM retrieved by indicated antibodies (E) or IB detection using indicated antibodies (F) in 231-Br cells treated with conditioned media from primed U937 cells in addition to indicated human antibodies (n = 3 independent experiments, paired Student’s t test; E). (G) Model of the action of Lnc-BM in mediating BCBM. Data are mean ± SEM; *P < 0.05, **P < 0.01, ***P < 0.001.
IHC staining of CD11b, a myeloid cell marker, and IBA1, a microglial and macrophage marker, showed recruitment of macrophages to brain metastatic lesions, which was markedly reduced upon Lnc-BM depletion (Figure 12, B and C).
We examined the expression of 84 human cytokines and chemokines and found that 7 of them were downregulated (>4-fold) in Lnc-BM–depleted cells, of which CCL2 was coregulated by Lnc-BM and STAT3 (Supplemental Figure 11, G and H). Lnc-BM or JAK2 deficiency significantly reduced macrophage recruitment in comparison with control cells (Supplemental Figure 11, I and J). CCL2 expression could be induced by OSM or IL-6, which was abolished by stable knockdown of Lnc-BM (Figure 11D). The rescue experiment indicated that introduction of 400 pg/ml of recombinant CCL2 to conditioned media restored macrophage recruitment (Supplemental Figure 11, K and L). Collectively, these data demonstrate that CCL2, which is produced by 231-Br cells, facilitates Lnc-BM–dependent macrophage recruitment in BCBM lesions.
Next, 231-Br cells were treated with conditioned media from PMA-primed macrophage-like U937 cells, which were preblocked by human OSM and/or IL-6 antibodies. Conditioned media from either primed U937 cells or BV2 cells potently induced phosphorylation of JAK2 and STAT3, as well as Lnc-BM–JAK2 interaction in 231-Br cells or mouse breast cancer 4T1 cells, which were abolished by combined treatment with OSM and IL-6 antibodies (Figure 12, E and F, and Supplemental Figure 11M). Collectively, our data suggest that brain metastatic cancer cells produced CCL2 to recruit macrophages, which in turn secreted OSM and IL-6 synergistically to activate Lnc-BM/JAK2/STAT3 signaling in cancer cells to promote BCBM.
Discussion
Development of effective preventative and therapeutic strategies for BCBM relies on a comprehensive understanding of the molecular mechanisms of the disease. Our findings demonstrate that the Lnc-BM/JAK2/STAT3/ICAM1 axis facilitates adhesion of breast cancer cells to brain capillaries and extravasation into the brain parenchyma. Furthermore, interaction between ICAM1, VCAM-1, and activated moesin and ezrin is required for leukocyte adhesion to the endothelium during inflammation (37), which may partly explain why BCBM cells adhere to brain blood vessels with high ICAM1 expression. Interestingly, Lnc-BM promoted brain metastatic cell secretion of CCL2, which recruits macrophages to the brain lesion. The recruited macrophages in turn increased local concentrations of OSM and IL-6, which enhanced activation of this signaling axis (Figure 12G). These phenomena suggest that Lnc-BM is important for mediating communication between breast cancer cells and the brain microenvironment.
JAK2 functions as a prototypical kinase that phosphorylates STAT3, which promotes tumorigenesis and progression in a wide range of tumor types (38). Our data indicate that JAK2/STAT3 signaling is hyperactivated in brain metastatic breast cancers and that depletion of JAK2 diminished brain metastasis in vivo, which suggest that JAK2 may be a promising therapeutic target for BCBM. JAK2 inhibitors, such as NVP-BSK805 or fedratinib, and STAT3 inhibitors may hinder the progression of BCBM. An unexpected finding was that Lnc-BM bound to and inhibited the kinase activity of the JAK2 JH2 domain. These events may result in a potential conformational change from a “closed” to an “open” structure for the JH2/JH1 domains, leading to hyperactivation of JAK2. This mechanism may partially explain the observation that human BCBM rarely harbors natural mutations in the JH2 domain (39), whereas JAK2 exhibits hyperphosphorylation in these tissues (40). Thus, lncRNA-dependent modulation of JAK2 kinase activity represents a novel mutation-independent mechanism that attenuates self-inhibition of JAK2 in solid tumors. Emerging evidence suggests the potential for lncRNAs to serve as therapeutic targets given that some of them are overexpressed in cancer and facilitate cancer progression (41). Chitosan NPs have been used for systemic in vivo siRNA delivery because of their low immunogenicity, low toxicity (42, 43), and brain permeability (20). Indeed, our data demonstrate that chitosan NP–coated Lnc-BM siRNAs inhibited brain metastases in vivo and prolonged the survival of cancer-bearing mice. Our studies show the importance of Lnc-BM in promoting BCBM and the therapeutic value of targeting Lnc-BM in fighting this difficult disease.
Methods
Cell culture, transfection, treatments, and lentiviral transduction.
MDA-MB-231, MCF7, HEK-293T, U937, NIH-3T3, 4T1, HBEC-5i, HUVEC, and HMEC cells obtained from ATCC were cultured under standard conditions. Parental BT474 (BT474-Par), MDA-MB-231 (231-Par), and HCC1954 (HCC1954-Par) and their brain metastatic derivatives (BT474-Br, 231-Br, and HCC1954-Br) were previously described (17). The lung and bone metastatic cell lines MDA-MB-231 LM2 and BoM-1833 were provided by Jianming Xu and Xiang Zhang (Baylor College of Medicine, Houston, Texas, USA), respectively. The γ-2A (JAK2-null) cell line was provided by George Stark (Cleveland Clinic, Cleveland, Ohio, USA). The BV2 cell line and the mouse astrocyte cell line were provided by Zhimin Lu and Isaiah J. Fidler (MD Anderson Cancer Center), respectively. siRNA and plasmid transfections were performed using DharmaFECT4 (GE Healthcare) and Lipofectamine 3000 (Invitrogen). Cells were serum-starved overnight followed by treatment with IL-6, IL-11, IL-27, CNTF, LIF, OSM, cardiotrophin-1 (CT1), and NNT-1 (PeproTech) at 50 ng/ml for 30 minutes or as indicated. Virus-containing supernatant was collected 48 hours after cotransfection of pCMV-VSV-G, pCMV Δ8.2, and the shRNA- or ORF-containing vector into HEK-293T cells, and then added to the target cells. Twenty-four hours later, the infected cells were selected with 10 μg/ml blasticidin S HCl (Gibco, A11139-03, for pLOC vector) or 2 μg/ml puromycin (Gibco, A11138-03, for pLKO.1 vector and the pBabe retroviral vector).
siRNA, shRNA, sgRNA, and plasmid constructs.
Lincode siRNAs targeting Lnc-BM were designed and synthesized (GE Healthcare Dharmacon) (sequences listed in Supplemental Table 3). Lincode nontargeting control siRNAs (D-001320) and ON-TARGETplus SMARTpool siRNA targeting IL6ST (L-005166) and OSMR (L-008050) (GE Healthcare Dharmacon) were used in this study. shRNAs targeting Lnc-BM were designed based on the siRNA sequence and cloned into pLKO.1-puro vector; the 2 shRNAs that produced the best knockdown efficiencies were used in the following functional studies.
CRISPR/Cas9 KO double nickase Lnc-BM plasmids were designed using 4 pairs of sgRNAs (sgRNA sequences listed in Supplemental Table 3) to generate stable knockout cell lines of 231-Br cells (Gene Editing/Cellular Model Core Facility, MD Anderson Cancer Center). Human JAK2 CRISPR/Cas9 KO plasmid (sc-400246) (detailed sgRNA sequences are listed in Supplemental Table 3), JAK2 HDR plasmid (sc-400246-HDR), and control CRISPR/Cas9 plasmid (sc-418922) were obtained from Santa Cruz Biotechnology.
The full-length pDONR223-JAK2 (Addgene 23915) was subcloned into the pBabe-SFB or Myc vector (Invitrogen). Full-length Lnc-BM and mutants were subcloned into pBabe or pCDNA3.1 backbone (Addgene). pLOC-ICAM1, pLOC-MMP9, and pLOC-RFP cDNA clones were obtained from Open Biosystems through the shRNA and ORFeome Core facility (MD Anderson Cancer Center). To generate Lnc-BM shRNA#2-resistant mammalian expression vectors, shRNA#2 targeting sequences CCAAGATTTCATAGCAATA were mutated to CCAAGACTCCGTGGCAATA. The point or domain deletion mutants were generated from the WT sequence using QuikChange Lightning Site-Directed Mutagenesis Kit (Agilent Technologies).
Biotinylated RNA preparation, RNA isolation, quantitative real-time PCR.
The Lnc-BM lncRNA sequence was cloned into a pGEM-3Z vector (Promega) for in vitro transcription using Biotin RNA Labeling Mix (Roche) and MEGAscript Transcription Kit (Life Technologies) as described previously (44). Total RNA was isolated using the RNeasy Plus Mini Kit with QIAshredder columns (Qiagen). Cytoplasmic and nuclear RNAs were purified from 1 × 10⁶ 231-Br cells using SurePrep Nuclear or Cytoplasmic RNA Purification Kit (Fisher Scientific). cDNA was prepared using the iScript ion Supermix (Bio-Rad). RT-qPCR was performed with iTaq universal SYBR Green Supermix (Bio-Rad) and detected on a CFX Connect Real-Time PCR Detection System (Bio-Rad). For TissueScan Cancer and Normal Tissue cDNA Arrays, the median value of Lnc-BM expression in normal breast tissues was normalized to 1.
RNAscope, IHC staining, and image quantification and RNA FISH.
Detection of Lnc-BM expression using RNAscope probe (designed by Advanced Cell Diagnostics) was performed on breast cancer tissue microarrays with RNAscope 2.0 High Definition Assay kit according to the manufacturer’s instructions (Advanced Cell Diagnostics). IHC was performed as previously described (12). The images were visualized with a Zeiss Axioskop 2 plus Microscope, and the slides were scanned on the Automated Cellular Image System III (ACIS III, Dako, Denmark) for quantification by digital image analysis. To define positive staining, staining was categorized into 5 grades, 0, 1+, 2+, 3+, and 4+, according to the following criteria: 0, no staining or less than 5% tumor cells in each field (3 fields) examined; 1+, 5%–10% tumor cells have staining in each field (3 fields) examined; 2+, 10%–25% tumor cells have staining in each field (3 fields) examined; 3+, 25%–50% tumor cells have staining in each field (3 fields) examined; 4+, 50%–100% tumor cells have staining in each field (3 fields) examined. The positive rate was calculated based on the case numbers of positive staining (1+ or above) over total cases. For quantification analysis of RNAscope signal and IHC staining, the staining density for each tissue sample was determined by Image-Pro plus 6.0 (Media Cybernetics) and calculated based on the average staining intensity and the percentage of positively stained cells. Macrometastatic lesions were calculated as long axis greater than 300 μm, and micrometastatic lesions were calculated as long axis less than 300 μm. For correlation analysis, the staining intensity of RNAscope and IHC staining was measured by Image-Pro plus 6.0 (Media Cybernetics) for each tissue sample. RNA FISH was performed using locked nucleic acid FISH technology according to the manufacturer’s instructions (Exiqon) with minor modifications, which have been described previously (12). The probe is listed in Supplemental Table 3.
RNA pull-down and mass spectrometry analysis, in vitro RNA pull-down assay, and in vitro RNA pull-down coupled with dot-blot assay.
RNA pull-down followed by mass spectrometry analysis and in vitro RNA-protein binding assay was performed as described before (12). The eluted protein complexes were denatured, reduced, alkylated, and digested with immobilized trypsin (Promega) for mass spectrometry analysis at MD Anderson Cancer Center Proteomics Facility. The in vitro binding of Lnc-BM with recombinant proteins and subsequent purification of protein-bound Lnc-BM sequence was performed as previously described (12). DNA oligonucleotides tiling along Lnc-BM are listed in Supplemental Table 3.
Microarray analysis and gene set enrichment analysis.
RNA samples were subjected to human genome-wide lncRNA microarray 3.0 analyses at Arraystar Inc. Differentially expressed lncRNAs with statistical significance were identified. The thresholds we used to screen upregulated or downregulated lncRNAs were fold change (≥3) and P value less than 0.05. Gene expression profiles of the Lnc-BM– and JAK2-deficient 231-Br cells treated with or without OSM (50 ng/ml) were determined with the Human Whole Genome Oligo Microarray Kit V2 from Agilent Technologies using the manufacturer’s instructions. Gene set enrichment analysis (GSEA) was performed using GSEA version 2.1.0 software downloaded from the Broad Institute (http://software.broadinstitute.org/gsea/index.jsp) using the MSigDB 3.0 gene set signature database following the author’s instructions (45).
RT2 profiler PCR array analysis.
The human Extracellular Matrix & Adhesion Molecules or human Cytokines & Chemokines RT2 Profiler PCR Array, consisting of 84 genes known to be involved in cell-cell and cell-matrix interactions or 84 key secreted proteins, was used to profile Lnc-BM–deficient cells according to the manufacturer’s instructions. Real-time PCR and data collection were performed on a CFX96 instrument (Bio-Rad).
Cell lysis, immunoprecipitation, immunoblotting, RIP assay, and MS2-TRAP assay.
Cell lysis, immunoprecipitation, and immunoblotting were performed as previously described (46). RIP assay was performed as previously described (12). The MS2-TRAP assay was performed as described previously (27). Antibodies used in this study are listed in Supplemental Table 4.
In vitro kinase assay and immunoprecipitation kinase assay.
For in vitro kinase assay, recombinant FLAG-tagged JAK2 full length, JH1, or JH1-JH2 proteins and GST-tagged STAT3 (Abnova) were incubated with 50 μl in vitro kinase assay buffer I (SignalChem) containing 100 μM ATP, in the presence of in vitro transcribed Lnc-BM full length or deletion mutant for 1 hour at 30°C. For the immunoprecipitation kinase assay, γ-2A cells transfected with 10 μg SFB-JAK2-JH2 expression construct were subjected to FLAG tag pull-down using FLAG M2 Magnetic beads (Sigma-Aldrich, M8823). The immunoprecipitates were further subjected to immunoprecipitation kinase assay using GST-tagged STAT3 and in vitro kinase assay buffer I (SignalChem) with addition of 20 mM MnCl2 and 100 μM ATP. The reactants were subjected to SDS-PAGE and immunoblotting using indicated antibodies.
Cell proliferation assay, cell apoptosis assay, cell adhesion assays, trans-BBB invasion assay, and macrophage Transwell migration assays.
The CellTiter 96 AQueous One Solution (Promega) was applied for the cell proliferation assay. To measure apoptosis, the cells were stained with an APC Annexin V apoptosis detection kit with propidium iodide according to the manufacturer’s instructions (BioLegend) and then subjected to FACS analysis.
The cell adhesion assay was performed using 24-well plates, which were coated with Matrigel (BD Biosciences) and kept at 37°C for 2 hours. Then, 4 × 10⁴ HBECs, HUVECs, or HMECs were suspended in 1 ml medium and applied to the precoated 24-well plate. After incubation at 37°C for another 24 hours to form tubes, 2 × 10⁴ cancer cells with GFP were seeded on the layer of endothelium for 16 hours. Adherent and spread cancer cells (green) and the endothelial tubes (bright field) were scored by fluorescence microscopy. The number of GFP+ cancer cells that adhered to and stretched over the HUVEC tubes was calculated.
Trans-BBB invasion assay was performed as previously described with some modifications (9). Pictures of multiple fields from 3 inserts per group were taken, and cancer cells with GFP transmitting to bottom chambers were counted.
U937 monocytes were primed with 5 nM PMA (Sigma-Aldrich) for 48 hours to become monocyte-derived macrophages as described previously (47). Transwell assays assessing U937 monocyte–derived macrophages or the migration potential of BV2 cells (resident macrophages in the brain) were performed on 24-well plates with inserts (BD Biosciences) according to the manufacturer’s instruction. The migrated cells were stained by crystal purple 24 hours later and then counted.
CCL2 and OSM ELISA.
The levels of human CCL2 and mouse OSM in the conditioned media of cultured cells were quantitatively determined in triplicate by ELISA kit according to the manufacturer’s protocol (R&D Systems).
Brain slice assays.
Organotypic slice cultures from mouse brains were prepared as previously described with some modifications (9). Brains from 4- to 6-week-old female athymic mice (NCr nu/nu) were dissected in the pre-cold minimum essential medium supplemented with 0.2 mM glutamine, 100 U/ml penicillin, 100 mg/ml streptomycin, and 4.5 mg/ml glucose, and the frontal pole and the cerebellum were removed from the whole brain section. Then, the brain was embedded in low-melting agarose (Sigma-Aldrich) preheated at 42°C, and the brain sections were sliced horizontally to a 350-μm thickness using a vibratome (Leica). Brain slices were placed with flat spatulas on top of a 0.4-μm polycarbonate Transwell membrane (Millipore) insert in a 6-well plate with 1 ml of culture media (50% minimum essential medium, 25% HBSS, 25% normal horse serum, 0.2 mM glutamine, 100 U/ml penicillin, 100 mg/ml streptomycin, and 4.5 mg/ml glucose) in the lower well. The brain slices were incubated at 37°C and 5% CO2 for 1 hour, and then 5 × 10⁴ cancer cells with GFP suspended in 2 μl of culture media were placed on the surface of the slice and incubated for 72 hours. Brain slices were fixed in paraformaldehyde (4%) overnight at 4°C, and then immunofluorescence staining of free-floating brain sections was performed for indicated antibodies. Confocal 3D imaging was set up with X (length, 450 μm), Y (width, 450 μm), and Z (depth, 30 slices × 2-μm interval = 60 μm) axes employed to investigate stretched cancer cells over blood vessel (X and Y facet) and invasion depth of cancer cells (Y and Z facet).
Determination of KD value using alpha assay.
Alpha binding assay was used to determine KD for the Lnc-BM and JAK2 interaction as previously described (44). The KD was determined by a competition experiment in which unlabeled Lnc-BM-FL was titrated (2-fold dilution) from 10 μM to 0.1 nM. Streptavidin donor beads and anti-GST or His6 AlphaLISA acceptor beads were used in these assays (PerkinElmer). The plate was read on the EnSpire Multimode Plate Reader (PerkinElmer). The competitive inhibition curves were calculated based on alpha signal readings by fitting to a “log (inhibitor) vs. response-variable slope (four parameters)” model (GraphPad Prism 6 software).
Animal studies.
All animal experiments were performed in accordance with protocol approved by the Institutional Animal Care and Use Committee of MD Anderson Cancer Center. The animal experiments were set up to use 5–10 mice per group to detect a 2-fold difference with power of 80% and at the significance level of 0.05 by a 2-sided test for significant studies (RaoSoft Inc. sample size calculator). The luciferase-labeled 231-Par, 231-Br, or HCC1954-Br (0.5 × 10⁶ to 1.0 × 10⁶) cells in 50 μl 1× PBS were intracardially injected into the left ventricle or intra-arterially injected into the right common carotid artery of 6-week-old female nu/nu mice using a 100-μl Hamilton Microliter syringe (10). To assess the effect of siRNA-incorporated chitosan nanoparticles (NP-siRNAs), the efficiency of NP-siRNA infiltration into the brain was firstly detected. The brains were taken out 48 hours after tail vein injection of the control NP-siRNA labeled with Cy3 (5′–3′: Cy3-UUCUCCGAACGUGUCACGU[dT][dT]); then brain tissues were subjected to fluorescence microscopy. For the NP-siRNA therapeutic model in vivo, mice were injected i.v. with NP-siRNAs (150 μg/kg body weight, twice per week) (control siRNA sequence is described above; Lnc-BM siRNAs are described in Supplemental Table 3) 3 days or 9 days after injection. Brain metastases were examined by bioluminescence imaging every week using an IVIS Spectrum Xenogen Imaging System (Caliper Life Sciences) or MRI at the Small Animal Imaging Facility of MD Anderson Cancer Center.
Data analysis and statistics.
Analyses of relative gene expression were determined using the 2–ΔΔCt method with GAPDH or B2M as the internal reference gene. Results are reported as mean ± SEM of at least 3 independent experiments. Each exact n value has been indicated in the corresponding figure legend. Comparisons were performed using Student’s t test or 1-way ANOVA (NS, P > 0.05; *P < 0.05, **P < 0.01, and ***P < 0.001) as indicated in individual figures. Pearson χ2 test or Fisher’s exact test was implemented for statistical analyses of the associations between markers and clinical parameters, as indicated in the individual figures. For survival analysis, the expression of Lnc-BM was treated as a binary variant and divided into “high” and “low” levels. The median expression level (50th percentile) of Lnc-BM was used as the cutoff. Kaplan-Meier survival curves were compared using the log rank test with GraphPad Prism software. A P value less than 0.05 was considered statistically significant. The investigators were not blinded to allocation during experiments and outcome assessment.
Study approval.
Fresh frozen primary tumor and paired normal breast tissues were obtained from individuals with breast cancer diagnosed at Yixing People’s Hospital in China (Yixing cohort) and Duke University (Duke cohort) ( see Supplemental Table 1) TMA_007 (Indivumed) and Normal Tissue cDNA Arrays I–IV were purchased from Origene. The clinical and pathological features of all tissue specimens are listed in Supplemental Table 1. BCBM tissue samples were previously described (48). The protocol was approved by the Institutional Review Board of Nanjing Medical University, Duke University Health System, and MD Anderson Cancer Center. All tissue samples were collected in compliance with informed consent policy. Detailed clinical information is summarized in Supplemental Table 1. All animal experiments were performed in accordance with protocol approved by the Institutional Animal Care and Use Committee of MD Anderson Cancer Center.
Author contributions
SW, C Lin, and LY designed the research, and SW performed most of the experiments, with participation from KL, C Li, QH, and WY. DHH executed mass spectrometry analysis. Clinical specimens were ascertained and processed by SW, JZ, YZ, JRM, and SH. PL, JS, KL, GEG, and and DY performed in vivo BCBM experiments. LSM and AKS prepared the NP-siRNAs. The histological staining and corresponding analysis were performed by KL and WX. JY helped with bioinformatics analysis. YY performed computational structure modeling. PKP helped with manuscript preparation. MCH, ERF, and GLB provided reagents and conceptual advices. SW, LY, and C Lin wrote the manuscript.
Supplementary Material
Acknowledgments
We thank Oluf Dimitri Røe (Norwegian University of Science and Technology, Norway) for revising the paper. We thank D. Aten for assistance with figure presentation. The manuscript was kindly edited by Peter K. Park and Sergey Egranov. We thank the Small Animal Imaging Facility at the MD Anderson Cancer Center for assistance in mouse imaging and tail vein injection. This work was supported in part by the National Natural Science Foundation of China (81370078, 81773383 to SW); the Science Foundation for Distinguished Young Scholars of Jiangsu Province (BK20170047 to SW); and grants from the National Key Research and Development Program of China (2016YFC0905900 to SW). This work was supported by an NIH R00 award (R00DK094981), an R01 award (1 R01 CA218025-01), University of Texas (UT) Startup and UT STARS grants, and a Cancer Prevention Research Institute of Texas (CPRIT) award (150094) to C. Lin; and an NIH R00 award (R00CA166527), an R01 award (1 R01 CA218036-01), a CPRIT award (R1218), and UT Startup, UT STARS, and DOD breakthrough (BC151465) grants to LY.
Version 1. 11/13/2017
Electronic publication
Version 2. 12/01/2017
Print issue publication
Footnotes
Conflict of interest: The authors have declared that no conflict of interest exists.
Reference information: J Clin Invest. 2017;127(12):4498–4515.https://doi.org/10.1172/JCI91553.
Contributor Information
Shouyu Wang, Email: wsy_cool@163.com.
Ke Liang, Email: kliang@mdanderson.org.
Qingsong Hu, Email: QHu1@mdanderson.org.
Ping Li, Email: pingli@mdanderson.org.
Jian Song, Email: jhsong@mdanderson.org.
Yuedong Yang, Email: yuedong.yang@griffith.edu.au.
Jun Yao, Email: JYao1@mdanderson.org.
Chunlai Li, Email: CLi10@mdanderson.org.
Wenhao Yang, Email: WYang3@mdanderson.org.
Jianwei Zhou, Email: jwzhou@njmu.edu.cn.
Yan Zhou, Email: dryzhou@163.com.
Weiya Xia, Email: wexia@mdanderson.org.
Mien-Chie Hung, Email: mhung@mdanderson.org.
Gabriel Lopez-Berestein, Email: glopez@mdanderson.org.
Suyun Huang, Email: suhuang@mdanderson.org.
Dihua Yu, Email: dyu@mdanderson.org.
Liuqing Yang, Email: lyang7@mdanderson.org.
Chunru Lin, Email: clin2@mdanderson.org.
References
- 1.Brufsky AM, et al. Central nervous system metastases in patients with HER2-positive metastatic breast cancer: incidence, treatment, and survival in patients from registHER. Clin Cancer Res. 2011;17(14):4834–4843. doi: 10.1158/1078-0432.CCR-10-2962. [DOI] [PubMed] [Google Scholar]
- 2.Kirsch DG, Loeffler JS. Brain metastases in patients with breast cancer: new horizons. Clin Breast Cancer. 2005;6(2):115–124. doi: 10.3816/CBC.2005.n.013. [DOI] [PubMed] [Google Scholar]
- 3.Aversa C, et al. Metastatic breast cancer subtypes and central nervous system metastases. Breast. 2014;23(5):623–628. doi: 10.1016/j.breast.2014.06.009. [DOI] [PubMed] [Google Scholar]
- 4.Kennecke H, et al. Metastatic behavior of breast cancer subtypes. J Clin Oncol. 2010;28(20):3271–3277. doi: 10.1200/JCO.2009.25.9820. [DOI] [PubMed] [Google Scholar]
- 5.Steeg PS, Camphausen KA, Smith QR. Brain metastases as preventive and therapeutic targets. Nat Rev Cancer. 2011;11(5):352–363. doi: 10.1038/nrc3053. [DOI] [PMC free article] [PubMed] [Google Scholar]
- 6.Kodack DP, Askoxylakis V, Ferraro GB, Fukumura D, Jain RK. Emerging strategies for treating brain metastases from breast cancer. Cancer Cell. 2015;27(2):163–175. doi: 10.1016/j.ccell.2015.01.001. [DOI] [PMC free article] [PubMed] [Google Scholar]
- 7.Bos PD, et al. Genes that mediate breast cancer metastasis to the brain. Nature. 2009;459(7249):1005–1009. doi: 10.1038/nature08021. [DOI] [PMC free article] [PubMed] [Google Scholar]
- 8.Kienast Y, et al. Real-time imaging reveals the single steps of brain metastasis formation. Nat Med. 2010;16(1):116–122. doi: 10.1038/nm.2072. [DOI] [PubMed] [Google Scholar]
- 9.Valiente M, et al. Serpins promote cancer cell survival and vascular co-option in brain metastasis. Cell. 2014;156(5):1002–1016. doi: 10.1016/j.cell.2014.01.040. [DOI] [PMC free article] [PubMed] [Google Scholar]
- 10.Zhang L, et al. Microenvironment-induced PTEN loss by exosomal microRNA primes brain metastasis outgrowth. Nature. 2015;527(7576):100–104. doi: 10.1038/nature15376. [DOI] [PMC free article] [PubMed] [Google Scholar]
- 11.Gupta RA, et al. Long non-coding RNA HOTAIR reprograms chromatin state to promote cancer metastasis. Nature. 2010;464(7291):1071–1076. doi: 10.1038/nature08975. [DOI] [PMC free article] [PubMed] [Google Scholar]
- 12.Xing Z, et al. lncRNA directs cooperative epigenetic regulation downstream of chemokine signals. Cell. 2014;159(5):1110–1125. doi: 10.1016/j.cell.2014.10.013. [DOI] [PMC free article] [PubMed] [Google Scholar]
- 13.Liu B, et al. A cytoplasmic NF-κB interacting long noncoding RNA blocks IκB phosphorylation and suppresses breast cancer metastasis. Cancer Cell. 2015;27(3):370–381. doi: 10.1016/j.ccell.2015.02.004. [DOI] [PubMed] [Google Scholar]
- 14.Rupaimoole R, et al. Long noncoding RNA ceruloplasmin promotes cancer growth by altering glycolysis. Cell Rep. 2015;13(11):2395–2402. doi: 10.1016/j.celrep.2015.11.047. [DOI] [PMC free article] [PubMed] [Google Scholar]
- 15.Minn AJ, et al. Genes that mediate breast cancer metastasis to lung. Nature. 2005;436(7050):518–524. doi: 10.1038/nature03799. [DOI] [PMC free article] [PubMed] [Google Scholar]
- 16.Kang Y, et al. A multigenic program mediating breast cancer metastasis to bone. Cancer Cell. 2003;3(6):537–549. doi: 10.1016/S1535-6108(03)00132-6. [DOI] [PubMed] [Google Scholar]
- 17.Zhang S, et al. SRC family kinases as novel therapeutic targets to treat breast cancer brain metastases. Cancer Res. 2013;73(18):5764–5774. doi: 10.1158/0008-5472.CAN-12-1803. [DOI] [PMC free article] [PubMed] [Google Scholar]
- 18.Weil RJ, Palmieri DC, Bronder JL, Stark AM, Steeg PS. Breast cancer metastasis to the central nervous system. Am J Pathol. 2005;167(4):913–920. doi: 10.1016/S0002-9440(10)61180-7. [DOI] [PMC free article] [PubMed] [Google Scholar]
- 19.Platt RJ, et al. CRISPR-Cas9 knockin mice for genome editing and cancer modeling. Cell. 2014;159(2):440–455. doi: 10.1016/j.cell.2014.09.014. [DOI] [PMC free article] [PubMed] [Google Scholar]
- 20.Malmo J, Sandvig A, Vårum KM, Strand SP. Nanoparticle mediated P-glycoprotein silencing for improved drug delivery across the blood-brain barrier: a siRNA-chitosan approach. PLoS One. 2013;8(1):e54182. doi: 10.1371/journal.pone.0054182. [DOI] [PMC free article] [PubMed] [Google Scholar]
- 21.Lee HT, et al. Stat3 orchestrates interaction between endothelial and tumor cells and inhibition of Stat3 suppresses brain metastasis of breast cancer cells. Oncotarget. 2015;6(12):10016–10029. doi: 10.18632/oncotarget.3540. [DOI] [PMC free article] [PubMed] [Google Scholar]
- 22.Pernet V, et al. Misguidance and modulation of axonal regeneration by Stat3 and Rho/ROCK signaling in the transparent optic nerve. Cell Death Dis. 2013;4:e734. doi: 10.1038/cddis.2013.266. [DOI] [PMC free article] [PubMed] [Google Scholar]
- 23.Haga S, et al. Stat3 protects against Fas-induced liver injury by redox-dependent and -independent mechanisms. J Clin Invest. 2003;112(7):989–998. doi: 10.1172/JCI17970. [DOI] [PMC free article] [PubMed] [Google Scholar]
- 24.Heinrich PC, Behrmann I, Müller-Newen G, Schaper F, Graeve L. Interleukin-6-type cytokine signalling through the gp130/Jak/STAT pathway. Biochem J. 1998;334(pt 2):297–314. doi: 10.1042/bj3340297. [DOI] [PMC free article] [PubMed] [Google Scholar]
- 25.Jones SA, Scheller J, Rose-John S. Therapeutic strategies for the clinical blockade of IL-6/gp130 signaling. J Clin Invest. 2011;121(9):3375–3383. doi: 10.1172/JCI57158. [DOI] [PMC free article] [PubMed] [Google Scholar]
- 26.Lin A, et al. The LINK-A lncRNA activates normoxic HIF1α signalling in triple-negative breast cancer. Nat Cell Biol. 2016;18(2):213–224. doi: 10.1038/ncb3295. [DOI] [PMC free article] [PubMed] [Google Scholar]
- 27.Yoon JH, Srikantan S, Gorospe M. MS2-TRAP (MS2-tagged RNA affinity purification): tagging RNA to identify associated miRNAs. Methods. 2012;58(2):81–87. doi: 10.1016/j.ymeth.2012.07.004. [DOI] [PMC free article] [PubMed] [Google Scholar]
- 28.Han C, et al. The RNA-binding protein DDX1 promotes primary microRNA maturation and inhibits ovarian tumor progression. Cell Rep. 2014;8(5):1447–1460. doi: 10.1016/j.celrep.2014.07.058. [DOI] [PMC free article] [PubMed] [Google Scholar]
- 29.Berteaux N, et al. H19 mRNA-like noncoding RNA promotes breast cancer cell proliferation through positive control by E2F1. J Biol Chem. 2005;280(33):29625–29636. doi: 10.1074/jbc.M504033200. [DOI] [PubMed] [Google Scholar]
- 30.Paz I, Kligun E, Bengad B, Mandel-Gutfreund Y. BindUP: a web server for non-homology-based prediction of DNA and RNA binding proteins. Nucleic Acids Res. 2016;44(W1):W568–W574. doi: 10.1093/nar/gkw454. [DOI] [PMC free article] [PubMed] [Google Scholar]
- 31.Zhang T, Zhang H, Chen K, Ruan J, Shen S, Kurgan L. Analysis and prediction of RNA-binding residues using sequence, evolutionary conservation, and predicted secondary structure and solvent accessibility. Curr Protein Pept Sci. 2010;11(7):609–628. doi: 10.2174/138920310794109193. [DOI] [PubMed] [Google Scholar]
- 32.Gilbert C, Svejstrup JQ. RNA immunoprecipitation for determining RNA-protein associations in vivo. Curr Protoc Mol Biol. 2006;Chapter 27:Unit 27.4. doi: 10.1002/0471142727.mb2704s75. [DOI] [PubMed] [Google Scholar]
- 33.Feener EP, Rosario F, Dunn SL, Stancheva Z, Myers MG. Tyrosine phosphorylation of Jak2 in the JH2 domain inhibits cytokine signaling. Mol Cell Biol. 2004;24(11):4968–4978. doi: 10.1128/MCB.24.11.4968-4978.2004. [DOI] [PMC free article] [PubMed] [Google Scholar]
- 34.Shan Y, et al. Molecular basis for pseudokinase-dependent autoinhibition of JAK2 tyrosine kinase. Nat Struct Mol Biol. 2014;21(7):579–584. doi: 10.1038/nsmb.2849. [DOI] [PMC free article] [PubMed] [Google Scholar]
- 35.Meyer SC, Levine RL. Molecular pathways: molecular basis for sensitivity and resistance to JAK kinase inhibitors. Clin Cancer Res. 2014;20(8):2051–2059. doi: 10.1158/1078-0432.CCR-13-0279. [DOI] [PMC free article] [PubMed] [Google Scholar]
- 36.Dauer DJ, et al. Stat3 regulates genes common to both wound healing and cancer. Oncogene. 2005;24(21):3397–3408. doi: 10.1038/sj.onc.1208469. [DOI] [PubMed] [Google Scholar]
- 37.Barreiro O, et al. Dynamic interaction of VCAM-1 and ICAM-1 with moesin and ezrin in a novel endothelial docking structure for adherent leukocytes. J Cell Biol. 2002;157(7):1233–1245. doi: 10.1083/jcb.200112126. [DOI] [PMC free article] [PubMed] [Google Scholar]
- 38.Yu H, Pardoll D, Jove R. STATs in cancer inflammation and immunity: a leading role for STAT3. Nat Rev Cancer. 2009;9(11):798–809. doi: 10.1038/nrc2734. [DOI] [PMC free article] [PubMed] [Google Scholar]
- 39.Scott LM, et al. The V617F JAK2 mutation is uncommon in cancers and in myeloid malignancies other than the classic myeloproliferative disorders. Blood. 2005;106(8):2920–2921. doi: 10.1182/blood-2005-05-2087. [DOI] [PubMed] [Google Scholar]
- 40.Marotta LL, et al. The JAK2/STAT3 signaling pathway is required for growth of CD44+CD24– stem cell-like breast cancer cells in human tumors. J Clin Invest. 2011;121(7):2723–2735. doi: 10.1172/JCI44745. [DOI] [PMC free article] [PubMed] [Google Scholar]
- 41.Prensner JR, Chinnaiyan AM. The emergence of lncRNAs in cancer biology. Cancer Discov. 2011;1(5):391–407. doi: 10.1158/2159-8290.CD-11-0209. [DOI] [PMC free article] [PubMed] [Google Scholar]
- 42.Lu C, et al. Regulation of tumor angiogenesis by EZH2. Cancer Cell. 2010;18(2):185–197. doi: 10.1016/j.ccr.2010.06.016. [DOI] [PMC free article] [PubMed] [Google Scholar]
- 43.Krzeszinski JY, et al. miR-34a blocks osteoporosis and bone metastasis by inhibiting osteoclastogenesis and Tgif2. Nature. 2014;512(7515):431–435. doi: 10.1038/nature13375. [DOI] [PMC free article] [PubMed] [Google Scholar] [Retracted]
- 44.Lin A, et al. The LINK-A lncRNA interacts with PtdIns(3,4,5)P3 to hyperactivate AKT and confer resistance to AKT inhibitors. Nat Cell Biol. 2017;19(3):238–251. doi: 10.1038/ncb3473. [DOI] [PMC free article] [PubMed] [Google Scholar]
- 45.Subramanian A, et al. Gene set enrichment analysis: a knowledge-based approach for interpreting genome-wide expression profiles. Proc Natl Acad Sci U S A. 2005;102(43):15545–15550. doi: 10.1073/pnas.0506580102. [DOI] [PMC free article] [PubMed] [Google Scholar]
- 46.Li C, et al. A ROR1-HER3-lncRNA signalling axis modulates the Hippo-YAP pathway to regulate bone metastasis. Nat Cell Biol. 2017;19(2):106–119. doi: 10.1038/ncb3464. [DOI] [PMC free article] [PubMed] [Google Scholar]
- 47.Zhou W, et al. Periostin secreted by glioblastoma stem cells recruits M2 tumour-associated macrophages and promotes malignant growth. Nat Cell Biol. 2015;17(2):170–182. doi: 10.1038/ncb3090. [DOI] [PMC free article] [PubMed] [Google Scholar]
- 48.Chiu WT, et al. Caveolin-1 upregulation mediates suppression of primary breast tumor growth and brain metastases by stat3 inhibition. Cancer Res. 2011;71(14):4932–4943. doi: 10.1158/0008-5472.CAN-10-4249. [DOI] [PMC free article] [PubMed] [Google Scholar]
Associated Data
This section collects any data citations, data availability statements, or supplementary materials included in this article.


