Abstract
We report the design of a mass spectrometer featuring an ion source that delivers ions directly into high vacuum from liquid inside a capillary with a sub-micrometer-diameter tip. The surface tension of water and formamide is sufficient to maintain a stable interface with high vacuum at the tip, and the gas load from the interface is negligible, even during electrospray. These conditions lifted the usual requirement of a differentially pumped system. The absence of a background gas also opened up the possibility of designing ion optics to collect and focus ions in order to achieve high overall transmission and detection efficiencies. We describe the operation and performance of the instrument and present mass spectra from solutions of salt ions and DNA bases in formamide and salt ions in water. The spectra show singly charged solute ions clustered with a small number of solvent molecules.
I. INTRODUCTION
We are developing a technology for sequencing single biopolymers, including proteins and nucleic acids, that combines mass spectrometry with nanopores. The basic strategy is to cleave individual amino acids (or nucleobases) from a protein molecule (or nucleic acid) as they transit a small hole and then identify each one by determining its charge-to-mass ratio in a mass spectrometer. Nanopores provide a means of forcing the biopolymer into a linear configuration so that its monomers are delivered into the mass spectrometer in sequence.1 Mass spectrometry offers the resolution needed to distinguish different monomers (up to perhaps two amino acid pairs with degenerate masses) or unique fragments. Furthermore, the continuous dynode detectors used in mass spectrometers can detect single ions with near unit quantum efficiency and a high enough bandwidth to resolve the arrival order of monomers delivered through the nanopore moving at speeds of centimeters per second, similar to the speeds observed in solution-based nanopore translocation experiments.1
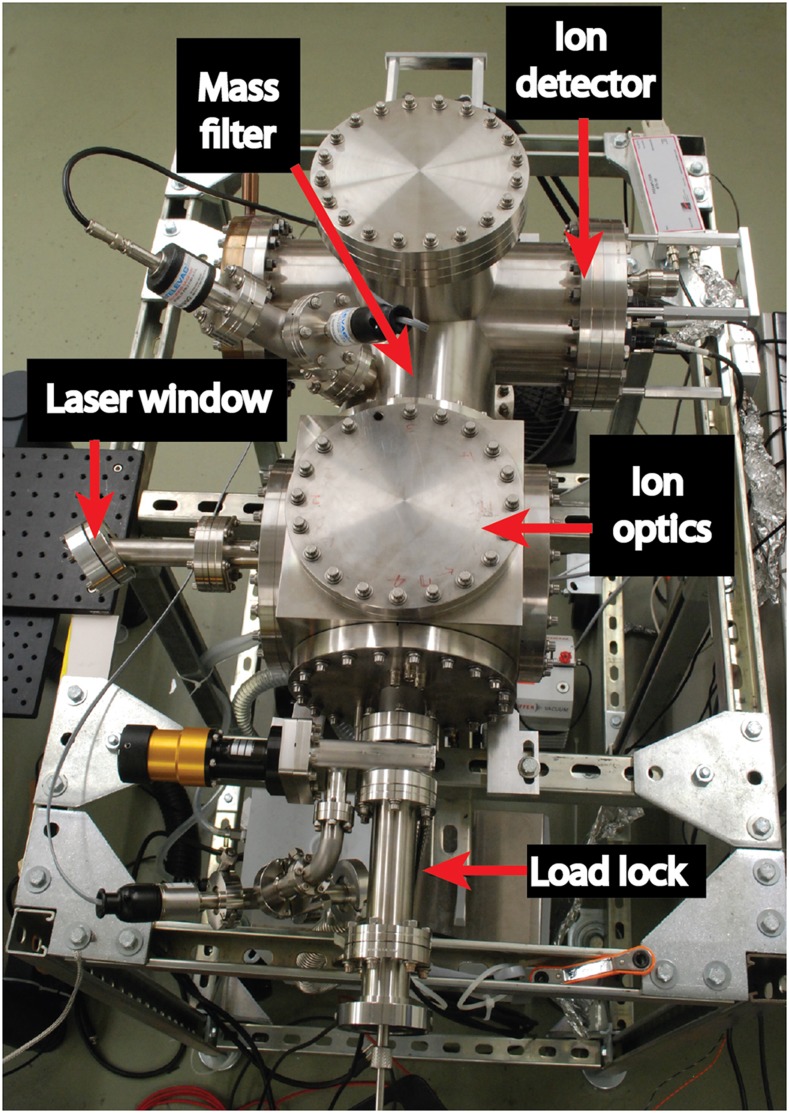
We designed the nanopore mass spectrometer, shown in Fig. 1, to deliver ions directly from liquid into high vacuum, where they are collected by electrostatic lenses and analyzed by a quadrupole mass filter and a single ion detector. A key feature that distinguishes this instrument from a conventional electrospray ionization (ESI) mass spectrometer is the absence of a background gas. Collisions with gas molecules are conventionally used to desolvate the charged droplets emitted from the ESI source,2 which leads to a chain of Coulomb explosions that send charged daughter droplets flying in a widening plume before the droplets become small enough for single ions to emerge either from an ion evaporation process3,4 or as charge residues.5–8 This method for creating ions is problematic because it disperses ions widely, limiting one’s ability to detect more than a small fraction of them and scrambling their order, which needs to be preserved in order to sequence a biopolymer.9 The use of a background gas must be abandoned for our sequencing concept to work.
FIG. 1.
The nanopore mass spectrometer.
Electrospray sources have previously been observed to emit ions directly from the charged surfaces of molten metals,10–13 concentrated salt solutions in glycerol,14,15 and ionic liquids.16 The analysis of ions emitted directly into vacuum, called electrohydrodynamic (EHD) mass spectrometry,17 began with the work of Swatik and Hendricks,10 who in 1968 identified conditions which optimized ion emission to the almost complete exclusion of droplets using a gallium-indium liquid alloy. They found that ion emission occurred preferentially with highly conductive fluids sprayed and low flow rates. Thus many studies of liquids other than molten metals focused on the solvent glycerol, which has a low vapor pressure and a high viscosity, while still being able to dissolve a wide variety of organic materials. Mass spectra were obtained showing sodium ions clustered with several glycerol molecules, as well as sodium ions complexed with neutral peptides and clustered with glycerol molecules.
Several groups attempted to extend EHD mass spectrometry to aqueous solutions; however, electrical arcing and freezing of the water at the electrospray source prevented them from obtaining spectra.17 Zolotoi and co-workers in 1980 and 1982 reported some success with aqueous solutions of salts, sucrose, and nucleic acids;18,19 however, these studies involved complicated spectra indicating a variety of possible ionization and emission modes as well as unstable spray conditions and evidence of electrical discharge. Major drawbacks of those studies included the poor mass spectra obtained, the relatively high applied voltages (8 kV) needed to produce ions, and the large sample volumes that were needed. The direct emission of ions from volatile neutral liquids has so far not been adopted in mass spectrometry.
The nanospray technique20 represented an important advance for mass spectrometry. The nanospray technique achieved a better that two orders of magnitude improvement in the sensitivity of mass spectrometry, and it did that by using small tip diameters that were on the order of 1-5 μm and low flow rates that were on the order of nl/min;21,22 basically, smaller tips produce smaller initial droplets, which undergo fewer Coulomb explosions and result in a greatly enhanced fraction of ions that are ultimately measured. In highly optimized nanospray systems, it is estimated that approximately 60%-70% of the ions in solution will make it into the vacuum chamber, while the overall transmission efficiency from solution to detection is closer to 1%-10%.22,23 This includes losses at ion optic interfaces, during mass separation, and at the detector. The nanospray technique also facilitated the coupling of mass spectrometry to lab-on-a-chip-style microfluidic sample handling and analysis systems, thanks mainly to the small sample volumes it requires.24–26
We reason that by making an electrospray source with a small enough tip, it should be possible to restrict the flow of our electrospray emitters enough to bypass the Coulomb explosions altogether and instead release single ions directly from the liquid inside the tip. In such a situation, the ions emerge from what amounts to a point source without the possibility of undergoing Coulomb explosions, and thus opening up the possibility of designing ion optics to collect and detect them with near 100% efficiency while preserving their order.
II. INSTRUMENT OVERVIEW
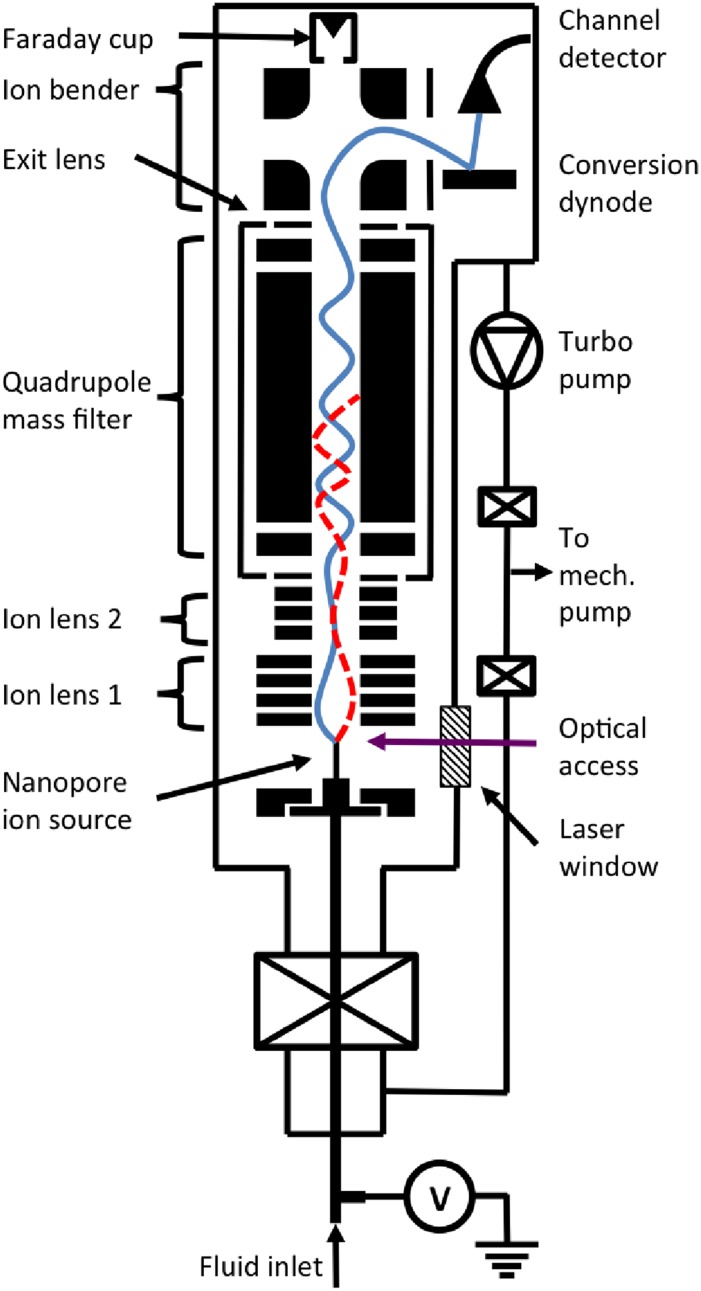
A schematic of the nanopore mass spectrometer illustrating the important components and two hypothetical ion trajectories—one reaching the detector and the other being filtered out—is shown in Fig. 2. The ion source features a sub-micrometer pore where a liquid sample creates a stable interface with vacuum. Ions are drawn from the liquid into vacuum when the liquid is voltage-biased about 200–500 V relative to an extraction electrode located about 0.5 cm away. The ions travel through a circular hole in the center of the extractor and then through an electrostatic einzel lens that focuses their trajectories onto the main axis of the mass spectrometer. A second einzel lens collimates the ions before they enter a quadrupole mass filter (Extrel MAX-500, Pittsburgh, PA). Transmitted ions are deflected 90° by an energy-selective, electrostatic bender toward the detector. Ions whose mass-to-charge ratios (m/z) are outside the acceptance window of the mass filter follow unstable trajectories that do not terminate at the detector. The detector (DeTech 413, Palmer, MA) comprises a conversion dynode and an electron multiplier and is sensitive to single ions. The instrument builds a mass spectrum by scanning the acceptance window of the mass filter and registering the abundances of the transmitted ions.
FIG. 2.
Schematic of the nanopore mass spectrometer. Electric fields draw ions from liquid into vacuum at a nano-scale aperture in the ion source. The ion-optic system, which includes two einzel lenses, a quadrupole mass filter, an exit lens, and an electrostatic bender, gathers ions and transmits them selectively on the basis of their m/z. A single-ion detector registers the transmitted ions. The sketch illustrates the hypothetical trajectories of ions transmitted (solid blue) and rejected (dashed red) by the mass filter.
The instrument is housed in a vacuum chamber evacuated by a turbomolecular pump (Pfeiffer TMU-521-P) backed by a two-stage rotary vane pump (Pfeiffer Duo-20M). The mass spectrometer operates at a pressure of about 10−6 mbar. At that pressure, the mean free path of a molecule 5 Å in diameter is about 6 m, which is much longer than the 0.6 m path length between the ion source and the detector. A window in the vacuum chamber grants optical access to the nanopore and a section of the ion flight path.
III. NANOPORE ION SOURCE
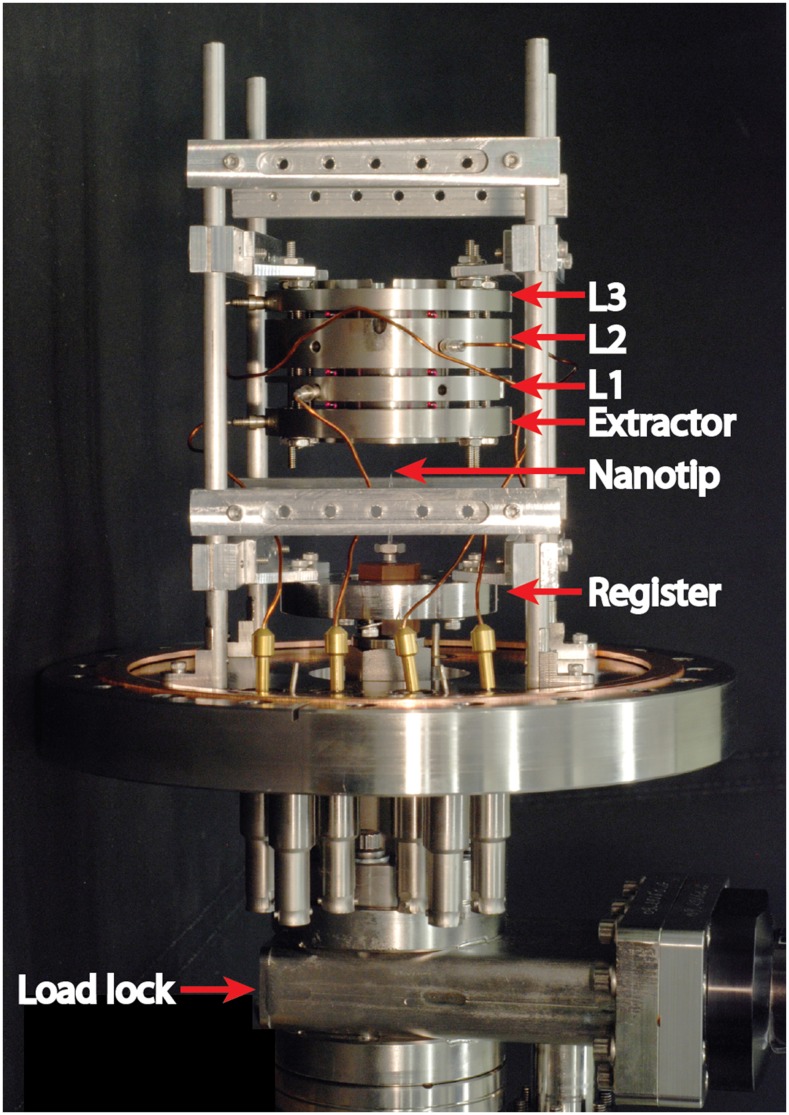
The heart of the mass spectrometer is the nanopore ion source, which transfers ions directly from solution into high vacuum and then corrals them into the mass filter. Our custom-made ion source, shown in Fig. 3, comprises the nanopore, the extraction electrode, and the first einzel lens, all mounted on a single 8 in. CF flange at the “front” of the vacuum chamber. Four parallel rods bolted to the flange hold and align the electrostatic elements as well as a register for the nanopore mount. The nanopore, mounted on a Vespel block at the end of a hollow stainless steel rod, locks kinematically into position when three legs in the block engage slots in the register. The ion source can host two types of nanopore: one at the tips of slender capillaries and the other in planar chips. We describe the two alternative configurations in Subsections III A–III D.
FIG. 3.
The nanopore ion source. The configuration shown here features a pulled capillary with a nanoscale tip. The image also shows the register holding the nanopore mount in position, the extractor, the einzel lens, and the gate valve of the vacuum load lock.
The liquid in the nanopore is usually biased to a constant potential of 201 V relative to ground by a voltage supply (Keithley 2657A) that also monitors the current of ions leaving the nanopore. The potential of the extractor electrode is adjusted between −300 V and +300 V to achieve ion emission. Electrical feedthroughs on the same flange establish connections to each element of the ion optics. A metal wire passes through two layers of PEEK tubing and the hollow rod to establish electrical contact with the liquid. The wire is usually made of silver and plated with silver-chloride. The inner polyether ether ketone (PEEK) tube has a 1/16 in. outer diameter, is filled with liquid, and is open to the atmosphere at the external end. The outer PEEK tube has a 1/8 in. outer diameter and is used to further isolate the charged liquid from the grounded rod.
Because the nanopore is effectively a point source of ions and because even charged droplets cannot undergo Coulomb explosions under high vacuum, Liouville’s theorem predicts that excellent focusing properties are possible in our instrument.27 The extractor and einzel lens make up a four-element system designed to efficiently collect ions from a wide range of initial directions and kinetic energies. The electrostatic elements are made of stainless steel. Their design is notable for its use of unequal widths, which was guided by simulations of ion trajectories performed using the SIMION modeling program. The electrostatic elements are isolated from one another by ruby ball spacers and held together in a single unit by way of threaded rods that are isolated from the metal elements. To prevent charging issues, each element has a lip in its cross section that nests inside a recess in its neighboring element, such that no line-of-sight exists between the inside of the ion optics and any insulating mate-rials.
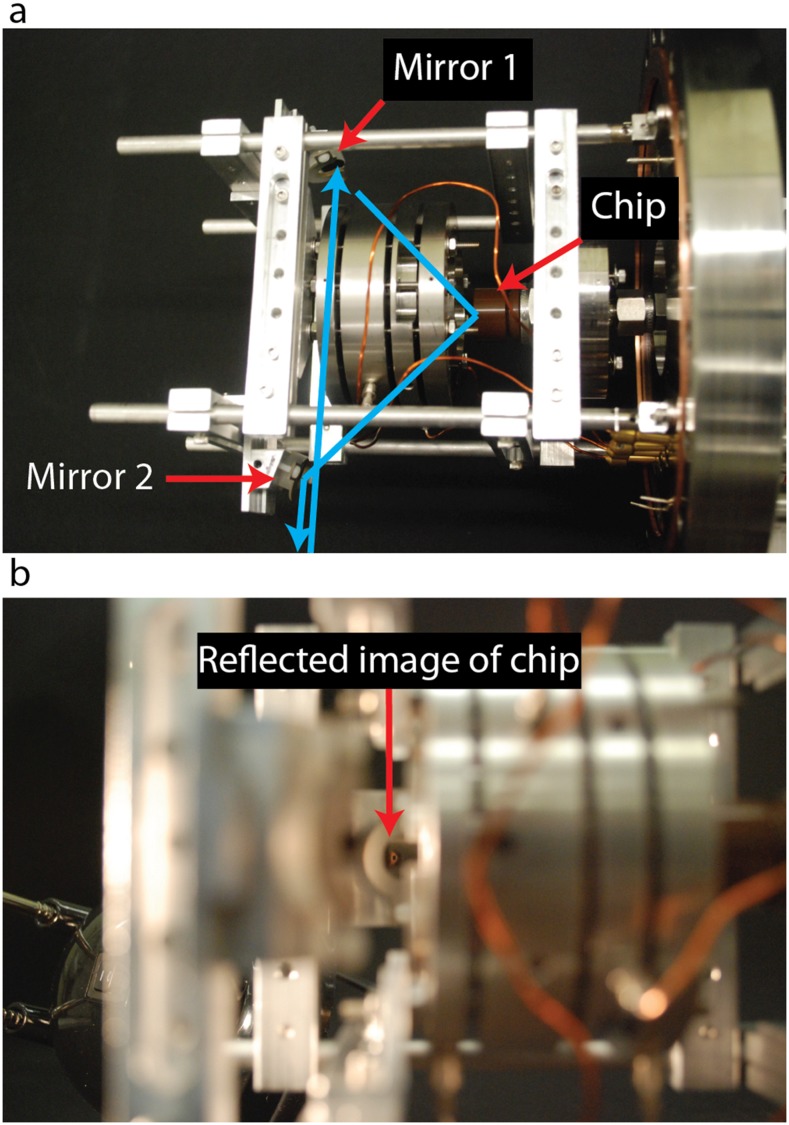
We designed the ion source to allow laser light to reach the nanopore or to intercept ions along their flight path. Our motivation was to enable photons to be used to stimulate photofragmentation, the desolvation of ionic clusters, or other processes. We introduced a bore in the einzel lens and extractor, oriented at 45° from the ion beam axis, that leads to the location of the nanopore. A laser beam can be steered through the bore by a mirror (ThorLabs, PF05-03-F01) mounted on the ion source assembly. Light that is reflected by a planar chip can pass through a second bore, reflect off a second mirror, and exit the vacuum chamber. The reflected light can be used to image the chip or align the laser beam. Pictures indicating the bores, the mirrors, and the light path are presented in Fig. 4. Light enters and exits the vacuum chamber through a fused silica window (CVI PW1-2050-UV) mounted at Brewster’s angle on a custom flange that offers excellent transmission of light, including the ultraviolet part of the spectrum.
FIG. 4.
Laser access to the nanopore ion source. (a) The blue arrows indicate the path of a laser beam to and from a chip-based nanopore. The locations of the mirrors and the chip are indicated. (b) A part of the chip can be seen in the mirror.
A. Capillary nanotips
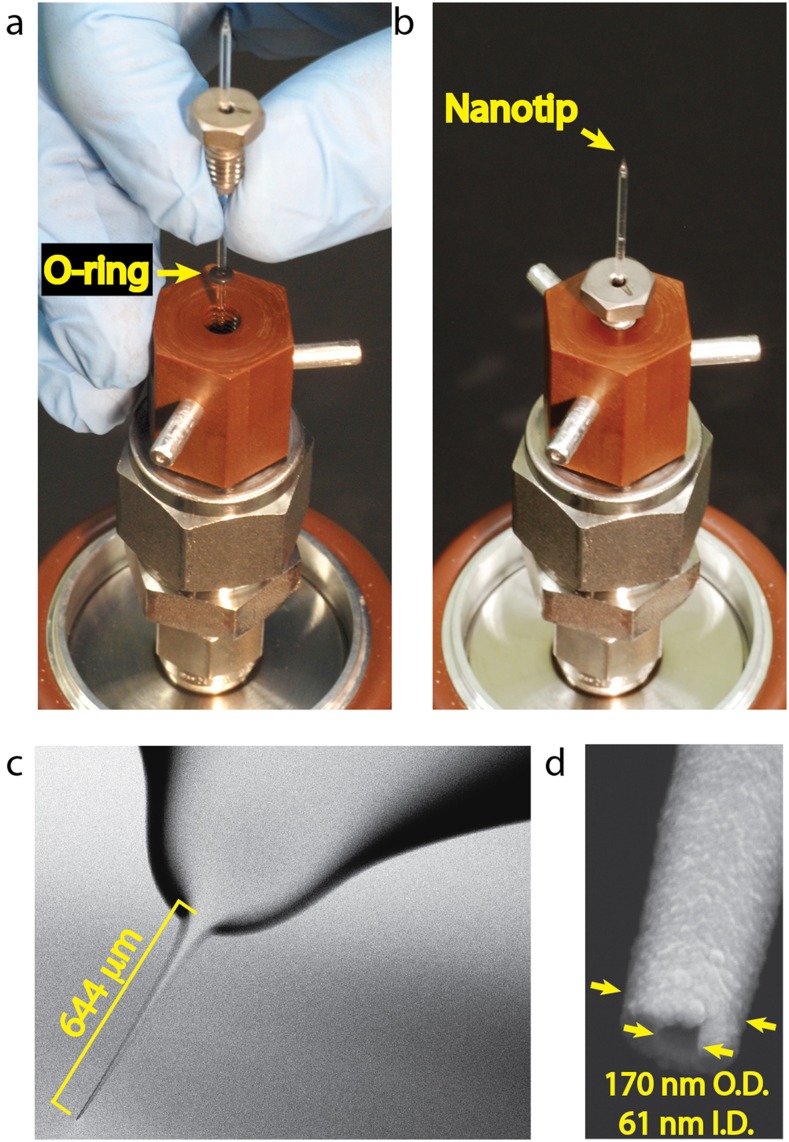
A conventional electrospray ion source delivers ions into a mass spectrometer from the tip of a slender capillary. The high aspect ratio of the structure enhances the electric fields at the tip, thereby lowering the voltage required to generate an electrospray. Glass capillaries can be heated and pulled so as to produce nozzles whose diameters can be controlled at the level of single nanometers; diameters as small as 14 nm have been reported.28 Our ion source accommodates nanotips at the end of 1 mm-diameter glass capillaries. A capillary is mounted in a Vespel block at the end of the hollow sample introduction rod, as shown in Figs. 5(a) and 5(b). A Viton O-ring surrounding the capillary, compressed between the threaded block and a threaded high-performance liquid chromatography (HPLC) fitting, creates a vacuum-tight seal.
FIG. 5.
A capillary nanotip ion source. (a) Mounting a nanotip. The picture shows the O-ring between the threaded HPLC fitting and the mounting block. (b) The nanotip assembly, also showing the three legs that engage the register. (c) Scanning electron micrograph of a pulled capillary nanotip. (d) Detail showing the 61 nm inside and 170 nm outside diameters of the orifice. The nanotip was coated with nm of carbon for imaging.
Our nanotips are made from borosilicate glass capillaries (Sutter Instruments, BF100-50-7.5, 1.0 mm OD × 0.5 mm ID) pulled using a pipette puller with a 2.5 mm box filament (Sutter Instruments P-97). Figures 5(c) and 5(d) show scanning electron micrographs of a nanotip with an inner diameter of 60 nm. A four-step pulling procedure created the steep taper, followed by the shallow taper extending out to the tip. The ratio of the outer diameter to the inner diameter of the nanotip was approximately 2:1, the same as that of the capillary. We have found that glass capillaries with a filament inside are much easier to fill with fluid than capillaries without a filament.
B. Chip-based nanopores
Chip-based nanopores are appealing for several reasons: chief among them being that microfabrication and nanofabrication techniques are available for reproducibly creating large numbers of structures with nanopores whose dimensions can be controlled at the scale of single nanometers.29 A chip-based nanopore can also be shaped to have a short fluid path to the orifice, allowing liquid samples to be more easily introduced or replaced than inside a capillary.
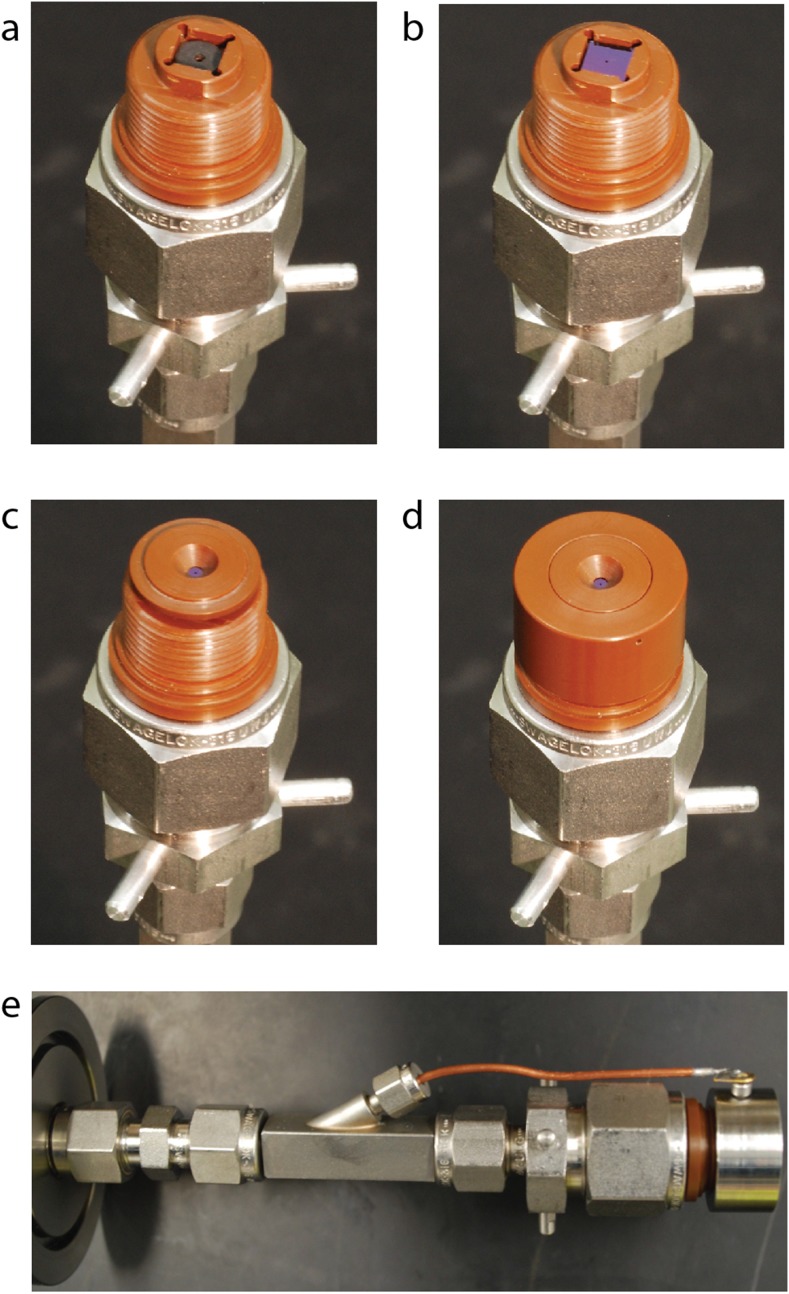
Figure 6 shows the assembly of a second mounting block that accommodates nanopores in planar chips. The Vespel block has a recessed seat that holds a thin cylindrical Viton gasket and a 5 mm 5 mm chip. Above the chip sits a keyed Vespel cover-piece that does not rotate. A threaded cylindrical Vespel cap attaches to the mounting block and compresses the gasket, the chip, and the cover-piece without shearing them. This approach creates a vacuum-tight seal between the mounting block and the chip while distributing compression forces evenly so that brittle chips made of silicon or glass do not break. It is also possible to cover the chip holder with a stainless steel cap that can be voltage-biased using a second insulated wire threaded through the hollow rod, as shown in Fig. 6(e).
FIG. 6.
A chip-based nanopore ion source. (a) A Viton gasket sits in the square recess of the mounting block. (b) A mm silicon chip with a nanopore in a silicon nitride membrane sits on the gasket. (c) A keyed cover-piece rests on top of the chip. (d) A threaded cap compresses the gasket, the chip, and the cover-piece. (e) Side view of the chip mount, assembled with a stainless steel cap. The wire that is visible controls the voltage of the cap. That wire enters through the hollow sample introduction rod.
It is important to note that although we report our design for integrating a planar chip based nanopore into the nanopore mass spectrometer here, we were never able to obtain electrosprays from such planar devices. We found that strong electric fields would often develop at the corners and edges of the silicon chips which caused arcing to occur and the chip to crack before an electrospray from the nanopore could be observed. As a result, we chose to focus on nanopores made from the aforementioned pulled glass capillaries. In the future, we may revisit the idea of chip-based ion sources with a redesigned architecture that takes advantage of electric field enhancement at a sharp feature containing the nanopore.
C. Tube-in-tube fluid delivery system
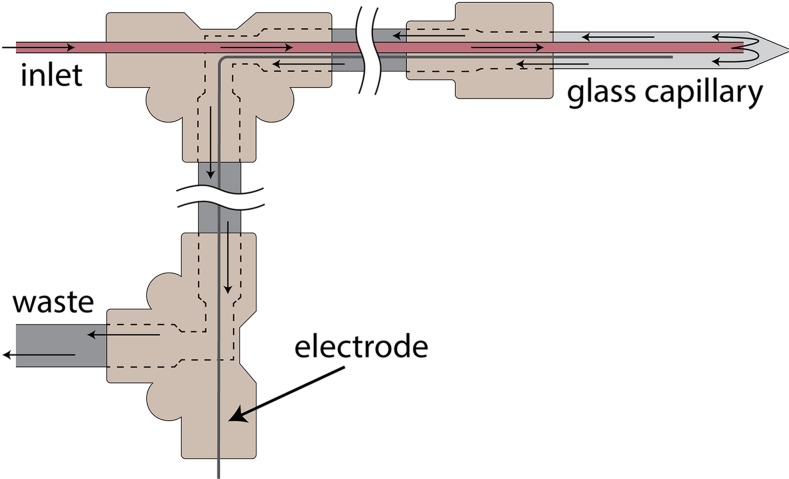
A tubing system comprising a thin, inner tube (150 μm inner diameter, 360 μm outer diameter) that passes through a wide, outer tube (0.04 in. inner diameter, 0.06 in. outer diameter), as shown in Fig. 7, allows us to flush the solution inside a capillary source while it is spraying. The thin inner tube delivers fresh liquid into the capillary, while the wider outer tube provides a path for the waste solution to exit; the waste flows in the space between the outer surface of the inner tube and the inner surface of the outer tube. The inner tube comes to within about 1 mm of the apex of the nanoscale capillary. The complete exchange of solutions at the tip relies on a combination of diffusion and electrospray emission and takes about 30-60 min for most aqueous and formamide solutions. This “tube-in-tube” system has several advantages: First, it greatly increases the throughput in measurements because one can test many different solutions without having to break vacuum and then pump down again with a new tip. Second, it enables us to eliminate the particular tip being used as a variable affecting different measurements; one can change the solution being measured on the fly while ions are being sprayed and measured.
FIG. 7.
Schematic diagram of the “tube-in-tube” fluid inlet and outlet system. A thin inlet tube delivers liquid into the capillary near the tip. A wider outer tube through which the inlet tube passes provides a path for waste liquid to flow out.
D. Custom software
Custom-developed software written in MATLAB simultaneously controls the potentials applied to the ion source and ion lenses, while recording those potentials, the electrical current from the ion source, and the pressure inside the chamber as functions of time. The interface between the software and the hardware is a National Instruments data acquisition device with an RS-232 serial link.
We also wrote a different program in Mathematica to display and analyze data as it evolves in time. The data from our experiments are inherently time-dependent. The spectrum we measure evolves as we change the chemical species inside the source, as we adjust applied voltages, and as the capillary ages. The software we wrote creates an animated plot of the mass spectrum with optional correlated plots of other data from the experiment, such as the ion source current, the ion source voltage, the detector current, and the pressure. This allows us to vary experimental parameters and observe the effects. For example, we can add a chemical species to the solution inside an ion source and watch new peaks emerge in the mass spectrum.
IV. MASS FILTER
We opted for a quadrupole mass filter for several reasons. First, the quadrupole we initially selected offered a wide m/z range of 10-500 amu and high resolution (m/Δm = 2000 for FWHM) when combined with a 1.2 MHz RF oscillator; we have since installed a 440 kHz RF oscillator that gives an even wider m/z range of 10-4000 amu. Second, the width and the scanning rate of the m/z acceptance window can be adjusted. Third, the approximately 1.5 cm-diameter entrance and exit apertures of the quadrupole are wide enough to achieve a relatively high transmission efficiency. The main drawback of the quadrupole, for our purposes, is that the m/z transmission window is specified at each moment; therefore, the mass filter cannot determine both m/z and the timing of multiple unknown ions. In other words, a quadrupole can answer the question “Is the m/z of this ion X?,” but not “What is the m/z of this ion”?
The quadrupole is a set of four parallel, 19 mm-diameter metal rods, whose axes are arranged in a square. Diagonally opposing rods are electrically connected, so their surfaces are equipotentials. The quadrupole works as a mass filter when a radio-frequency (RF) alternating voltage signal and a constant (DC) voltage offset are applied between the two independent pairs of rods. The time-dependent fields create a stable trajectory for ions within a specific range of m/z and eject ions outside that range.30 The acceptance window is specified in practice by controlling the amplitudes of the DC offset and the RF signal at a constant operating frequency.
The resolution of the quadrupole improves with the number of RF cycles the ions experience inside the quadrupole, which depends on the velocity of the ions and the frequency of the oscillator. The kinetic energy of ions entering the quadrupole can be controlled by offsetting the voltage of all four rods and the sheath that houses them. The voltages of the rods and the sheath can be offset independently by as much as V. In practice, however, we offset the voltage of the rods and the sheath by the same amount to maintain a consistent electric field distribution. That offset voltage is called the “probe bias” and is usually close to the nanopore voltage so that ions travel slowly through the quadrupole. The optimal kinetic energy of ions traversing our mass filter is between 1 and 10 eV; however, we have collected well-resolved spectra from ions with eV of kinetic energy.
A second einzel lens attached to the entrance of the quadrupole serves to improve the transmission of ions. There is also an exit lens whose purpose is to focus the transmitted ions into the detector. The four-element electrostatic ion bender (Extrel) deflects the ions leaving the quadrupole into the detector, while filtering out neutral species. Alternatively, the bender can be turned off to allow the ions to travel straight through it into a Faraday cup, or its voltages can be flipped to steer the ion beam in the opposite direction onto a microchannel plate detector that we use to adjust the ion optics while imaging the beam.
The ion detector sits in a grounded metal housing with a small opening to admit incoming ions. Ions entering the detector housing are accelerated to keV before they impinge on a conversion dynode. When positive ions impinge the conversion dynode, they produce secondary electrons, which are amplified by a continuous dynode electron multiplier. Negative ions produce secondary positive ions, which are detected by the electron multiplier. In both cases, a voltage bias of 2000 V is applied across the electron multiplier, yielding a gain of about 106.
V. VACUUM SYSTEM
The nanopore mass spectrometer is housed in a vacuum chamber evacuated by a single high vacuum pump. This simple configuration is possible, thanks to the nanopore ion source, which transfers ions directly into vacuum from liquid with an extremely low gas load. Conventional electrospray mass spectrometers, by contrast, require differentially pumped zones because the ion source emits charged droplets that must evaporate in a zone containing background gas before individual ions can enter a separate, high vacuum zone where the mass selection occurs.
The main body of the vacuum chamber is an 8 in., 6-way cross attached to an 8 in., 6-way cube (MDC). The nanopore ion source is mounted to the “front” of the cube. The quadrupole mass filter, ion bender, and Faraday cup are all housed in the cross and mounted to its “back” flange. The ion detector is mounted to a separate flange on a side of the cross. The turbomolecular pump attaches to the cross from below. A cold cathode gauge and a thermocouple gauge monitor the pressure in the main chamber. The base pressure of the vacuum chamber is typically about 10−7 mbar.
A load lock on the same flange as the ion source permits the introduction of a nanopore filled with liquid into the high vacuum. The load lock is first evacuated using the rotary vane pump that also backs the turbomolecular pump. When the pressure inside the load lock drops below about 12 mbar, as indicated by a second thermocouple vacuum gauge, the valve to the rotary vane pump can be closed and the gate valve to the main chamber opened. The nanopore is loaded into position by sliding the hollow rod to which it is attached through a Cajon fitting. A Viton O-ring inside that fitting allows such extended linear motion without breaking the vacuum. The pressure inside the chamber rises to about 10−6 mbar with the introduction of a nanopore containing liquid sample. The safe operation of the mass filter and the ion detector requires a chamber pressure in the lower part of the 10−6 mbar range.
VI. PERFORMANCE
A. Ion emission directly into high vacuum
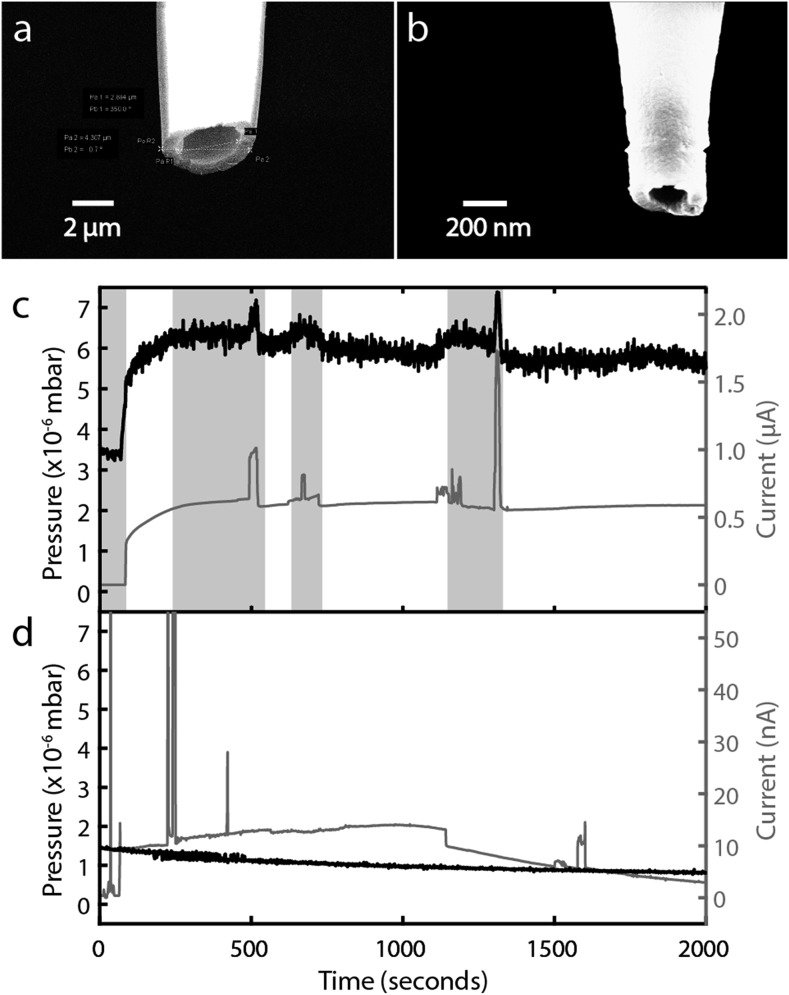
The use of an ion source with a sub-micrometer-diameter nozzle makes it possible to perform mass spectrometry on ions emitted directly into high vacuum. One of the important reasons for this is that nanoscale nozzles contribute a negligible gas load, even during electrospray, whereas nozzles with diameters of a micrometer or more tend to result in spikes in the chamber pressure that go beyond the safe operating range of the mass spectrometer. We will illustrate this point by comparing the behavior of two glass capillaries with very different opening diameters, shown in Figs. 8(a) and 8(b).
FIG. 8.
Influence of the ion source nozzle size on the vacuum chamber pressure during electrospray. (a) Scanning electron micrographs of capillary tips with (a) 4.3 μm outer diameter and 2.9 μm inner diameter and (b) 350 nm outer diameter and 190 nm inner diameter. (c) and (d) show traces of the chamber pressure (black, left axis) and the electrospray current from the tip (gray, right axis) as functions of time for the tips in panels (a) and (b), respectively. Both tips contained 1M NaI in formamide. The total applied extraction voltages were 1.15 kV in (c) and 0.248 kV in (d). The shaded regions indicate times when the safe operating pressure was exceeded and the mass filter and detector turned off.
Figure 8(a) shows a scanning electron micrograph of a pulled glass capillary whose tip has an inner diameter of 2.9 μm and an outer diameter of 4.3 μm. The capillary was cleaned by briefly exposing it to air plasma, then filled with a 1M solution of sodium iodide (NaI) in formamide, and then introduced into the nanopore mass spectrometer. Figure 8(c) shows the time dependence of the chamber pressure and the ion emission current with the micron-scale tip inside the mass spectrometer. The liquid formed a stable interface with the high vacuum in the absence of an applied extraction voltage, and the pressure inside the chamber was about mbar. The application of an extraction voltage of 1.15 kV between the nanopore and the extraction electrode caused about 0.5 μA of current to flow from the tip. At the same time, the chamber pressure was observed to rise to about mbar. The current and the pressure varied in time in a correlated way. The pressure occasionally rose above a value (between 6 and 7 × 10⁻⁶ mbar) that triggered the automatic shutdown of the quadrupole mass filter and ion detector.
Figure 8(b) shows a pulled glass capillary whose tip has an inner diameter of 190 nm and an outer diameter of 350 nm. That tip was prepared and introduced into the instrument as before. Figure 8(d) shows the time dependence of the chamber pressure and the ion emission current with the nanotip inside the mass spectrometer. In this case, the pressure inside the chamber was about mbar with the unbiased tip inside, and it took a total extraction voltage of only 248 V to induce current to flow. The current was about 10 nA, but it varied significantly over time; this particular tip showed much larger variations, including spikes, in the current than we typically observe. Despite that, the chamber pressure showed no hint of rising together with the current. The pressure remained low, decreasing slowly over time to a value below mbar.
In our experience, capillary tips with outer diameters below about 500 nm consistently give ion emission without significantly affecting the chamber pressure. We find similar results with formamide and aqueous solutions.
There are two properties of small tips that help to explain why they do not contribute a significant gas load during electrospray: first, the pressure-driven fluid flow rate decreases rapidly as the diameter of a cylindrical channel constricts. Second, the high geometric field enhancement factor of narrow tips lowers the voltage required for ion emission to occur, which results in a lower emission current and in turn less Joule heating and less entrained fluid flow.
B. Mass spectra of simple salts
The first mass spectrometry measurements we per-formed with our new ion source made use of sodium iodide solutions in formamide rather than water or glycerol. The choice to use formamide was inspired by the work of Fernandez de la Mora and colleagues,4,31 who worked to produce electrosprays in the pure ion evaporation regime. Like glycerol, formamide has a much lower vapor pressure than water, which leads to more stable electrosprays. However, formamide can also dissolve salt and organic molecules at high concentrations that are comparable to those achievable in water.
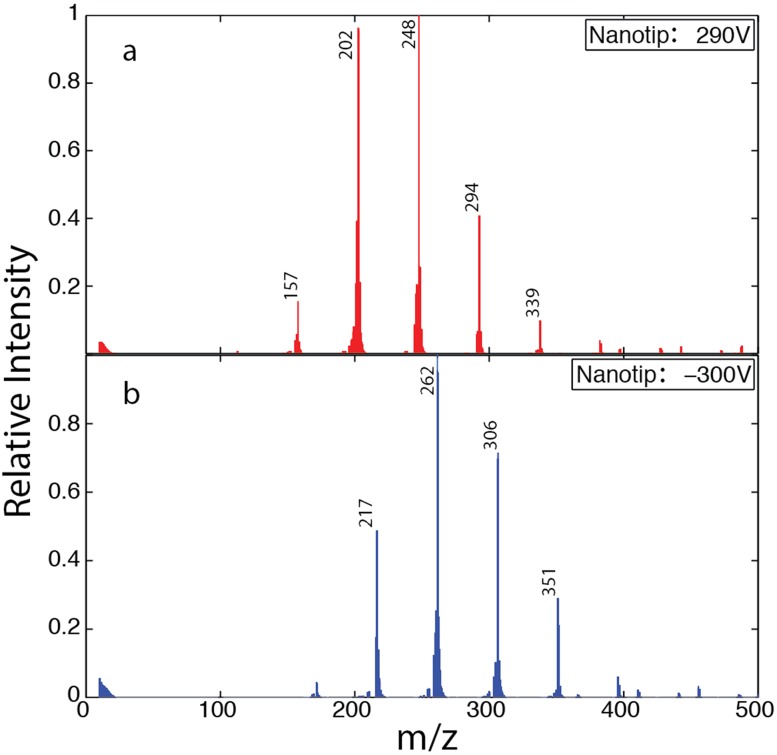
Figure 9 shows mass spectra of both negative and positive ions obtained from the same 2M solution of NaI in formamide using a glass capillary with an inner diameter of 295 nm and an outer diameter of 412 nm. The negative ion spectrum was obtained by biasing the tip voltage to −300 V while keeping the extractor electrode grounded. To obtain the positive ion spectrum, the tip was biased to a voltage of 290 V. In both cases, data were collected for 10 min. A 1.2 MHz RF oscillator with a mass range of 500 drove the mass filter.
FIG. 9.
Mass spectra acquired during successive experiments in (a) positive mode and then (b) in negative ion mode using the same tip filled with a 1M NaI solution in formamide. The total extraction voltage applied to the nanotip relative to the extractor L1 and the m/z values of the major peaks are indicated.
The mass spectra presented in Fig. 9 reproduce the main features of previous measurements of NaI in formamide by Chiu et al.32 and by Luedtke et al.33 The spectra show sequences of masses separated by 45, which is the molecular mass of formamide. The positive sequence corresponds to the mass of a sodium ion clustered with a small varying number of formamide molecules, while the negative sequence corresponds to the mass of an iodine ion clustered with formamide molecules. Since our mass spectrometer actually measures a mass to charge (m/z) ratio, multiply charged ion clusters would result in peak separations which are fractions of a formamide mass. The separation between peaks was consistently equal to the mass of a formamide molecule, which indicates that only singly charged ion species were produced.
The most prominent peaks in the spectra we measured correspond to the most stable ion clusters. Luedtke et al. previously used density functional theory calculations of ion-solvent cluster energetics to support their interpretation of similar mass spectra.33 The distribution of peak sizes in the mass spectra indicates a thermally activated ion emission process because the ion cluster abundances reflect their relative energetic stabilities. The mass spectra we measured are in good agreement with those of Luedtke et al., with similar distributions of ion clusters observed in both cases. The most abundant ion clusters in our measurements corresponded to one sodium ion clustered with 5 formamide molecules in positive mode, to one iodine ion clustered with 3 formamides in negative mode. By comparison, the most abundant sodium and iodine ion clusters in the measurements of Luedtke et al. had 4 and 2 formamide molecules, respectively. This close agreement indicates that the ions measured in our mass spectrometer were also produced by an ion evaporation process. We cannot exclude the possibility that charged droplets also emerged from our nanopore ion source because the instrument is insensitive to species with such large masses. Previous work with low volatility solvents including formamide,34 sulfolane,34 and propylene carbonate35 showed that nanodrops are produced together with solvated ions.
The narrow peaks in our spectra are indicative of a narrow ion energy distribution. We infer this because ions with large kinetic energies relative to the mean can pass through the quadrupole rather than being filtered out for a given mass acceptance window. Thus wide energy distributions tend to broaden peaks and can possibly create double peak artifacts,36 but we do not see these effects in our spectra. We also surmise that the distribution of ion energies was already narrow upon the ions’ emergence from the source because the high vacuum conditions guarantee that they travel ballistically from the source to the detector. These findings echo the literature on liquid metal and ionic liquid ion sources, where the ion energy has been well characterized and shown to be close to the emitter voltage.37,38 These similarities are remarkable, first because ionizing a minor species in a neutral solvent is a different physical process from emitting ions from a liquid metal or an ionic liquid and second because of the vastly different regimes of conductivity of those situations.
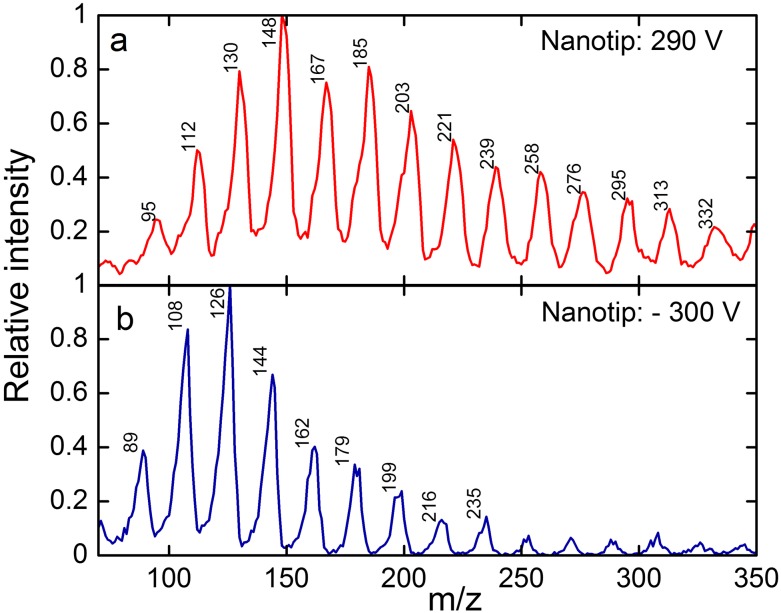
Notably, we have been able to obtain mass spectra from salt solutions in water. Figure 10 shows mass spectra obtained from 1M solutions of NaCl in DI water in negative and positive modes. A 440 kHz RF oscillator with a mass range of 4000 drove the mass filter in this experiment. The current emitted from the tip was less than 100 pA for the 1.5 h over which the mass data were recorded in positive ion mode and about 100 nA for the 0.5 h during which data were recorded in negative ion mode. The spectra show series of peaks corresponding to the masses of chloride and sodium ions clustered with a small number of water molecules.
FIG. 10.
Mass spectra acquired during successive experiments in (a) positive and then (b) negative ion modes using a single tip filled with a 1M solution of NaCl in water. The total extraction voltage applied to the nanotip relative to the extractor L1 and the m/z values of the major peaks are indicated.
There have been no previous reports of clean mass spectra obtained after evaporating ions directly from the surface of a volatile liquid like water. Previous attempts have mostly been met with problems like electrical arcing at the source and freezing of the liquid.17 The closest comparison to our measurements was from the Zolotoi group, who in 1980 reported EHD spectra from water. However, they reported only intermittent electrospray conditions and very complicated mass spectra.18,19
The mass peaks in Fig. 10 are broader than the ones measured in formamide, and there is a hint of a shoulder to the left of the peaks. These features are probably consequences of the lower oscillator frequency used in this experiment, possibly in combination with a higher kinetic energy of the ions. Peak broadening and peak splitting are known to occur when ions pass through the quadrupole before the oscillator can complete a sufficient number of cycles.39
C. Mass spectra of organic molecules
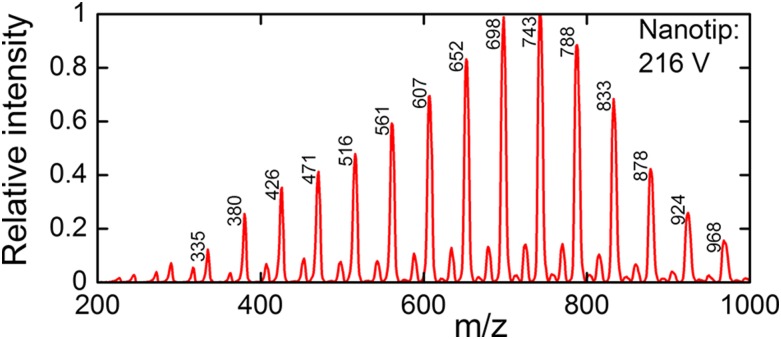
The nanopore mass spectrometer is capable of analyzing DNA bases. Figure 11 shows a mass spectrum from 100 mM cytosine and 50 mM acetic acid in formamide. The acetic acid was added in order to turn more cytosine bases into cations in solution. The capillary used in this experiment had an outer diameter of 256 nm and an inner diameter of 100 nm. A 440 kHz RF oscillator with a mass range of 4000 drove the mass filter in this experiment. We held the tip at 201 V and the total extraction voltage between the tip and the extractor at 216 V. The ion current from the source was about 0.8 nA. The mass data presented in Fig. 11 were collected over 3 h, but the spectrum was well resolved after only 10 min. The mass spectrum clearly shows cytosine ions clustered with a varying number of formamide molecules; the most abundant cluster has 14 formamides. A minor sequence of peaks seen in between the cytosine sequence is consistent with singly ionized formamide clusters.
FIG. 11.
A mass spectrum acquired from 100 mM cytosine in formamide with 50 mM acetic acid. The total extraction voltage applied to the nanotip relative to the extractor L1 and the m/z values of the major peaks are indicated.
The multiplicity of solvated states of ions emerging from the source complicate the interpretation of mass spectra and pose a challenge to our sequencing idea. The greater the number of solvent adducts carried by ionized monomers, the greater will be the chances for degeneracies in masses of the clusters resulting in errors or indeterminacy in a molecular sequence determination. Future work should focus on developing methods for reducing the dispersion in the number of solvent molecules that accompany a monomer into vacuum. Those methods must not come at the price of scrambling the order or monomers, however. The ideal situation would be for each ionized monomer to emerge from liquid into vacuum without any solvent molecules attached.
Important potential advantages of a nanopore ion source with a narrow distribution of energies include the possibilities of suppressing the formation of charged nanodrops and of collecting and detecting the ions with high efficiency. The low emission currents measured in our experiments hint at these tantalizing possibilities. However, arriving at strong conclusions on these questions will require dedicated studies to measure the full distribution of charged species, the distribution of ion energies, and the ion collection efficiency for a nanopore ion source.
ACKNOWLEDGMENTS
We thank Peter Weber, Carthene Bazemore-Walker, Layne Frechette, Ellen Goldberg, Luke McNeill, and Spike Willcocks for useful discussions. Research reported in this paper was supported by Oxford Nanopore Technologies, Ltd. and by NHGRI of the National Institutes of Health under Award No. R21HG005100. The content is solely the responsibility of the authors and does not necessarily represent the official views of the National Institutes of Health. D.S. declares a financial relationship with Oxford Nanopore Technologies, Ltd.
REFERENCES
- 1.Dekker C., Nat. Nanotechnol. 2, 209 (2007). 10.1038/nnano.2007.27 [DOI] [PubMed] [Google Scholar]
- 2.Cole R. B., J. Mass Spectrom. 35, 763 (2000). [DOI] [PubMed] [Google Scholar]
- 3.Iribarne J. V. and Thomson B. A., J. Chem. Phys. 64, 2287 (1976). 10.1063/1.432536 [DOI] [Google Scholar]
- 4.Gamero-Castaño M. and Fernandez de la Mora J., J. Chem. Phys. 113, 815 (2000). 10.1063/1.481857 [DOI] [PubMed] [Google Scholar]
- 5.Dole M., J. Chem. Phys. 49, 2240 (1968). 10.1063/1.1670391 [DOI] [Google Scholar]
- 6.Kebarle P., J. Mass Spectrom. 35, 804 (2000). [DOI] [PubMed] [Google Scholar]
- 7.Kebarle P. and Verkerk U. H., Mass Spectrom. Rev. 28, 898 (2009). 10.1002/mas.20247 [DOI] [PubMed] [Google Scholar]
- 8.Fernandez de la Mora J., Anal. Chim. Acta 406, 93 (2000). 10.1016/s0003-2670(99)00601-7 [DOI] [Google Scholar]
- 9.Maulbetsch W., Wiener B., Poole W., Bush J., and Stein D., Phys. Rev. Appl. 6, 054006 (2016). 10.1103/physrevapplied.6.054006 [DOI] [Google Scholar]
- 10.Swatik D. S. and Hendricks C., AIAA J. 6, 1596 (1968). 10.2514/3.4822 [DOI] [Google Scholar]
- 11.Hendricks C. and Swatik D., Astronaut. Acta 18, 295 (1973). [Google Scholar]
- 12.Prewett P. and Jefferies D., J. Phys. D: Appl. Phys. 13, 1747 (1980). 10.1088/0022-3727/13/9/024 [DOI] [Google Scholar]
- 13.Mair G. and Forbes R., J. Phys. D: Appl. Phys. 24, 2217 (1991). 10.1088/0022-3727/24/12/014 [DOI] [Google Scholar]
- 14.Stimpson B. P. and Evans C. A., Biol. Mass Spectrom. 5, 52 (1978). 10.1002/bms.1200050111 [DOI] [PubMed] [Google Scholar]
- 15.Stimpson B. P. and Evans C. A., J. Electrost. 5, 411 (1978). 10.1016/0304-3886(78)90034-7 [DOI] [Google Scholar]
- 16.Perez-Martinez C. and Lozano P., Appl. Phys. Lett. 107, 043501 (2015). 10.1063/1.4927481 [DOI] [Google Scholar]
- 17.Cook K. D., Mass Spectrom. Rev. 5, 467 (1986). 10.1002/mas.1280050404 [DOI] [Google Scholar]
- 18.Zolotoi N., Karpov G., Tal’roze V. et al. , Zh. Anal. Khim. 35, 1781 (1980). [Google Scholar]
- 19.Zolotoi N., Karpov G., and Skurat V., Theor. Exp. Chem. 24, 235 (1988). 10.1007/bf00531205 [DOI] [Google Scholar]
- 20.Wilm M. and Mann M., Anal. Chem. 68, 1 (1996). 10.1021/ac9509519 [DOI] [PubMed] [Google Scholar]
- 21.Juraschek R., Dulcks T., and Karas M., J. Am. Soc. Mass Spectrom. 10, 300 (1999). 10.1016/s1044-0305(98)00157-3 [DOI] [PubMed] [Google Scholar]
- 22.El-Faramawy A., Siu K. W. M., and Thomson B. A., J. Am. Soc. Mass Spectrom. 16, 1702 (2005). 10.1016/j.jasms.2005.06.011 [DOI] [PubMed] [Google Scholar]
- 23.Belov M. E., Gorshkov M. V., Udseth H. R., Anderson G. A., and Smith R. D., Anal. Chem. 72, 2271 (2000). 10.1021/ac991360b [DOI] [PubMed] [Google Scholar]
- 24.Gao D., Liu H., Jiang Y., and Lin J.-M., Lab Chip 13, 3309 (2013). 10.1039/c3lc50449b [DOI] [PubMed] [Google Scholar]
- 25.Feng X., Liu B.-F., Li J., and Liu X., Mass Spectrom. Rev. 34, 535 (2015). 10.1002/mas.21417 [DOI] [PubMed] [Google Scholar]
- 26.Oedit A., Vulto P., Ramautar R., Lindenburg P. W., and Hankemeier T., Curr. Opin. Biotechnol. 31, 79 (2015). 10.1016/j.copbio.2014.08.009 [DOI] [PubMed] [Google Scholar]
- 27.Wolf B., Handbook of Ion Sources (CRC Press, 1995). [Google Scholar]
- 28.Bulushev R. D., Steinbock L. J., Khlybov S., Steinbock J. F., Keyser U. F., and Radenovic A., Nano Lett. 14, 6606 (2014). 10.1021/nl503272r [DOI] [PubMed] [Google Scholar]
- 29.Storm A., Chen J., Ling X., Zandbergen H., and Dekker C., Nat. Mater. 2, 537 (2003). 10.1038/nmat941 [DOI] [PubMed] [Google Scholar]
- 30.Miller P. E. and Denton M. B., J. Chem. Educ. 63, 617 (1986). 10.1021/ed063p617 [DOI] [Google Scholar]
- 31.De La Mora J. F. and Loscertales I. G., J. Fluid Mech. 260, 155 (2006). 10.1017/s0022112094003472 [DOI] [Google Scholar]
- 32.Chiu Y.-H., Austin B. L., Dressler R. A., Levandier D., Murray P. T., Lozano P., and Martinez-Sanchez M., J. Propul. Power 21, 416 (2005). 10.2514/1.9690 [DOI] [Google Scholar]
- 33.Luedtke W., Landman U., Chiu Y.-H., Levandier D., Dressler R., Sok S., and Gordon M. S., J. Phys. Chem. A 112, 9628 (2008). 10.1021/jp804585y [DOI] [PubMed] [Google Scholar]
- 34.Alonso-Matilla R., Fernández-García J., Congdon H., and Fernández de la Mora J., J. Appl. Phys. 116, 224504 (2014). 10.1063/1.4901635 [DOI] [Google Scholar]
- 35.Guerrero I., Bocanegra R., Higuera F., and De La Mora J. F., J. Fluid Mech. 591, 437 (2007). 10.1017/s0022112007008348 [DOI] [Google Scholar]
- 36.Pedder R. E., Extrel Application Note RA_2011A, 1 (2002).
- 37.Marriott P., J. Phys. D: Appl. Phys. 19, L115 (1986). 10.1088/0022-3727/19/6/006 [DOI] [Google Scholar]
- 38.Romero-Sanz I., Bocanegra R., Fernandez de la Mora J., and Gamero-Castaño M., J. Appl. Phys. 94, 3599 (2003). 10.1063/1.1598281 [DOI] [Google Scholar]
- 39.Pedder R. E., Schaeffer R. A., E.C.M. SLP, and Drive E., Extrel Application Note RA_2003B, 1 (1996).


