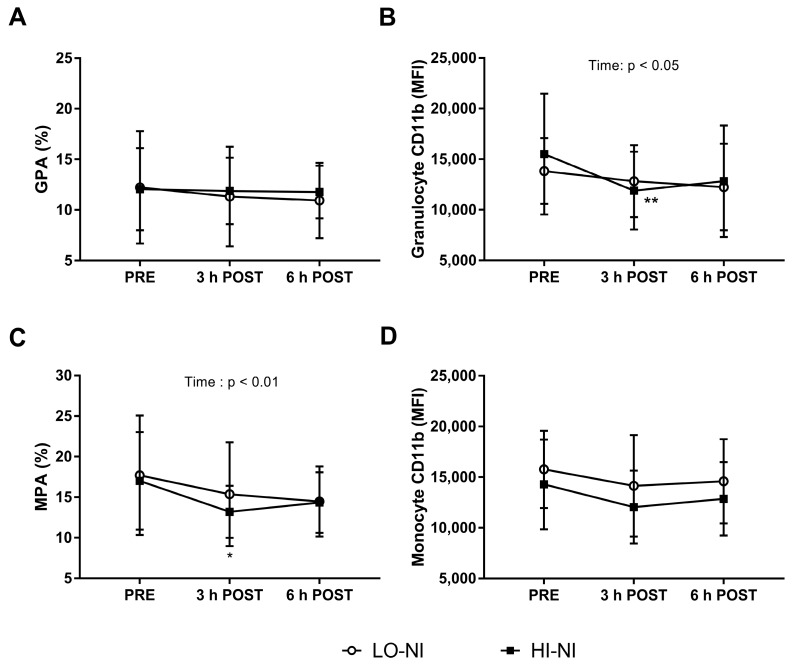
Figure 4.
Leukocyte flow cytometry analysis of: blood granulocytes (A,B); and monocytes (C,D). Percentage (%): CD16+CD14− granulocyte-platelet aggregates (GPA) (A); and CD14+ monocyte-platelet aggregates (MPA) (C). Relative expression of Mac-1/αM integrin (CD11b+) on: granulocytes (B); and monocytes (D), shown as median fluorescence intensity (MFI). Data expressed as mean ± standard deviation (SD), n = 12. Two-way ANOVA demonstrated a main effect of time and over the 0, 3 and 6 h time-course for MPA (p < 0.05) and granulocyte MFI (p < 0.01), with * significant (p < 0.05) and ** significant (p < 0.01) changes compared to pre-ingestion baseline (PRE) using Bonferroni’s post hoc analysis.

