

Abstract
As the enhanced permeation and retention (EPR) effect continues to be a controversial topic in nanomedicine, we sought to examine EPR as a function of nanoparticle size, tumor model, and tumor location, while also evaluating tumors for EPR mediating factors such as microvessel density, vascular permeability, lymphatics, stromal content, and tumor-associated immune cells. Tumor accumulation was evaluated for 55 × 60, 80 × 180, and 80 × 320 nm PRINT particles in four subcutaneous flank tumor models (SKOV3 human ovarian, 344SQ murine nonsmall cell lung, A549 human nonsmall cell lung, and A431 human epidermoid cancer). Each tumor model revealed specific particle accumulation trends with evident particle size dependence. Immuno-histochemistry staining revealed differences in tumor microvessel densities that correlated with overall tumor accumulation. Immunofluorescence images displayed size-mediated tumor penetration with signal from the larger particles concentrated close to the blood vessels, while signal from the smaller particle was observed throughout the tissue. Differences were also observed for the 55 × 60 nm particle tumor penetration across flank tumor models as a function of stromal content. The 55 × 60 nm particles were further evaluated in three orthotopic, metastatic tumor models (344SQ, A549, and SKOV3), revealing preferential accumulation in primary tumors and metastases over healthy tissue. Moreover, we observed higher tumor accumulation in the orthotopic lung cancer models than in the flank lung cancer models, whereas tumor accumulation was constant for both orthotopic and flank ovarian cancer models, further demonstrating the variability in the EPR effect as a function of tumor model and location.
Keywords: Nanoparticles, PRINT, tumor accumulation, tumor model, tumor histology
Graphical abstract

Cancerous tissue undergoes rapid angiogenesis yielding poorly organized, nonuniform, and chaotic vasculature, producing irregular blood flow throughout the tumor mass. Leaky vasculature coupled with poor lymphatic drainage, allows for large macromolecules and nanoparticles to extravasate from the tumor vasculature and remain within the tumor mass.1 This phenomenon, known as the enhanced permeability and retention (EPR) effect, is highly heterogeneous within and across tumor models and is dependent on the unique properties of the specific cancer: tumor type, location, and mass size.2–6 Simultaneously, these attributes lead to major differences in macromolecular and nanoparticle accumulation and penetration, putting up a potential barrier for clinical translation.
The degree of EPR, and thus nanoparticle tumor accumulation, can fluctuate drastically due to heterogeneity of intratumoral blood flow, vascular permeability, stromal content, presence/absence of a functional lymphatic network, and level of interstitial pressure.2,7–11 Other mediating factors include tumor-associated immune cells and the mononuclear phagocyte system (MPS) activity, which fluctuate from cancer to cancer, affecting particle circulation profiles, and tumor accumulation.3 It has also been noted that tumor-associated macrophages (TAMs) can influence particulate transport and drug release.12,13 Perhaps the most important factor influencing particle tumor accumulation is the pore size of the leaky tumor vasculature, which differs greatly within and across tumor models, making it difficult to define an optimal particle size/shape.14,15 In general, a consensus in literature exists that decreasing carrier size (while staying above the limit for renal clearance) will improve tumor deposition.11,16–19
While reducing particle size is generally considered advantageous, tumor deposition and overall performance of the carrier varies throughout literature due to the heterogeneity of nanoparticle systems and disease models investigated.20 In an effort to compare how nanoparticle parameters impact tumor accumulation and penetration, we have compiled data (Table 1) from the literature spanning multiple particle matrices, as well as particle sizes and shapes and tumor models. Upon the basis of this compilation, nanoparticles with enhanced circulation half-lives resulted in higher tumor accumulation, smaller nanoparticles displayed enhanced tumor extravasation/penetration, and tumor models play a major role in both tumor accumulation and extravasation of nanoparticles.8–11,16–19 These results illustrate the complicated nature of particle tumor deposition, highlighting how imperative it is to exhaustively evaluate not only the particle, but also the tumor models, such that tumor characteristics that favor nanoparticle accumulation can be identified to help establish guidelines for determining which cancers/patients could benefit from nanoparticle therapeutics.
Table 1.
Comparing Particulate Tumor Accumulation, Extravasation, and Circulation Profiles as a Function of Particle Matrix, Shape, and Sizea
| matrix | shape | size (nm) | tumor model | type of cancer | accumulation | extravasation | circulation | ref |
|---|---|---|---|---|---|---|---|---|
| QD | NS | 12, 20, 60, 120 | Mu89 | melanoma | N/A | 12 > 60 > 120 | 12 > 60 > 120 | 18 |
| gold | NS | 20, 40, 60, 80, 100 | MDA-MB-435 | melanoma/breast | 60 > 80 > 100 > 40 > 20 | 20 > 60 > 100 | 60 > 80 > 100 > 40 > 20 | 16 |
| gold | NS | 15, 30, 60, 100 | MDA-MB-435 | melanoma/breast | 15 > 30 > 60 > 100 | 15 > 30 > 60 > 100 | 15 > 30 > 60 > 100 | 19 |
| gold | NS | 50, 100 | MCF-7 | breast | 50 > 100 | NA | 50 > 100 | 17 |
| polymer | NS | 30, 50, 70, 100 | C26 BxP3 |
colon pancreatic |
All sizes Same 30 > 50 > 70 = 100 |
30 > 70 | NA | 8 |
| polymer | NS | 10 | CT26 BXP3 |
colon pancreatic |
CT26 > BXP3 | NA | NA | 10 |
| gold | NS,NR,ND,NC | ~50 | EMT6 | breast | NS > NC > ND > NR | NC = NR > NS = ND | NS > NC> ND > NR | 22 |
| QD | NS | 35 | EO771 | breast | NR > NS | NA | NR = NS | 37 |
| SWCNT | NR | 15 × 54 | ||||||
| QD | NS | 25 | U87MG | brain | NR > NS | NR > NS | NR > NS | 9 |
| SWCNT | NR | 3 × 200 | SKOV3 LS174T |
ovarian colon |
NR = NS NS > NR |
NS = NR NS > NR |
||
| polymer | NS | 110, 141, 166 | HT29 A2780 |
colon ovarian |
111 = 141 > 166(br)111 > 141 > 166 | NA | NA | 11 |
QD, quantum dot; SWCNT, single walled carbon nanotube; NS, nanosphere; NR, nanorod; ND, nanodisk, NC; nanocage, NA, not available.
To this aim, we investigated tumor accumulation and penetration as a function of nanoparticle size, cancer cell type, and tumor location, while also characterizing tumors for EPR mediating factors such as microvessel density, vascular permeability, lymphatics, stromal content, and tumor associated macrophages. Utilizing PRINT, three distinct nanoparticle sizes were manufactured: 55 nm × 55 nm × 60 nm (55 × 60 nm), 80 nm × 80 nm × 180 nm (80 × 180 nm), and 80 nm × 80 nm × 320 nm (80 × 320 nm). All particles were densely coated with PEG postfabrication. In vitro, there was no discernible difference in cellular interaction between the nanoparticle types. In vivo, biodistribution and blood pharmacokinetic profiles were statistically similar among all three NPs in nude mice. Administration of PRINT NPs into four different subcutaneous murine tumor models showed dramatically different tumor accumulation between the different tumor models with evident particle size dependence. Immuno-histochemistry (IHC) staining revealed distinct differences in tumor microvessel densities that seemed to correspond with overall tumor deposition. Finally, three orthotopic, metastatic tumor models (344SQ, A549, and SKOV3) were evaluated revealing equivalent if not higher accumulation in metastatic lesions over primary tumors. Overall, tumor accumulation was observed to vary dramatically with particle size, cancer cell line, and tumor location.
Nanoparticles were fabricated on a continuous roll-to-roll lab line utilizing PRINT technology. Particle composition was comprised of PEG acrylate monomers and an amine terminated monomer (aminoethyl methacrylate) allowing for facile surface modifications through NHS (N-hydroxysuccinimide) chemistry. Particles of three different sizes/shapes were fabricated: 55 × 60, 80 × 180, and 80 × 320 nm (Figure 1a). It is well-known that surface PEG density can play an important role in determining particle fate in vivo.21 To this end, following reported protocols, particle surface amines were reacted with methoxy-terminated PEG-succinimidyl carboxy methyl ester, surface PEG densities were calculated across all particle sizes/shapes and were held constant at ~0.09 PEG/nm2 (details available in Supporting Information, Figure S1), and particle PEGylation was followed by acetylation of the remaining amines.21 After surface PEGylation and acetylation, particles were negatively charged and remained fairly monodisperse as shown by the negative zeta potential and narrow polydispersity index (PdI) values shown in Table 2. Because the hydrogel PRINT particles are rod-shaped and swell in water, the reported size determined by dynamic light scattering is a qualitative assessment of the particles and represents the diameter of a sphere with the same translational diffusion speed as the nonspherical particles.
Figure 1.

Particle characterization through scanning electron microscopy (scale bar represents 1 μm) (a) in vivo blood concentration versus time profiles (b) and biodistribution of 55 × 60, 80 × 180, and 80 × 320 nm PRINT particles in healthy mice, 24 h postinjection of 60 mg/kg (c), error bars represent standard deviation (N = 4). The percentage of recovered fluorescence per gram of tissue for each organ was calculated by dividing collected fluorescence from each tissue by the total sum fluorescence of all excised tissues for each individual mouse.
Table 2.
Particle Characterization by Dynamic Light Scattering and Blood Pharmacokinetics
| 55 × 60 nm | 80 × 180 nm | 80 × 320 nm | |
|---|---|---|---|
| Z-avg (nm) | 126 ± 4 | 184 ± 4 | 257 ± 5 |
| PdI | 0.09 ± 0.01 | 0.07 ± 0.01 | 0.01 ± 0.01 |
| ZP (mV) | −19 ± 1 | −20 ± 1 | −23 ± 1 |
| t1/2 α (h) | 4.0 ± 4.4 | 7.7 ± 3.1 | 4.5 ± 1.9 |
| t1/2 β (h) | 12.8 ± 1.4 | 14.7 ± 2.9 | 20.3 ± 7.3 |
| Vd (mL) | 1.4 ± 0.1 | 1.3 ± 0.1 | 1.3 ± 0.2 |
| CL (mL/h) | 0.08 ± 0.01 | 0.09 ± 0.02 | 0.08 ± 0.01 |
| AUC0−t (mg/mL·h) | 15.4 ± 1.9 | 14.3 ± 3.0 | 14.6 ± 1.3 |
Extending circulation time of nanobased drug delivery systems upon intravenous (iv) administration is an important factor facilitating accumulation in cancerous tissue. By improving blood retention, particulate drug systems have a greater probability of permeating into the porous and hypervascularized neoplastic tissue. In previous accounts (Table 1), nanoparticle size has been closely attributed to unique blood pharmacokinetic profiles with smaller particulates extending blood retention.16–19 In addition, particle size is widely noted as the most dominant parameter improving solid tumor accumulation and penetration (Table 1).8,11,16–19 The intertwined relationship of nanoparticle size, blood PK, and tumor accumulation complicates the ability to determine which factors lead to improved nanoparticle tumor delivery. Because of this complicated relationship, we conducted blood pharmacokinetic studies with fluorescently labeled, PEGylated PRINT NPs of three distinct sizes: 80 × 320, 80 × 180, and 55 × 60 nm in nontumor bearing Foxn1nu mice (dosed with 60 mg/kg of each NP type). Unlike previous literature results listed in Table 1,9,16–19,22 blood pharmacokinetic profiles of the three NP types displayed no statistically significant differences in PK behavior (Figure 1b). Key pharmacokinetic parameters for different NP sizes such as circulation half-life (t1/2 β), volume of distribution (Vd), and area-under-curve (AUC) all fell within statistically similar values of approximately 13–20 h, ~1.3 mL, and 15 mg/mL·h, respectively (Table 2). These results indicate that any differences in tumor accumulation can be attributed to particle size and not differences in pharmacokinetic behavior. Furthermore, biodistribution analysis was conducted at 24 h post NP injection. Organs were resected, weighed, and analyzed for fluorescence. Nanoparticle organ accumulation is displayed as percent recovered fluorescence per gram of tissue, which was determined by dividing the collected fluorescence from each tissue by the total sum fluorescence of all excised tissues for each individual mouse. The results revealed similar deposition between primary tissues associated with nanoparticle clearance for all NP types (Figure 1c) with slight variations observed within the lung and kidneys.
While blood pharmacokinetic profile and biodistribution of the three different sized PRINT hydrogels were similar, it was of interest to validate in vitro behavior. In previous accounts, cellular interactions with nanoparticles were heavily influenced by particle shape and size.23 It was reported that high aspect ratio nanoparticles were internalized at a faster rate in HeLa cells.23 We therefore wanted to assess target (cancer) and nontarget (macrophage) cell interactions with the three particle sizes/shapes. We observed no trend across the cancer cell lines, and after a 24 h incubation period with NPs all nanoparticle sizes were poorly associated with the cancer cell lines of interest and displayed low cellular uptake (Figure S2). As expected, the phagocytic uptake by alveolar murine macrophage (MH-S) of all three nanoparticles types was approximately 20–30% association after 24 h which is similar to our previous report for PEGylated 80 × 320 nm particles.21
In an effort to validate the impact of various PRINT NPs toward solid tumor delivery, we analyzed accumulation in several murine subcutaneous flank tumor models. While flank tumor models are hardly predictive for the human diseased condition, they are frequently used in nanoparticle drug delivery literature as a primary screen due to ease of use and rapid growth. The aims of these studies were to determine how NP accumulation varied across different flank tumor models and how these findings compared to orthotopic cancer models, which more closely resemble the morphology, microenvironment, and metastatic patterns of human cancer.24,25
Foxn1nu mice were injected subcutaneously in the right flank with either A549 (human nonsmall cell lung cancer cells), A431 (human epidermoid cancer cells), SKOV3 (human ovarian cancer cells), or 344SQ (murine nonsmall cell lung cancer cells). It is documented that tumor size can also influence EPR, so throughout these experiments we held tumor size constant at approximately 100 mm3.5,6 When flank tumors reached 100 mm3, mice were injected (tail vein) with 60 mg/kg of 80 × 320, 80 × 180, or 55 × 60 nm fluorescently labeled PRINT particles. Particle biodistribution was assessed 24 h post NP injections via organ resection and fluorescent imaging. Upon fluorescence analysis, it was evident that both nanoparticle size and xenograft model had dramatic effects on overall accumulation in the solid flank tumors (Figure 2A). The tumor exposure of the 55 × 60 nm particle was greater than all other particle types in the A431, SKOV3, and 344SQ flank tumor models. Interestingly, in the A549 flank tumor model, the 55 × 60 and 80 × 180 nm particles tumor exposure were similar and greater than 80 × 320 nm particle. In most cases, a positive correlation existed between reductions in NP size and flank tumor accumulation; however, it is currently unknown whether pore cutoff size in the tumor vasculature is the main driver of this observation. At 24 h post NP injections, three of the four flank models (SKOV3, A431, and A549) had tumor accumulation ranging from approximately 3–15% recovered fluorescent dose, depending on the NP type, yet the 344SQ tumor model yielded significantly increased accumulation, ranging between ~15–38% recovered fluorescent dose. Biodistribution to organs in flank tumor-bearing mice displayed similar distributions throughout the four models with slight variations in spleen and liver delivery (Figure S3). It is reasonable to assume that alterations in biodistribution between tumor models can in part be attributed to differences in the tumor depot, as biodistribution in nontumor bearing mice was statistically similar.
Figure 2.

Nanoparticle accumulation and immunohistochemistry analysis of flank tumors. Flank tumor accumulation of PRINT particles of various sizes and shapes was evaluated at 24 h postinjection at 60 mg/kg, data displayed as percent recovered fluorescence per gram of tissue (a). Vascularization of the cancerous tissue was identified with a CD-31 marker, and microvessel density was determined as the total number of blood vessels divided by tumor area (b). H-scores for each marker per tumor model were also quantitated (c) lymphatic vessels identified with Lyve1, tumor-associated macrophage identified with F4/80, collagen identified with Collagen IV, and vascular endothelial growth factor identified with VEGF. Error bars represent standard devation (N = 4), analyzed by one-way ANOVA followed by Tukey’s multiple comparison test; **P < 0.01, ***P < 0.001, ****P < 0.0001.
Upon resection of flank tumors (from mice not treated with nanoparticles), differences in tumor appearance and H&E stains were noted (Figures S4 and S5). Immunohistochemistry staining was conducted to determine variance in biomarkers for EPR mediating factors such as blood vessels (CD31 marker), stroma (Collagen IV marker), tumor associated macrophages (F4/80 marker), vasculature permeability (VEGF marker), and lymphatics (Lyve-1 marker). Immunofluorescence imaging of sectioned tumors (from mice treated with nanoparticles) was used to further evaluate the distribution of fluorescently labeled particles throughout the tumor relative to blood vessels (CD31 marker).
Quantitative analysis of microvessel densities revealed that the 344SQ tumors had the highest microvessel density, followed by SKOV3, A431, and A549 tumors (Figure 2b). The microvessel density correlated well with overall flank tumor deposition of NPs. This is in agreement with the report that tumors with high angiogenic activity are expected to have more permeable blood vessels, resulting in higher intratumoral deposition of nanocarriers.4
Furthermore, this is partially consistent with the observation that faster tumor growth rate resulted in higher particle accumulation.4 The 344SQ flank tumors reached 100 mm3 within 1.5 weeks, followed by A431 (3.5 weeks), SKOV3 (7 weeks), and A549 (8 weeks). Other histological differences were observed for the expression of collagen and TAMS across the tumor models. Both lung cancer models (A549 and 344SQ) exhibited the highest expression of collagen and TAMs, followed by the SKOV3 and A431 models (Figure 2c). We observed no difference across tumor models for the level of permeability (VEGF) or lymphatics (Lyve-1) (Figure 2c).
Immunofluorescence imaging of the sectioned A549 tissue was conducted in an effort to visualize particle size-dependent intratumoral distribution relative to the location of blood vessels (Figure 3a). Interestingly, based on fluorescence imaging of the entire flank tumor, this model exhibited statistically similar recovered fluorescence in the tumor for both the 55 × 60 and 80 × 180 nm particles (Figure 2a). However, evaluation of the intratumoral microdistribution of the particles (Figure 3a) revealed that the 80 × 180 nm particles behaved more like the 80 × 320 nm particles with particle signal (red) concentrated close to blood vessels (green). Whereas high particle signal (red) on the blood vessel periphery as well as diffuse signal within the tumor mass was observed for the 55 × 60 nm particles (Figure 3a). Furthermore, we compared 55 × 60 nm particle distribution throughout the four flank tumor models (Figure 3b). Throughout literature there is a consensus that elevated tumor stromal content represents a barrier to particle penetration.8,12,26–28 In line with the literature reports, we observed aggregates of particle fluorescence around the blood vessels and limited diffuse particle signal throughout the tumor tissue in both the A549 and 344SQ models (Figure 3b), which were characterized by having high collagen, a marker for stromal content (Figure 2c). The SKOV3 and A431 models had less stromal content, and as expected we saw more diffuse signal throughout the tissue (Figure 3b).
Figure 3.

Tumor microdistribution of fluorescently labeled particles of varying sizes in A549 tumors (a) and 55 × 60 nm PRINT particles in various flank tumors (b). Particles were labeled with dylight 680 (red), blood vessels were marked with fluorescently labeled CD31 antibody (green). Scale bars are all 100 μm.
Assessment of drug or drug carrier performance in clinically relevant animal models is imperative to ascertain potential successes in the clinic. While there are obvious limitations translating discoveries from mice to humans, there are certain mouse models that better reflect human cancer pathology.29 To this end we assessed particle (55 × 60 nm) deposition within three different metastatic orthotopic mouse models, two human xenograft models in immune compromised nude mice (A549 and SKOV3), and one syngeneic model (344SQ) in immune competent SvJ mice.
For the two orthotopic lung cancer models (344SQ and A549), tumor cells were injected directly into the left mouse lung; the orthotopic ovarian cancer model (SKOV3) was developed by injecting tumor cells into the peritoneal cavity of the mice. In the lung models, the formation of primary tumors at the injection site was observed, along with significant metastases. The A549 model was more metastatic and spread not only to the lymph nodes but also to the pleural cavity and chest wall, whereas only lymph node metastases were observed in the 344SQ model (Figure 4). Fluorescent images display in a compelling fashion dramatic particle accumulation in the diseased sites as compared to the surrounding healthy lung tissue (Figure 4). The orthotopic ovarian model resulted in a large solid tumor mass in the intraperitoneal cavity and liver metastases (Figure S6). Again, particle distribution was observed at different extents in each orthotopic model with the 344SQ tumors maintaining the highest recovered fluorescent dose at 24 h post NP injection (Figure 5a). Furthermore, particle distribution in the three orthotopic models did not necessarily reflect what was previously observed in the flank xenograft models. Most notably, the drastic variance in the A549 cell-line, where we observed a 5-fold increase in recovered fluorescence in the orthotopic model (34 ± 13%) over the flank model (7 ± 2%) (Figure 5a). Interestingly, particles accumulated to the same extent in the A549 primary orthotopic tumors (8 ± 2% recovered fluorescent dose) as they did in the flank tumors (7 ± 2% recovered fluorescent dose) (Figure 5b), however, the summation of particle accumulation in the metastatic tumors (lymph node, chest wall, and pleural cavity) resulted in approximately 30% recovered fluorescence, boosting the overall particle accumulation in the orthotopic model to approximately 40% recovered fluorescent dose (Figure 5a). One possible explanation for this change in accumulation is the size of the tumors, as higher particle accumulation has been previously documented in smaller tumors (less than 100 mg).30 In this orthotopic A549 tumor model, the tumors that formed within the pleural cavity, chest wall, and lymph nodes were small with the total mass of the tumors approximating 60, 70, and 20 mg, respectively. The increased number of tumors also resulted in more potential nanoparticle “sinks” and consequently higher tumor accumulation overall. Another possible explanation could be the change in vascular perfusion and blood vessel functionality as Graves and colleges recently documented that the vasculature formed by A549 tumors in the lung was more functional than those formed by the same tumor cells grown subcutaneously.31 These same arguments can be used for the orthotopic 344SQ model, whereas we observed 37 ± 8% recovered fluorescent dose in the flank model (Figure 5a) and similar accumulation in the primary lung tumors (23 ± 7% recovered fluorescent dose) (Figure 5c). However, due to the added “sink” of the lymphatic metastasis (resulting in 31 ± 13% recovered fluorescent dose), the overall particle accumulation in the orthotopic model was boosted to approximately 50% recovered fluorescent dose (Figure 5a). There was no significant difference between tumor accumulation in the flank and orthotopic SKOV3 tumors. This could be due to the overall size and number of tumors, as the intraperitoneal tumor formed a large mass rather than a cluster of small tumors (Figure S6). For this case, we observed approximately 7 ± 3% recovered fluorescent dose in the solid IP tumors with an additional 11 ± 4% recovered dose from the liver metastasis, elevating the overall recovered fluorescent dose in the orthotopic model to approximately 20% (Figure 5a,d). Complete organ biodistribution in each orthotopic model can be found in Supporting Information (Figure S7).
Figure 4.
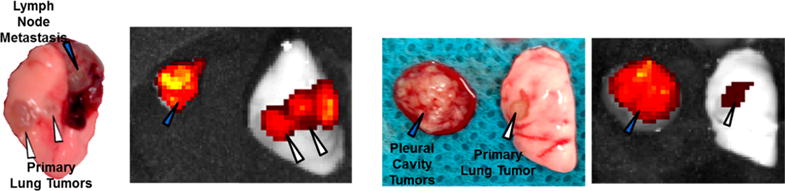
Photograph and fluorescence images of orthotopic 344SQ (left two) and A549 (right two) tumors treated with fluorescently labeled 55 × 60 nm PRINT particles, indicating preferential accumulation of particles in diseased tissue. White triangles indicate primary tumors, and blue triangles indicate metastasis.
Figure 5.

IVIS analysis of fluorescently labeled 55 × 60 nm PRINT particles (24 h post injection) in primary and metastatic disease sites throughout the three orthotopic mouse models. (a) Comparison of orthotopic and flank tumor accumulation, (b) accumulation in primary and metastatic A549 tumors, (c) accumulation in primary and metastatic 344SQ tumors, (d) accumulation in primary and metastatic SKOV3. Error bars represent standard deviation (N = 4), analyzed by one-way ANOVA followed by Tukey’s multiple comparison test; *P < 0.05, **P < 0.01.
In summary, our study provides new insights into how nanoparticle tumor delivery is highly dependent on nanoparticle size, tumor model, and tumor location, emphasizing the heterogeneity of the EPR effect across tumor models and tumor locations. We utilized three distinctly sized PRINT hydrogels (80 × 320, 80 × 180, and 55 × 60 nm), yet having similar blood pharmacokinetic behaviors, to investigate the impact of particle size on tumor accumulation and penetration in four murine subcutaneous flank tumor models and three orthotopic tumor models. We observed vastly different accumulation among the different particle types and tumor models. In agreement with literature reports, the smallest particle accumulated to the highest extent.8,17,19 Nanoparticle accumulation in tumors correlated with tumor microvessel density, while NP penetration within tumors was mainly influenced by the stromal content in each tumor model. Perhaps of most importance was the investigation of metastatic, orthotopic tumor models, revealing significant accumulation of 55 × 60 nm particles in both primary and metastatic sites. For all metastatic orthotopic models we observed equal if not higher nanoparticle accumulation in the metastatic lesions versus the primary tumors. Overall tumor accumulation in the orthotopic lung cancer models was higher than the flank lung cancer models, further establishing that flank lung cancer models are not predictive for tumors grown in the lung. However, tumor accumulation was constant for both orthotopic and flank ovarian cancer models. These results demonstrate the variability in the EPR effect as a function of both tumor model and location. While other researchers have compared tumor accumulation as a function of nanoparticle size, or across tumor models, to our knowledge we are the first to evaluate the effect of nanoparticle size, tumor model, and tumor location. As the EPR effect has become a controversial issue in cancer NP drug development, it is important to understand and determine the tumor characteristics that lead to enhanced NP accumulation, and based upon Miller’s recent findings NP tumor accumulation can be used predict efficacy of therapeutic nanoparticles.32 To this end, we observed that our smallest nanoparticle had the highest tumor accumulation, however it is yet to be determined how this will translate when a therapeutic cargo is incorporated, as the smaller particles incorporate less payload. Furthermore, we have determined that tumor location, blood vessel density, and stromal content are of the major characteristics that impact nanoparticle tumor accumulation and penetration, and potentially the efficacy of nanoparticle agents. For example, the 344SQ tumor model had the highest microvessel density and nanoparticle tumor accumulation but also had a high level of collagen, effectively sequestering the particles close to the blood vessels and preventing particle penetration into the tumor. Investigations are ongoing to determine if this finding will limit the NPs therapeutic effect. We also observed different levels of TAMS across tumor models; although these levels did not directly correlate with either nanoparticle tumor accumulation or penetration, there is literature to suggest that they will play a large role in nanoparticle drug delivery,13 while also giving us secondary targets for immunomodulation.33,34 As many in the scientific community have noted, determining factors that improve nanoparticle tumor accumulation are only “a piece of a complex puzzle”.35,36 Future investigations will continue to instruct the scientific community on the role of particle size, drug loading/release, and tumor physiology in achieving therapeutic efficacy. These types of studies, combined with patient biopsy-based information, could lead to the identification of additional parameters that will allow for the preselection of patients that would likely benefit from nanomedicine therapy, therefore improving the performance of nanomedicines in the clinic.
Supplementary Material
Acknowledgments
We thank Dr. Ashish Pandya for the synthesis of HP4A, and the University of North Carolina Animal Studies Core, specifically Charlene Santos and Mark Ross for their assistance with all animal studies. Additionally, we thank Liquidia Technologies for providing PRINT molds used in the fabrication of our nanoparticles, and the Translational Pathology Lab, specifically Nana Feinberg and Yonjuan Xia for their help with immunohistochemistry and immunofluorescence samples.
Funding
This work has been supported by the University Cancer Research Fund and the Carolina Center for Cancer Nanotechnology Excellence (U54CA151652 and U54CA198999).
ABBREVIATIONS
particle replication in nonwetting templates
- NP
nanoparticle
- EPR
enhanced permeation and retention
- PEG
polyethylene glycol
- NHS
N-hydroxysuccinimide
- UV
ultraviolet
- IV
intravenous
- PK
pharmacokinetics
- AUC
area-under-curve
- IHC
immuno-histochemistry
- PDI
polydispersity index
- ZP
zeta potential
Footnotes
Supporting Information
The Supporting Information is available free of charge on the ACS Publications website at DOI: 10.1021/acs.nano-lett.7b00021.
Methods, surface PEG density across nanoparticle types, in vitro cell association of various NP types with murine macrophages (MH-S) and cancer cells, biodistribution determined via IVIS imaging of dye labeled PRINT NPs in tumor-bearing mice, photographs and H&E stains of resected flank tumors, representative photograph of orthotopic SKOV-3 tumors, biodistribution determined via IVIS imaging of dye labeled 5 × 60 nm particles in orthotopic tumor-bearing mice (PDF)
ORCID
Joseph M. DeSimone: 0000-0001-9521-5095
Author Contributions
The manuscript was written through contributions of all authors. All authors have given approval to the final version of the manuscript.
Notes
The authors declare the following competing financial interest(s): J.M.D. is a founder and maintains a financial interest in Liquidia Technologies. Liquidia was founded in 2004 to commercialize PRINT technology and other discoveries of Professor Joseph DeSimone and colleagues at the University of North Carolina, Chapel Hill.
References
- 1.Matsumura Y, Maeda H. Cancer Res. 1986;46:6387–6392. [PubMed] [Google Scholar]
- 2.Prabhakar U, Maeda H, Jain RK, Sevick-Muraca EM, Zamboni W, Farokhzad OC, Barry ST, Gabizon A, Grodzinski P, Blakey DC. Cancer Res. 2013;73:2412–2417. doi: 10.1158/0008-5472.CAN-12-4561. [DOI] [PMC free article] [PubMed] [Google Scholar]
- 3.Song G, Wu H, Yoshino K, Zamboni WC. J Liposome Res. 2012;22:177–192. doi: 10.3109/08982104.2012.655285. [DOI] [PubMed] [Google Scholar]
- 4.Karathanasis E, Chan L, Karumbaiah L, McNeeley K, D’Orsi CJ, Annapragada AV, Sechopoulos I, Bellamkonda RV. PLoS One. 2009;4:e5843. doi: 10.1371/journal.pone.0005843. [DOI] [PMC free article] [PubMed] [Google Scholar]
- 5.Xiao K, Luo J, Li Y, Xiao W, Lee JS, Gonik AM, Lam KS. Nanosci Nanotechnol Lett. 2010;2:79–85. [Google Scholar]
- 6.Duncan R, Sat-Klopsch Y-N, Burger AM, Bibby MC, Fiebig HH, Sausville EA. Cancer Chemother Pharmacol. 2013;72:417–427. doi: 10.1007/s00280-013-2209-7. [DOI] [PMC free article] [PubMed] [Google Scholar]
- 7.Lammers T, Kiessling F, Hennink WE, Storm GJ. Controlled Release. 2012;161:175–187. doi: 10.1016/j.jconrel.2011.09.063. [DOI] [PubMed] [Google Scholar]
- 8.Cabral H, Matsumoto Y, Mizuno K, Chen Q, Murakami M, Kimura M, Terada Y, Kano MR, Miyazono K, Uesaka M, Nishiyama N, Kataoka K. Nat Nanotechnol. 2011;6:815–823. doi: 10.1038/nnano.2011.166. [DOI] [PubMed] [Google Scholar]
- 9.Smith BR, Kempen P, Bouley D, Xu A, Liu Z, Melosh N, Dai H, Sinclair R, Gambhir SS. Nano Lett. 2012;12:3369–3377. doi: 10.1021/nl204175t. [DOI] [PMC free article] [PubMed] [Google Scholar]
- 10.Kunjachan S, Pola R, Gremse F, Theek B, Ehling J, Moeckel D, Hermanns-Sachweh B, Pechar M, Ulbrich K, Hennink WE, Storm G, Lederle W, Kiessling F, Lammers T. Nano Lett. 2014;14:972–981. doi: 10.1021/nl404391r. [DOI] [PMC free article] [PubMed] [Google Scholar]
- 11.Schädlich A, Caysa H, Mueller T, Tenambergen F, Rose C, Göpferich A, Kuntsche J, Mäder K. ACS Nano. 2011;5:8710–8720. doi: 10.1021/nn2026353. [DOI] [PubMed] [Google Scholar]
- 12.Ernsting MJ, Murakami M, Roy A, Li S-DJ. Controlled Release. 2013;172:782–794. doi: 10.1016/j.jconrel.2013.09.013. [DOI] [PMC free article] [PubMed] [Google Scholar]
- 13.Miller MA, Zheng Y-R, Gadde S, Pfirschke C, Zope H, Engblom C, Kohler RH, Iwamoto Y, Yang KS, Askevold B, Kolishetti N, Pittet M, Lippard SJ, Farokhzad OC, Weissleder R. Nat Commun. 2015;6:8692–8705. doi: 10.1038/ncomms9692. [DOI] [PMC free article] [PubMed] [Google Scholar]
- 14.Hobbs SK, Monsky WL, Yuan F, Roberts WG, Griffith L, Torchilin VP, Jain RK. Proc Natl Acad Sci U S A. 1998;95:4607–4612. doi: 10.1073/pnas.95.8.4607. [DOI] [PMC free article] [PubMed] [Google Scholar]
- 15.Hashizume H, Baluk P, Morikawa S, McLean JW, Thurston G, Roberge S, Jain RK, McDonald DM. Am J Pathol. 2000;156:1363–1380. doi: 10.1016/S0002-9440(10)65006-7. [DOI] [PMC free article] [PubMed] [Google Scholar]
- 16.Perrault SD, Walkey C, Jennings T, Fischer HC, Chan WCW. Nano Lett. 2009;9:1909–1915. doi: 10.1021/nl900031y. [DOI] [PubMed] [Google Scholar]
- 17.Huo S, Ma H, Huang K, Liu J, Wei T, Jin S, Zhang J, He S, Liang X-J. Cancer Res. 2013;73:319–330. doi: 10.1158/0008-5472.CAN-12-2071. [DOI] [PubMed] [Google Scholar]
- 18.Popović Z, Liu W, Chauhan VP, Lee J, Wong C, Greytak AB, Insin N, Nocera DG, Fukumura D, Jain RK, Bawendi MG. Angew Chem Int Ed. 2010;49:8649–8652. doi: 10.1002/anie.201003142. [DOI] [PMC free article] [PubMed] [Google Scholar]
- 19.Sykes EA, Chen J, Zheng G, Chan WCW. ACS Nano. 2014;8:5696–5706. doi: 10.1021/nn500299p. [DOI] [PubMed] [Google Scholar]
- 20.Dawidczyk CM, Russell LM, Searson PC. Front Chem. 2014;2:69. doi: 10.3389/fchem.2014.00069. [DOI] [PMC free article] [PubMed] [Google Scholar]
- 21.Perry JL, Reuter KG, Kai MP, Herlihy KP, Jones SW, Luft JC, Napier M, Bear JE, DeSimone JM. Nano Lett. 2012;12:5304–5310. doi: 10.1021/nl302638g. [DOI] [PMC free article] [PubMed] [Google Scholar]
- 22.Black KCL, Wang Y, Luehmann HP, Cai X, Xing W, Pang B, Zhao Y, Cutler CS, Wang LV, Liu Y, Xia Y. ACS Nano. 2014;8:4385–4394. doi: 10.1021/nn406258m. [DOI] [PMC free article] [PubMed] [Google Scholar]
- 23.Gratton SEA, Ropp PA, Pohlhaus PD, Luft JC, Madden VJ, Napier ME, DeSimone JM. Proc Natl Acad Sci U S A. 2008;105:11613–11618. doi: 10.1073/pnas.0801763105. [DOI] [PMC free article] [PubMed] [Google Scholar]
- 24.Bibby MC. Eur J Cancer. 2004;40:852–857. doi: 10.1016/j.ejca.2003.11.021. [DOI] [PubMed] [Google Scholar]
- 25.Onn A, Isobe T, Itasaka S, Wu W, O’Reilly MS, Ki Hong W, Fidler IJ, Herbst RS. Clin Cancer Res. 2003;9:5532–5539. [PubMed] [Google Scholar]
- 26.Minchinton AI, Tannock IF. Nat Rev Cancer. 2006;6:583–592. doi: 10.1038/nrc1893. [DOI] [PubMed] [Google Scholar]
- 27.Sriraman SK, Aryasomayajula B, Torchilin VP. Tissue Barriers. 2014;2:e29528. doi: 10.4161/tisb.29528. [DOI] [PMC free article] [PubMed] [Google Scholar]
- 28.Jain RK, Stylianopoulos T. Nat Rev Clin Oncol. 2010;7:653–664. doi: 10.1038/nrclinonc.2010.139. [DOI] [PMC free article] [PubMed] [Google Scholar]
- 29.Talmadge JE, Singh RK, Fidler IJ, Raz A. Am J Pathol. 2007;170:793–804. doi: 10.2353/ajpath.2007.060929. [DOI] [PMC free article] [PubMed] [Google Scholar]
- 30.Harrington KJ, Rowlinson-Busza G, Syrigos KN, Abra RM, Uster PS, Peters AM, Stewart JSW. Br J Cancer. 2000;83:684–688. doi: 10.1054/bjoc.2000.1320. [DOI] [PMC free article] [PubMed] [Google Scholar]
- 31.Vilalta M, Hughes NP, Von Eyben R, Giaccia AJ, Graves EE. Mol Imaging Biol. 2017;19:215–224. doi: 10.1007/s11307-016-1010-5. [DOI] [PMC free article] [PubMed] [Google Scholar]
- 32.Miller MA, Gadde S, Pfirschke C, Engblom C, Sprachman MM, Kohler RH, Yang KS, Laughney AM, Wojtkiewicz G, Kamaly N, Bhonagiri S, Pittet MJ, Farokhzad OC, Weissleder R. Sci Transl Med. 2015;7:314ra183. doi: 10.1126/scitranslmed.aac6522. [DOI] [PMC free article] [PubMed] [Google Scholar]
- 33.De Palma M, Lewis CE. Cancer Cell. 2013;23:277–286. doi: 10.1016/j.ccr.2013.02.013. [DOI] [PubMed] [Google Scholar]
- 34.Chanmee T, Ontong P, Konno K, Itano N. Cancers. 2014;6:1670–1690. doi: 10.3390/cancers6031670. [DOI] [PMC free article] [PubMed] [Google Scholar]
- 35.Lammers T, Kiessling F, Ashford M, Hennink W, Crommelin D, Strom G. Nat Rev Mater. 2016;1:16069. doi: 10.1038/natrevmats.2016.69. [DOI] [PMC free article] [PubMed] [Google Scholar]
- 36.McNeil SE. Nat Rev Mater. 2016;1:16073. [Google Scholar]
- 37.Chauhan VP, Popovic Z, Chen O, Cui J, Fukumura D, Bawendi MG, Jain RK. Angew Chem Int Ed. 2011;50:11417–11420. doi: 10.1002/anie.201104449. [DOI] [PMC free article] [PubMed] [Google Scholar]
Associated Data
This section collects any data citations, data availability statements, or supplementary materials included in this article.