Abstract
The development of a reliable and high-throughput glycomic profiling strategy is in high demand due to the biological roles of glycans and their association with different diseases. Native analysis can be quite difficult because of the low ionization efficiency and microheterogeneity of glycans. In this chapter, the sample preparation protocols and LC-MS analysis of permethylated glycan strategies are introduced. Solid-phase permethylation is a fast, convenient, and high-yield method to stabilize sialic acid and improve glycan ionization efficiency and analysis in positive mode; this results in a more sensitive and reliable glycomic profiling strategy. Several modifications in the LC method are also mentioned in this chapter. Online purification simplifies sample preparation and reduces sample loss. Elevating the column temperature significantly improves the peak shape of permethylated glycans and results in isomeric separation. The identification and quantification of permethylated glycans can be achieved through high resolution MS and MS/MS experiments using a MRM method; both approaches are reliable, sensitive, and conducive to high-throughput glycomic studies.
Keywords: Quantitative glycomics, LC-MS, Permethylation, MRM, online purification
1. Introduction
Protein glycosylation is a common protein post-translational modification (PTM) because of its effect on protein function and its prevalence in numerous biological processes. For example, cell-surface glycans are lectin receptors influencing cell adhesion and signaling [1]; N-glycans on the Fc fragment of antibodies affect its stability and efficacy [2]. Glycans are also considered potential biomarkers for different diseases such as immune deficiencies [3–5], hereditary disorders, and various types of cancer [6–9].
Mass spectrometry (MS) is one of the most powerful analytical techniques in bioanalysis. Biomolecules are initially identified with high-resolution MS experiments. Subsequent tandem MS (MS/MS) experiments yield structural information such as protein sequence and glycan composition. Challenges still exist in the characterization and quantitation of glycans with MS. Unlike nucleotides and peptides, glycan biosynthesis is a template-free process resulting in the presence of highly-branched, complex glycan structures with a wide dynamic range of intensity. The most prevalent sialic acid in mammalian cells, N-acetylneuraminic acid, is widely distributed in N- and O-glycans. The native form of N-acetylneuraminic acid is unstable during the ionization process and has a lower positive mode ionization efficiency that results in a quantitative measurement bias of sialylated glycans. All of these factors contribute to the difficulty in MS-based glycomics analysis even with the use of state-of-the-art modern MS instruments.
Permethylation is one of the most commonly utilized derivatization methods to address the stability and ionization issues mentioned above. During the permethylation process, all reactive glycan hydrogens are replaced with methyl groups. The most widely used glycan permethylation protocols are the method introduced by Ciccanu and Kerek in 1984 [10], which is based on the utilization of methyl iodide, DMSO, and solid sodium hydroxide. This method was further modified with the introduction of minuscule amounts of water to avoid potential oxidative degradation during the reaction [11]; however, side reactions occur when using small quantities of glycan. To overcome this issue, a solid-phase permethylation method has been developed [12]. In solid-phase permethylation, the reaction is processed in micro-spin columns or micro-reactors modified from the capillary. The spin column or capillary are packed with sodium hydroxide beads followed by the mixture of glycans and reaction reagents. In this method, both neutral and sialylated glycans are quickly and efficiently permethylated in a minimized reaction volume. After the reaction, liquid-liquid extraction is utilized to remove salts generated during permethylation.
Permethylated glycans are stable and readily ionize with either matrix-assisted laser desorption ionization (MALDI) or electrospray ionization (ESI). Numerous glycomics studies have employed the combination of permethylation derivatization and MALDI-MS but this approach is not able to detect lower abundant glycan structures. A more robust approach is required for the comprehensive analysis of trace glycans derived from complex biological samples. Coupling MS to separation techniques significantly improves the identification and quantitation of low abundant glycans by reducing competitive ionization and detector saturation. The increased hydrophobicity of permethylated glycans allows for efficient separation with reverse phase liquid chromatography (RPLC). A recent study comparing the glycomic profiling reproducibility of MALDI-MS, RPLC-ESI-MS, and offline RPLC-MALDI-MS [13] highlighted the benefits of employing an online separation step before the MS analysis of permethylated glycans; RPLC-ESI-MS identified the most glycans. The sensitivity of LC-MS analysis of permethylated glycans can be further improved by employing an online purification step [14]. A ten port valve with C18 trapping option is utilized for online glycan purification before separation on the analytical column. This method is more sensitive than offline liquid-liquid extraction and C18 solid phase extraction (SPE) and yields a simplified sample preparation process making it suitable for high-throughput studies. Recently, we have demonstrated an increase in the separation efficiency of permethylated glycans on a C18 analytical column at elevated temperatures; this is especially useful for separating highly branched glycans. An optimized column temperature of 55°C is sufficient to acquire this resolution without damaging the C18 column. The peak width under this condition is one-third to one fourth of the peak width obtained at ambient temperature separation; an improved separation efficiency would further increase sensitivity and enable isomer identification.
Most LC-MS analysis of permethylated glycans relies on high-resolution MS (HRMS) to resolve the close m/z of complex glycans. Multiple reaction monitoring (MRM) experiments on a triple quadrupole mass spectrometer is another strategy for the identification and quantitation of permethylated glycans [15]. In MRM mode, the first quadrupole (Q1) isolates and transfers the analyte of interest, the precursor ion, to the second quadrupole (Q2) where it undergoes collision induced dissociation (CID) to yield fragment ions. These product ions are then transferred to the third quadrupole (Q3) for mass analysis and subsequent abundance determination by a detector. The quantitation of MRM is based on the intensities of the transitions. SRM/MRM technique has already been utilized in proteomics and glycoproteomics studies [16–19]. Recently, this strategy has been applied to the quantitative analysis of permethylated N-glycans [15]. This approach is quite sensitive as evidenced by the confident relative quantitation of 10 nL of human blood serum.
2. MATERIALS
2.1. PNGase F digestion
PNGase F (glycerol-free, 500,000 units/ml) (New England Biolabs, Ipswich, MA)
Ammonium bicarbonate buffer (50 mM solution, pH 7.5 – 8.0) (Sigma-Aldrich, St. Louis, MO).
2.2 Charcoal SPE purification
Solution A: 85% acetonitrile, 15% water, 0.1% formic acid
Solution B: 5% acetonitrile, 95% water, 0.1% formic acid
Solution C: 40% acetonitrile, 60% water, 0.1% formic acid
2.3 Reduction
Borane-ammonia complex, 97% (Sigma-Aldrich, St. Louis, MO)
HPLC grade menthol
2.4 Solid-phase permethylation
Dimethyl sulfoxide, >99.9% (Sigma-Aldrich, St. Louis, MO)
sodium hydroxide beads, 20–40 mesh, 97% (Sigma-Aldrich, St. Louis, MO)
Empty micro spin column, 5 μm frit (Harvard Apparatus, Holliston, MA)
Iodomethane contains copper as stabilizer, 99.5% (Sigma-Aldrich, St. Louis, MO)
2.5 Liquid Chromatography
Solvent A (98% water, 2% acetonitrile with 0.1% formic acid)
Solvent B (acetonitrile with 0.1% formic acid)
C18 pre-column (3 μm particle size, 100 Å pore size, 75 μm i.d., 2 cm length), Acclaim Pepmap RSLC C18 column (2 μm particle size, 100 Å pore size, 75 μm i.d., 15 cm length) (Thermo Scientific, Sunnyvale, CA)
Ultimate 3000 Nano LC system (Thermo Scientific, Sunnyvale, CA)
2.6 Mass spectrometer
LTQ Orbitrap Velos mass spectrometer (Thermo Fisher Scientific Inc., Waltham, MA)
Vantage mass spectrometer (Thermo Fisher Scientific Inc., Waltham, MA)
3. METHODS
3.1 Release N-glycan
N-glycans are released from glycoproteins using PNGase F. The protocol may vary depending on the sample matrix. Extracted glycoproteins and biofluids can be directly denatured and deglycosylated with PNGase F while cell lines and tissue samples require additional steps for sample homogenization and glycoprotein extraction.
Homogenize tissue or cell line samples by bead beater homogenizer at 4°C. A cycle of 30 seconds of beating can be applied until no pellets can be observed in sample
Sonicate homogenized sample in an ice-water bath for 1 hour.
Mix sample with 50 mM pH 7.5 ammonium bicarbonate (ABC) or PBS buffer in a 1:1 ratio.
Denature sample in 80 °C water bath for 30 minutes.
When the denatured sample is cooled down to room temperature, add excess PNGase F (~250 units) and mix well by a pipette tip. Incubate in 37 °C water bath for 18 hours. (Note 1)
3.2 Purification of released N-glycan
3.2.1 Charcoal SPE purification
Wash charcoal spin column with 400 uL of acetonitrile, spin down at 1.6 krpm for 2 minutes.
Wash charcoal spin column with 400 uL of 85% acetonitrile with 15% water, spin down at 1.6 krpm for 2 min.
Wash charcoal spin column with 400 uL of Solution B, spin down at 1.6 krpm for 2 minutes; repeat this step 2 times.
Adjust the sample volume to 400 uL of Solution A, load the sample into spin column and spin down at 1.6 krpm for 2 minutes
Wash the spin column with 400 uL of Solution A, spin down at 1.6 krpm for 2 min; repeat this step 3 times.
Elute the spin column with 400 uL of Solution C, spin down at 1.6 krpm for 2 min; repeat this step 2 times. Collect and dry the eluents.
3.2.2 Protein precipitation
Add 500 uL of ice-cold 90% ethanol into the sample.
Incubate the mixture in −20 °C freezer for 30 minutes.
Centrifuge at 14.8 krpm for 10 min, collect and dry the supernatant part.
3.2.3 Dialysis
Place dialysis membrane (MWCO: 500–1000 Da) into the home-made dialysis device.
Resuspend sample in 50 uL water and apply sample on the top of the dialysis membrane, the lower chamber is filled with cycled deionized water.
After 12 hours, samples are collected from dialysis device, each well is rinsed with 100 uL of deionized water containing 0.1% formic acid.
3.3 Reduce N-glycan
Prepare fresh 10 mg/mL borane-ammonia aqueous solution.
Add 10 uL of borane-ammonia solution into purified and dried glycan sample.
Incubate the mixture in 60 °C water bath for 1 hour.
Take the sample out and dry it in a speed vacuum.
Add 400 uL of methanol into the sample and dry it in a speed vacuum; repeat this step until there are no white pellets left in the dried sample
3.4 Solid-phase permethylation
3.4.1 Packing sodium hydroxide beads into empty column
Sodium hydroxide beads are soaked in DMSO for packing into the reaction column. The mixture of sodium hydroxide and DMSO can be stored at room temperature for up to 1 month.
Use a 1 mL pipette to transfer the sodium hydroxide beads in DMSO mixture into an empty spin column. The pipette tip should be cut so that sodium hydroxide beads can be aspirated into the pipette tip. The packed sodium hydroxide bead bed volume should be ~ 2 cm in height.
Centrifuge the spin column at 1.8 krpm for 2 minutes (or longer time until no visible DMSO is left in the column), to force the DMSO out of the spin column.
Add 200 μL of DMSO to the spin column for washing beads, also, Centrifuge the column at 1.8 krpm for 2 minutes (or longer time until no visible DMSO is left in the column). The spin column is ready for the permethylation reaction. (Note 2)
3.4.2 solid-phase derivatization
The purified and dried glycan is resuspended with 30 μL DMSO, 1.2 μL water, and 20 μL iodomethane. (sufficient for up to 10 μg of glycan).
The whole mixture is added to the prepared sodium hydroxide column and incubated at room temperature for 25 minutes; then add 20 μL of iodomethane into the column and incubate at room temperature for 10 min. Try to keep the column in a low-humidity environment during the incubation.
Place the spin column in a clean Eppendorf tube and centrifuge the spin column to elute the mixture.
Dry the eluent in a speed vacuum, it may take longer than 10 hours since DMSO is hard to evaporate.
After drying, there may be white sodium and iodide salts in the bottom of the Eppendorf tube. The dried mixture can be directly analyzed by LC-MS with an online trap. For MALDI or direct infusion ESI-MS, liquid-liquid extraction or SPE should be used to remove salts.
3.5 Liquid Chromatography Conditions
After permethylation, the increased hydrophobicity of the glycan allows for efficient separation on a C18 column. An elevated temperature setting improves the chromatographic resolution, reduces analytical column back pressure, and obtains a stable nanoESI spray. We have included an online purification step in this LC method to remove any by-products generated during the permethylation reaction.
1. Resuspend dried sample using 20% acetonitrile with 0.1% formic acid.
2. Set the column oven temperature to 55°C and allow it to equilibrate for ~ 30 minutes before starting the analysis.
2. The multi-gradient method is as follows:
0–10 minutes: Initial position of the 10-port valve is set to the 1_2 position. Loading pump has a 3 μL/min flow rate, 100% A. Nano pump has 0.35 μL/min flow rate, 20% B
10–11 minute: 10-port valve is switched to the 1_10 position. Nano pump has mobile phase B increased to 38%.
12–43 minute: ramping of mobile phase B from 38% to 60%.
44–45 minute: ramping of mobile phase B from 60% to 90%.
46–50 minute: keep mobile phase B at 90%.
51 minute: decrease mobile phase B from 90% to 20%.
52–60 minute: keep mobile phase B at 20%.
3.6 Mass Spectrometer Parameters
3.6.1 High-resolution mass spectrometer parameters
A nanoESI source is utilized to interface a nanoLC to an LTQ Velos Orbitrap. The ESI spray voltage is set to 1.6 kV. Transfer tube temperature is set to 275°C. The data is acquired in data-dependent acquisition (DDA) mode; the four most abundant precursor ions are isolated for MS2 analysis by collision-induced dissociation (CID) and higher energy collision dissociation (HCD). The dynamic exclusion feature was utilized to ensure no repeated ion is selected during a 30-second moving window. MS acquisition is set to scan a range of 600–2000 m/z with the resolution set to 15,000. The CID MS2 settings are the following: 3.0 m/z isolation width, 10 ms activation time, 30% normalized collision energy, 0.25 activation Q value. The HCD MS2 utilizes a 1.0 m/z isolation width with 40% normalized collision energy.
3.6.1 MRM tandem mass spectrometer parameters
A nanoESI source with the same settings is utilized to interface the LC to a TSQ Vantage. DDA mode is utilized in this MRM experiment. The full scan is generated with an acquisition range of 300–1500 m/z in Q3. The scan time is set to 0.7 seconds with a peak width of 0.7 FWHM. The five most intense ions are selected from the full scan and subjected to collision induced dissociation. The normalized collision energy is set to 30%–45%, depending on the structure of the precursor ion. The intensities of three transitions were recorded for each precursor ion. The m/z values of three transitions are glycan structure dependent.
3.6 Data Processing
3.6.1 High-resolution mass spectrometer
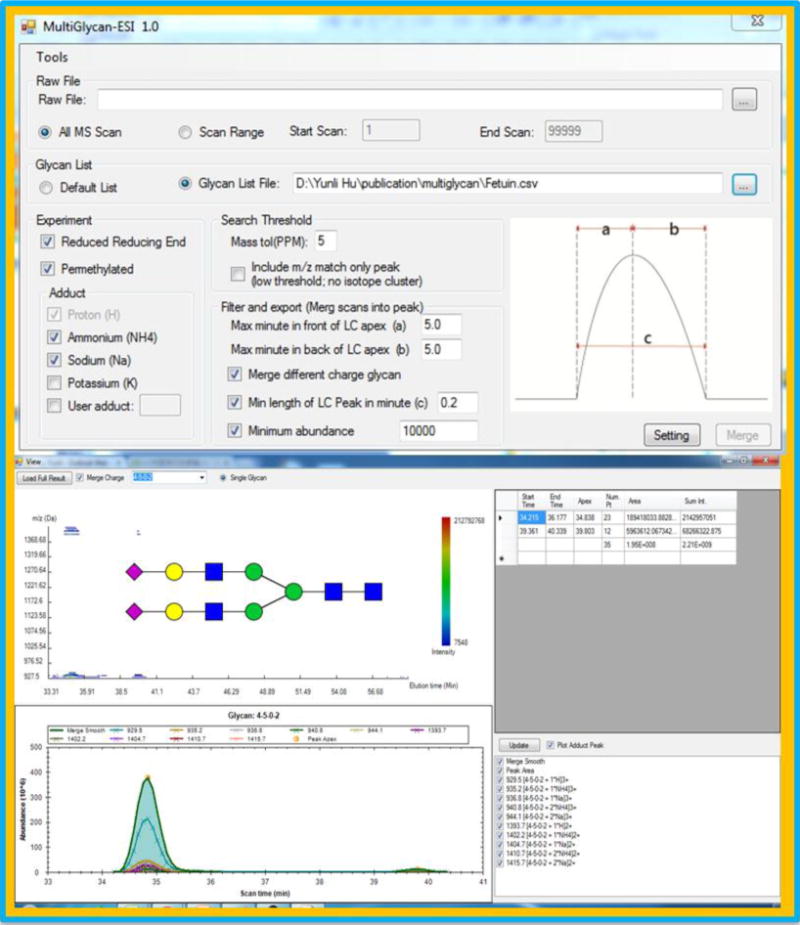
The relative quantitation of glycans in Orbitrap mass spectrometers is based on the ion intensities acquired in the full scan. For the manual data processing, Xcalibur Qual Browser is utilized to generate the extracted ion chromatogram (EIC) for all adducts and charge states of glycans. The mass tolerance is set to 10 ppm. The single full scan spectrums under EIC are manually checked to eliminate false positive results generated by Xcalibur. The accumulated peak area of EIC is recorded to represent the intensity of the corresponding glycan. Another software is available, and some have proven to permit rapid data processing. Here we use MultiGlycan [20, 21] to process the data generated in this method. Algorithms were employed for the peak validation, and different adducts are merged to calculate the total glycan intensity. Fast and reliable annotation and quantitation of glycans can be achieved by using MulitGlycan.
3.6.2 MRM tandem mass spectrometer
Xcalibur Qual Browser is used for processing the MRM experiment data. The intensities of three transitions were summed for each precursor ion to rebuild the EIC by selecting scan filters in the mass range option. The peak area of the EIC represents the intensity of a corresponding glycan.
Figure 1.
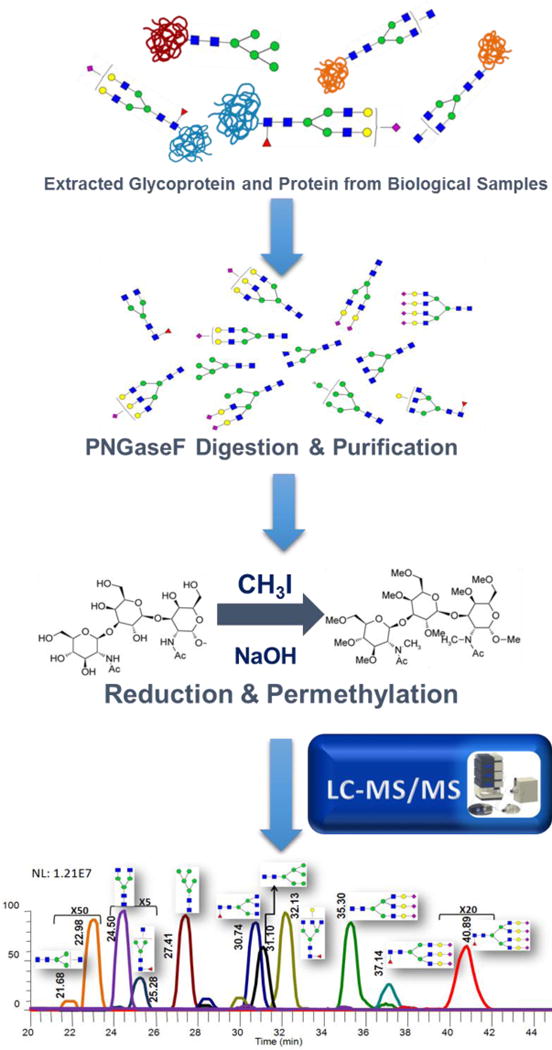
Figure 2.
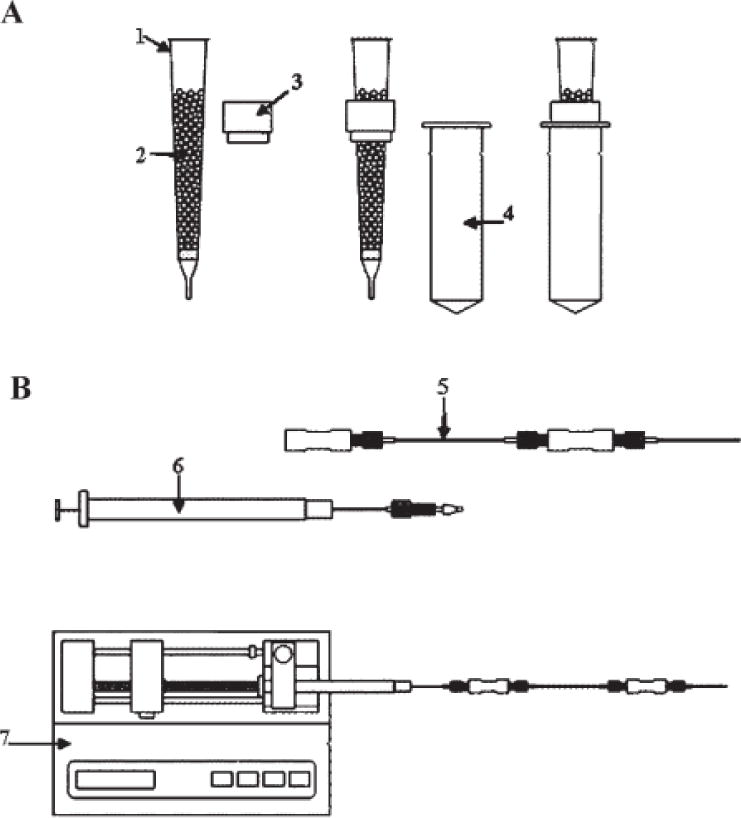
Schematic representation of the different permethylation techniques. (A) Spin-column setup: (1) spin column; (2) NaOH beads; (3) column holder; (4) micro-centrifuge tube; (B) 500 μm i.d. fused-silica capillary setup: (5) 500 μm i.d. fused-silica capillary; (6) syringe; (7) syringe pump.
Figure 3.
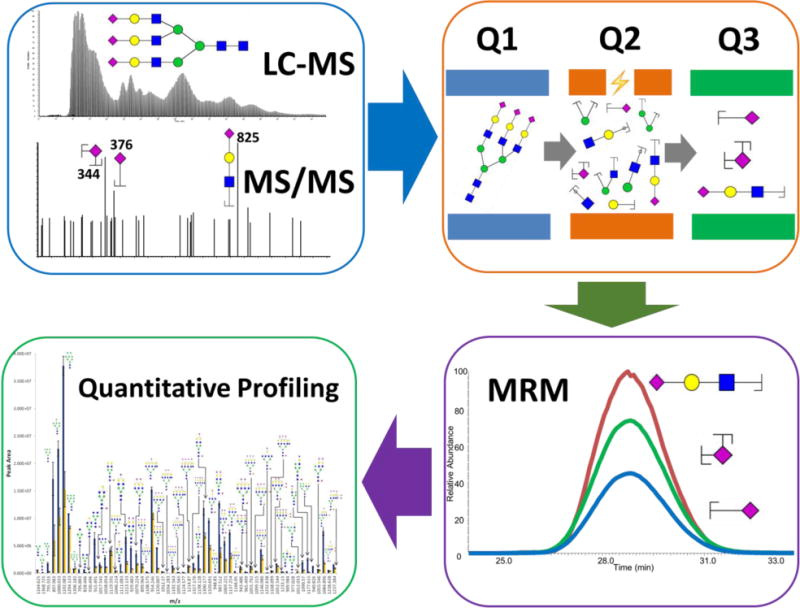
Figure 4.
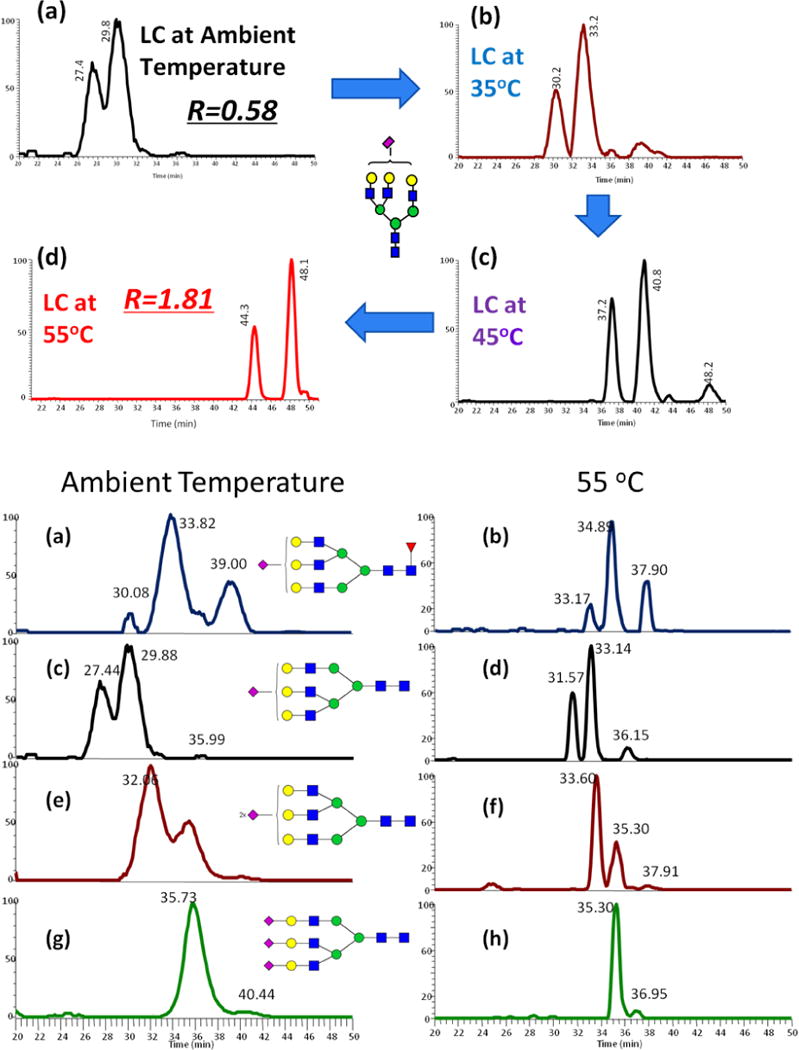
Figure 5.
Footnotes
The amount of PNGase F added will depend on the quantity of glycoproteins subjected to PNGase F treatment. For example, 60 Units will be used to release glycans from 50 μg of the glycoprotein. In the case of blood serum, 100 units of PNGase F are added to 10 μL sample.
Sodium hydroxide is hygroscopic, and the absorbance of water interferes with the reaction. Load the sample into the spin column as soon as the sodium hydroxide column is ready. The incubation should be performed in a low-humidity environment.
References
- 1.Haslam SM, North SJ, Dell A. Mass spectrometric analysis of N- and O-glycosylation of tissues and cells. Curr Opin Struct Biol. 2006;16(5):584–91. doi: 10.1016/j.sbi.2006.08.006. [DOI] [PubMed] [Google Scholar]
- 2.Raju TS. Terminal sugars of Fc glycans influence antibody effector functions of IgGs. Curr Opin Immunol. 2008;20(4):471–8. doi: 10.1016/j.coi.2008.06.007. [DOI] [PubMed] [Google Scholar]
- 3.Back NK, et al. An N-glycan within the human immunodeficiency virus type 1 gp120 V3 loop affects virus neutralization. Virology. 1994;199(2):431–8. doi: 10.1006/viro.1994.1141. [DOI] [PubMed] [Google Scholar]
- 4.Kolchinsky P, et al. Loss of a single N-linked glycan allows CD4-independent human immunodeficiency virus type 1 infection by altering the position of the gp120 V1/V2 variable loops. J Virol. 2001;75(7):3435–43. doi: 10.1128/JVI.75.7.3435-3443.2001. [DOI] [PMC free article] [PubMed] [Google Scholar]
- 5.Doores KJ, et al. Envelope glycans of immunodeficiency virions are almost entirely oligomannose antigens. Proc Natl Acad Sci U S A. 2010;107(31):13800–5. doi: 10.1073/pnas.1006498107. [DOI] [PMC free article] [PubMed] [Google Scholar]
- 6.Dennis JW, Granovsky M, Warren CE. Protein glycosylation in development and disease. Bioassays. 1999;21(5):412–421. doi: 10.1002/(SICI)1521-1878(199905)21:5<412::AID-BIES8>3.0.CO;2-5. [DOI] [PubMed] [Google Scholar]
- 7.Lowe JB, Marth JD. A genetic approach to Mammalian glycan function. Annu Rev Biochem. 2003;72:643–691. doi: 10.1146/annurev.biochem.72.121801.161809. [DOI] [PubMed] [Google Scholar]
- 8.Mechref Y, et al. Identifying cancer biomarkers by mass spectrometry-based glycomics. Electrophoresis. 2012;33(12):1755–1767. doi: 10.1002/elps.201100715. [DOI] [PMC free article] [PubMed] [Google Scholar]
- 9.Mechref Y, et al. Identifying cancer biomarkers by mass spectrometry-based glycomics. Electrophoresis. 2012;33:1755–1767. doi: 10.1002/elps.201100715. [DOI] [PMC free article] [PubMed] [Google Scholar]
- 10.Ciucanu I KF. A simple and rapid method for the permethylation of carbohydrates. Carbohydr Res. 1984;131(2):209–217. [Google Scholar]
- 11.Ciucanu I, Costello CE. Elimination of oxidative degradation during the per-O-methylation of carbohydrates. J Am Chem Soc. 2003;125(52):16213–9. doi: 10.1021/ja035660t. [DOI] [PubMed] [Google Scholar]
- 12.Kang P, et al. Solid-phase permethylation of glycans for mass spectrometric analysis. Rapid Commun Mass Spectrom. 2005;19(23):3421–8. doi: 10.1002/rcm.2210. [DOI] [PMC free article] [PubMed] [Google Scholar]
- 13.Hu Y, Mechref Y. Comparing MALDI-MS, RP-LC-MALDI-MS and RP-LC-ESI-MS glycomic profiles of permethylated N-glycans derived from model glycoproteins and human blood serum. Electrophoresis. 2012;33(12):1768–77. doi: 10.1002/elps.201100703. [DOI] [PMC free article] [PubMed] [Google Scholar]
- 14.Desantos-Garcia JL, et al. Enhanced sensitivity of LC-MS analysis of permethylated N-glycans through online purification. Electrophoresis. 2011;32(24):3516–25. doi: 10.1002/elps.201100378. [DOI] [PMC free article] [PubMed] [Google Scholar]
- 15.Zhou S, et al. Quantitation of permethylated N-glycans through multiple-reaction monitoring (MRM) LC-MS/MS. J Am Soc Mass Spectrom. 2015;26(4):596–603. doi: 10.1007/s13361-014-1054-1. [DOI] [PMC free article] [PubMed] [Google Scholar]
- 16.Gil GC, Velander WH, Van Cott KE. N-glycosylation microheterogeneity and site occupancy of an Asn-X-Cys sequon in plasma-derived and recombinant protein C. Proteomics. 2009;9(9):2555–67. doi: 10.1002/pmic.200800775. [DOI] [PMC free article] [PubMed] [Google Scholar]
- 17.Ahn YH, et al. Quantitative Analysis of an Aberrant Glycoform of TIMP1 from Colon Cancer Serum by L-PHA-Enrichment and SISCAPA with MRM Mass Spectrometry. Journal of Proteome Research. 2009;8(9):4216–4224. doi: 10.1021/pr900269s. [DOI] [PubMed] [Google Scholar]
- 18.Kurogochi M, et al. Sialic Acid-focused Quantitative Mouse Serum Glycoproteomics by Multiple Reaction Monitoring Assay. Molecular & Cellular Proteomics. 2010;9(11):2354–2368. doi: 10.1074/mcp.M110.000430. [DOI] [PMC free article] [PubMed] [Google Scholar]
- 19.Zhao Y, et al. Fragmentation and Site-Specific Quantification of Core Fucosylated Glycoprotein by Multiple Reaction Monitoring-Mass Spectrometry. Analytical Chemistry. 2011;83(22):8802–8809. doi: 10.1021/ac201676a. [DOI] [PubMed] [Google Scholar]
- 20.Yu CY, et al. Automated annotation and quantification of glycans using liquid chromatography-mass spectrometry. Bioinformatics. 2013;29(13):1706–7. doi: 10.1093/bioinformatics/btt190. [DOI] [PMC free article] [PubMed] [Google Scholar]
- 21.Hu Y, et al. Automated annotation and quantitation of glycans by liquid chromatography/electrospray ionization mass spectrometric analysis using the MultiGlycan-ESI computational tool. Rapid Commun Mass Spectrom. 2015;29(1):135–42. doi: 10.1002/rcm.7093. [DOI] [PMC free article] [PubMed] [Google Scholar]


