Abstract
Proteins and glycoproteins play important biological roles in central nervous systems (CNS). Qualitative and quantitative evaluation of proteins and glycoproteins expression in CNS is critical to reveal the inherent biomolecular mechanism of CNS diseases. This chapter describes proteomic and glycoproteomic approaches based on liquid chromatography/tandem mass spectrometry (LC-MS or LC-MS/MS) for the qualitative and quantitative assessment of proteins and glycoproteins expressed in CNS. Proteins and glycoproteins, extracted by a mass spectrometry friendly surfactant from CNS samples, were subjected to enzymatic (tryptic) digestion and three down-stream analyses: (1) a nano LC system coupled with a high resolution MS instrument to achieve qualitative proteomic profile, (2) a nano LC system combined with a triple quadrupole MS to quantify identified proteins, and (3) glycoprotein enrichment prior to LC-MS/MS analysis. Enrichment techniques can be applied to improve coverage of low abundant glycopeptides/glycoproteins. An example described in this chapter is hydrophilic interaction liquid chromatographic (HILIC) enrichment to capture glycopeptides, allowing efficient removal of peptides. The combination of three LC-MS/MS-based approaches is capable of the investigation of large-scale proteins and glycoproteins from CNS with an in-depth coverage, thus offering a full view of proteins and glycoproteins changes in CNS.
Keywords: protein glycosylation, glycopeptide, glycoprotein enrichment, glycoproteomics, LC-MS/MS, LC-MRM-MS/MS
1. INTRODUCTION
Proteins play important roles in central nervous system because they are the direct biofunctional molecules in living nervous cells. For large-scale screening of the protein component of simple organisms, the term “proteomics” was proposed by merging “protein” and “genomics” in late 1990s.1 Proteomics study focuses on the identification and quantitation of all the proteins of a proteome (Figure 1), including protein expression, molecular function, protein-protein interactions and protein posttranslational modifications (PTMs).2
Figure 1.
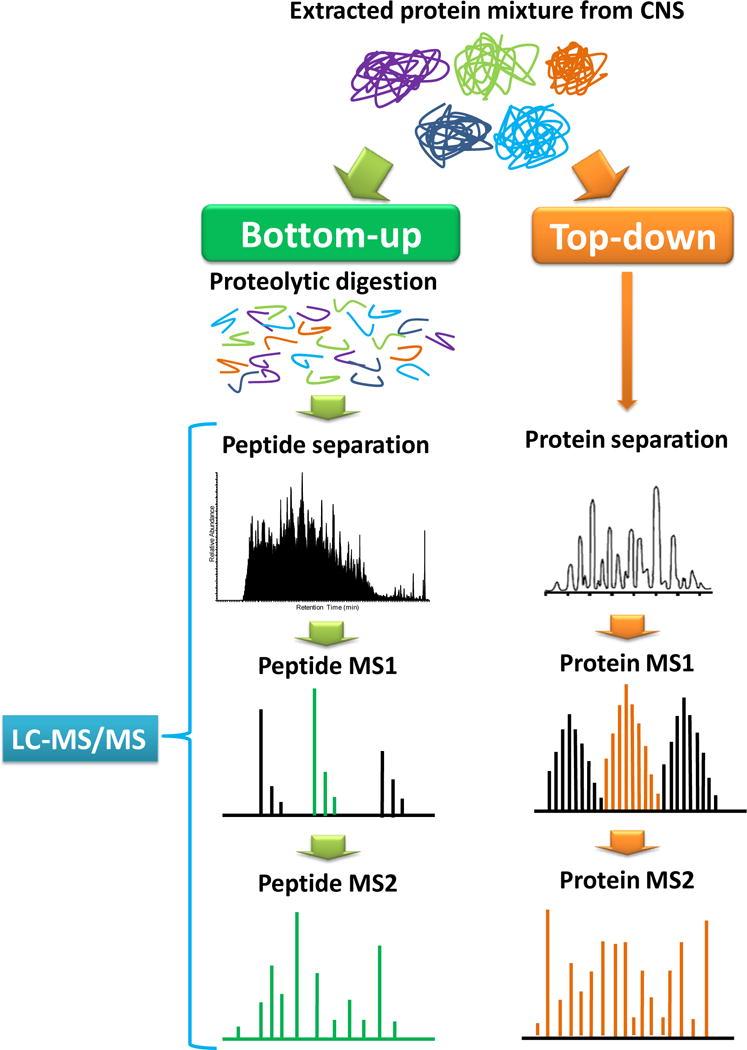
Common used strategy of bottom-up and top-down proteomics.
Glycosylation is a prevalent PTMs of proteins. The glycans could be covalently linked to either Asp residue of a protein to form N-linked glycosylation or a Ser/Thr residue of a protein to from an O-linked glycosylation. Many studies have suggested that N-linked glycosylation greatly influences many biological functions related to central nervous system.3–5 One of the major challenges in studying glycoproteomics is the low abundance of glycoproteins, limiting the characterization of glycopeptides/glycoproteins. Therefore, the enrichment of glycoprotein/glycopeptide is needed.
A common strategy for protein characterization is to analyze the peptides released from the protein through proteolytic digestion, which is referred to as “bottom-up” proteomics (Figure 1). Bottom-up analysis applied to large-scale protein analysis is referred to as shotgun proteomics.6, 7 In the past two decades, new technologies for peptide/protein separation, mass spectrometry analysis, and bioinformatics data analysis have been developed and incorporated in shotgun proteomic analysis.8–12 In a shotgun proteomic analysis, peptides mixtures are subjected to liquid chromatography interfaced to tandem mass spectrometry (LC-MS/MS) analysis. Peptides are identified by comparing the tandem mass spectra with the theoretical tandem mass spectra generated from a protein database. Benefiting from the hybrid mass analyzers introduced in the past several years (e.g. The Orbitrap Fusion™ Tribrid™ mass spectrometer by Thermo Scientific13), mass spectrometer has been used as a core tool for proteomic analysis.14–16 In a recent study, over 90% of the expressed yeast proteome (>4000 proteins) were identified in only 1.3 hour by combining ultra-high performance liquid chromatography (UHPLC) and a new orbitrap hybrid instrument.17
With the in-depth proteome coverage achieved by modern LC-MS/MS analysis, recent proteomic studies focus more on the quantitative aspect of protein analysis. For addressing biological questions related to central nervous system, abundance changes of proteins are essential for biological processes. MS-based quantitative proteomics could be achieved by label-free approaches, which are attained by measuring either the ion intensity of peptide peaks corresponding to a certain protein18 or spectral counting which measures the frequency of peptide identification to a certain protein (Figure 2).19
Figure 2.
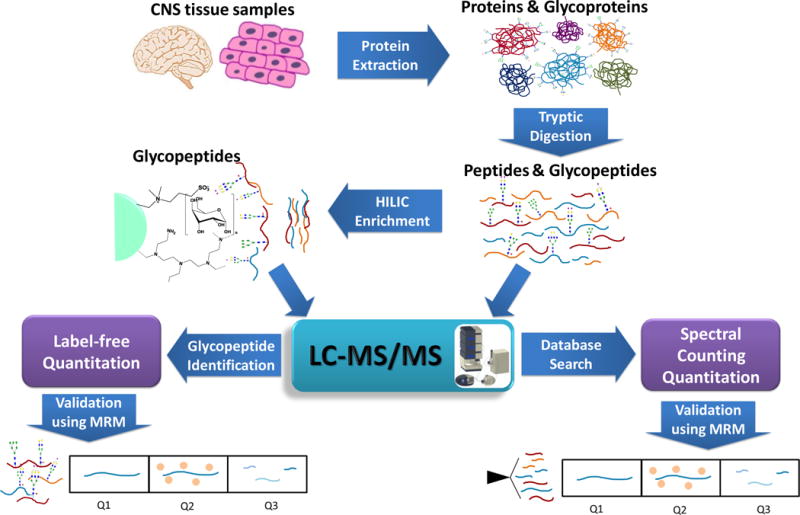
LC-MS/MS approaches of Proteomic sand Glycoproteomic s
However, shotgun proteomics has been proven to be limited in sensitivity and quantitative precision.20 The alternative approach for protein quantitation is liquid chromatography coupled with multiple reactions monitoring (LC-MRM)-based targeted quantitative proteomics. The LC-MRM experiment is implemented on an LC system coupled to a triple quadrupole (QQQ) mass spectrometer. In a typical LC-MRM experiment, the peptide mixture is separated by LC system and ionized by electrospray ionization. In the QQQ mass spectrometer, target peptides were selected in the first quadrupole (Q1) mass filter and fragmented in the second quadrupole (Q2). The resulting fragment ions, which are usually referred as transition ions, are selectively monitoring in the third quadrupole (Q3) mass analyzer. The target peptide quantitation is achieved by summing up the transition ion intensities. The LC-MRM experiment greatly enhances the precision and sensitivity of protein quantitation (Figure 2).21
The abovementioned proteomics techniques are employed for glycoproteomics analysis. The high sensitivity and selectivity offered by MRM mode is advantageous for the quantification of glycopeptides. MRM quantitation of glycopeptides is based on the use of oxonium ions as transitions, including m/z values at 138 (HexNAc-2H2O-CH2O), 274 (NeuAc-H2O), 366 (HexNAc+Hex), and 657 (HexNAc+Hex+NeuAc).22–24 This is because they are invariably present as a result of glycan fragmentation of glycopeptides.22, 25 Mechref and coworkers22 have demonstrated that a concentration linear dynamic range over more than 3 orders of magnitude with a limit of detection less than 1.4 fmol is attained using oxonium ions as transitions for MRM quantitation of glycopeptides.
Several analytical challenges are associated with LC-MS/MS-based glycoproteomics. First, glycoproteins are present in low abundances in biological systems. Also, LC-MS/MS analysis of glycopeptides is hampered by their microheterogeneity and low ionization efficiencies in the presence of other peptides. Accordingly, glycoproteins/glycopeptides enrichment is currently considered the method of choice to overcome these challenges. Enrichment of glycoproteins also enhances their LC-MS/MS analysis by overcoming the concentration dynamic range that is commonly associated with proteomics. The different enrichment strategies are outlined in Figure 3. Lectin affinity chromatography26, 27 and hydrazide chemistry-based28 approaches are currently considered the two commonly employed glycoprotein/glycopeptide enrichment techniques. Recently, hydrophilic interaction liquid chromatographic enrichment (HILIC)29, 30 is considered as a promising enrichment technique to capture glycopeptides with efficient removal of peptides. As shown in Figure 4, the signal of a peptide at m/z value of 835.8827 wdisappeared after HILIC enrichment. On the other hand, the S/N ratio of a glycopeptide observed at m/z value of 946.3819 was increased by more than 200%. Therefore, more glycopeptides are likely subjected to MS/MS enabling more identification of glycopeptides.
Figure 3.
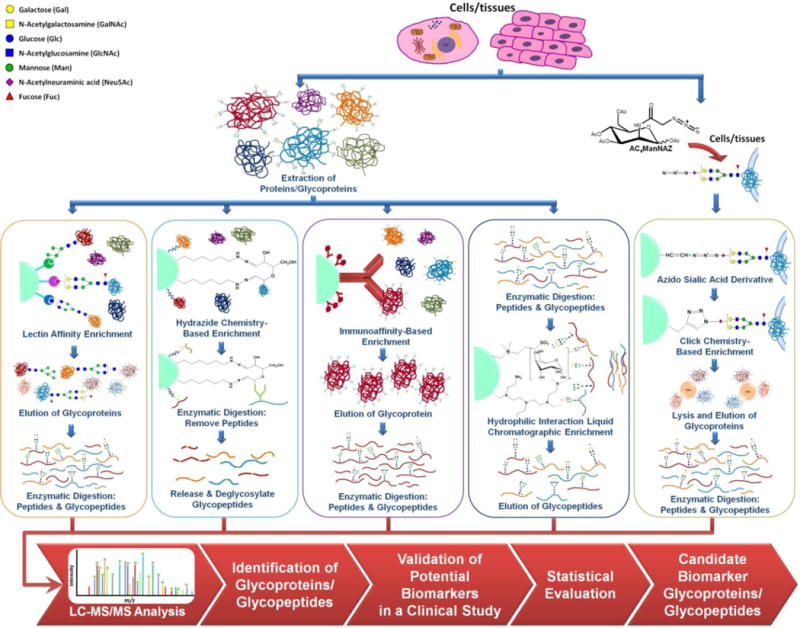
Workflow outlining glycoprotein enrichment and LC-MS/MS qualitative and quantitative characterization.
Figure 4.
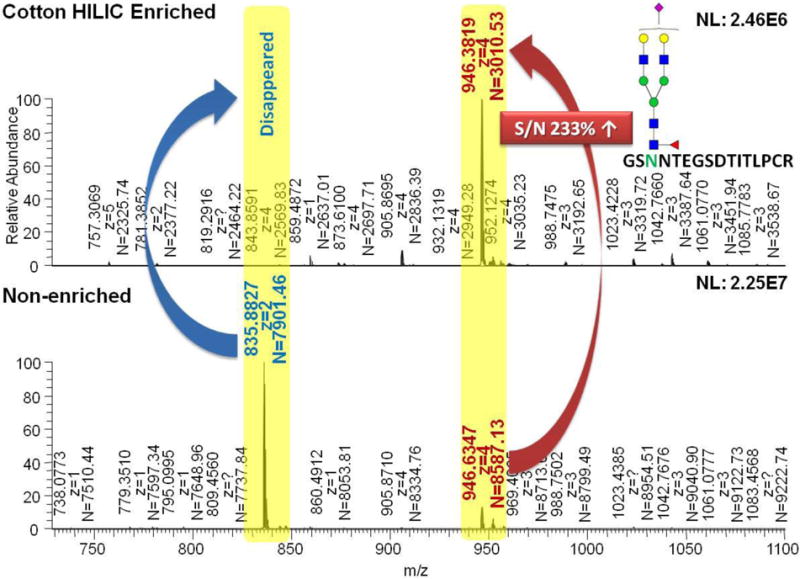
Comparisons of intensities of peptides and glycopeptides before and after cotton HILIC enrichment.
An LC-MS/MS-based method combing label-free quantitation and MRM quantitation of proteins and glycoproteins derived from central nervous systems is described here (Figure 2). For global proteomic analysis, proteins extracted from biological samples are first identified and quantified by shotgun proteomics and are then confirmed by LC-MRM experiment. For glycoproteomic analysis, tryptically digested peptides are subjected to glycopeptide enrichment following LC-MS/MS analysis.
2. MATERIALS
2.1. Protein extraction
10mM PBS buffer (Sigma-Aldrich, St. Louis, MO).
Sodium deoxycholate (SDC, Sigma-Aldrich, St. Louis, MO) solution (5% w/v).
Ammonium bicarbonate (ABC, Sigma-Aldrich, St. Louis, MO) buffer (50 mM solution, pH 7.5 – 8.0).
Pre-packed unskirted micro tubes (Benchmark Scientific, Edison, NJ).
Beadbug micro tube homogenizer (Benchmark Scientific, Edison, NJ).
2.2. Protein assay
Micro BCA protein assay kit (Thermo Fisher Scientific Inc., Rockford, IL).
96 well plate (Polystyrene, flat-bottom) (VWR international, Radnor, PA).
ABC buffer (50 mM solution, pH 7.5 – 8.0) (Sigma-Aldrich, St. Louis, MO).
Multiskan GO microplate spectrophotometer (Thermo Fisher Scientific Inc., Rockford, IL).
2.3. Tryptic digestion
Trypsin Gold, Mass Spectrometry Grade (Promega, Madison, WI).
Dithiothreitol (DTT) and iodoacetamide (IAA) (Sigma-Aldrich, St. Louis, MO).
ABC buffer (50 mM solution, pH 7.5 – 8.0) (Sigma-Aldrich, St. Louis, MO).
Neat formic acid (Sigma-Aldrich, St. Louis, MO).
CentriVap solvent concentrator system (Labconco, Kansas City, MO).
2.4. Glycopeptide enrichment
Neat formic acid (Sigma-Aldrich, St. Louis, MO).
HPLC grade acentonitril and water.
100% pure cotton balls (local Walmart)
2.5. LC-MS/MS
Solvent A, consisting of 2 % acetonitrile in HPLC water containing 0.1 % formic acid;
Solvent B, consisting of acetonitrile containing 0.1 % formic acid.
Nano LC-MS/MS system. Ultimate 3000 Nano LC system (Dionex, Sunnyvale, CA), LTQ Orbitrap Velos mass spectrometer (Thermo Fisher Scientific Inc., Waltham, MA) and TSQ Vantage mass spectrometer (Thermo Fisher Scientific Inc., Waltham, MA) equipped with a nanoESI source has been utilized in the methods described below (Note 1).
Acclaim Pepmap RSLC C18 column (2μm particle size, 100 Å pore size, 75 μm i.d., 15 cm length) (Dionex, Sunnyvale, CA), C18 pre-column (3μm particle size, 100 Å pore size, 75 μm i.d., 2 cm length) (Dionex, Sunnyvale, CA).
3. METHODS
3.1. Protein extraction
Depending on the aim of the study, CNS sample can be either tissue samples or cell samples. SDC has been shown to be an MS compatible and unbiased detergent for whole proteome extraction. SDC is compatible to both cell lysis or tissue homogenization.
Wash tissue samples 1~3 times with ice-cold 10 mM PBS buffer to remove blood/salt to avoid any of their interference with further protein extraction (in the case of cell samples skip this step).
Load samples into pre-packed unskirted micro tubes, add 5% SDC solution based on the sample weight (1:10, w/v).
Homogenize samples using a Beadbug micro tube homogenizer in a 4°C refrigerator. Homogenization should be performed as 30 sec/pulse, 5 pulses in total, leave the samples for 30 sec between pulses. Additional homogenization can be performed if the sample was incompletely homogenized.
Sonicate the homogenate in a 0 °C water bath for 30 min.
Centrifuge the homogenate at 14.8 rpm at 4°C for 20 min. The supernatant should contain the extracted protein.
Dilute the supernatant 10 times using 50mM ABC buffer to a final SDC concentration of 0.5%, w/v. (Note 2).
3.2. Protein assay
The amount of protein of each sample is required to be equal in order to get an accurate quantitative LC-MS/MS results. Therefore, a micro BCA protein assay is employed to evaluate the protein amount extracted from each sample.
For the calibration curve, dilute bovine serum albumin (BSA) stock (2μg/μl) solution in ABC buffer to a series of final BSA concentration: 200 ng/μL, 40 ng/μL, 20 ng/μL, 10 ng/μL, 5 ng/μL, 2.5 ng/μL, 1ng/μL. Using ABC buffer as a 0ng/μL blank solution.
Depends on the sample population, prepare enough working reagent (WR) for the protein assay. Working reagents should be prepared right before mixing with samples because they might be degraded once reaction occurs. The ratio between working reagent A (WA), working reagent B (WB) and working reagent C (WC) is 50:48:3.
Mix 450 μL of each BSA stock solution prepared in step 1. with 450 μL of WR. Mix 150 μL of each sample solution with 150 μL of WR.
Incubate the standard-WR and the sample-WR solution in a 60 °C water bath for 30 min.
Load 300 μL of standard-WR (triplicates) and sample-WR solution into a 96 well plate. Allow the samples to cool down to room temperature.
Using a Multiskan GO microplate spectrophotometer to measure the absorbance at 620nm of each sample and calculate the protein concentration of each sample.
3.3. Tryptic digestion
Based on the protein assay result, incubate same amount of protein of each sample at 80 °C for 15 min.
Cool down to room temperature prior to the addition of DTT solution to a final concentration of 5mM, and incubate at 60 °C for 45 min to reduce disulfide bonds to thiols.
Allow the sample to cool down to room temperature, add IAA solution to a final concentration of 20mM. Incubate the sample in the dark for 30 min to proceed the alkylation of thiols functional groups.
Add DTT solution to a final concentration of 10mM, and incubate at room temperature for 30 min to consume the excessive IAA.
Prepare fresh trypsin solution by resuspending trypsin in resuspending buffer (offer by the Trypsin Gold pack) to give a 1 μg/μL trypsin solution.
Add the 1 μg/μL trypsin solution to the reduced and alkylated protein samples using a 1:25 (w/w) trypsin to protein ratio, and allow digestion to proceed for 18 hrs at 37 °C.
Stop the enzyme activity and acidic precipitate the SDC by adding neat formic acid to a final concentration of 0.5% (v/v) (Note 3).
Centrifuge the sample at 14.8 rpm at 4°C for 10 min. The supernatant should contain the tryptic digest, and the white precipitant is deoxycholic acid.
Take the supernatant to another sample tube. For proteomic study, do step 3.3.10, and skip Section 3.4. For glycoproteomic study, skip step 3.3.10, perform the experiment described in section 3.4.
Dry the samples using a vacuum concentrator system. Store the dried tryptic digest at −20 °C, resuspend to 1 μg/μL before LC-MS/MS analysis.
3.4. Glycopeptide Enrichment - Hydrophilic Interaction Liquid Chromatography (HILIC)
Weigh the 5mg of cotton and pack into 1mL pipet tip.
Wash the cotton with 10mL of 0.5% formic acid.
Condition the cotton with 10mL of 90% acetonitrile.
After sealing the bottom of the 1mL tip with Parafilm, apply a 300μl-aliquot of sample (in 90% acetonitrile) to cotton packed tip.
Incubate 1–2 hours at 4° C with agitation.
Wash peptides with 10mL of 90% acetonitrile/0.1% formic acid.
Elute and collect glycopeptides with 2mL of 0.5% formic acid.
Dry and resuspend in 0.1% formic acid.
3.5. LC-MS/MS analysis
The quantitative proteomic analysis could be achieved by a bottom-up strategy. In this protocol, the protein tryptic digest is first analyzed by an LC-Ion trap-Orbitrap (LC-IT-OT) platform to attain global proteomic profiling of the biological samples. The data is compared through label-free spectral counting. The significantly altered proteins are further subjected to an LC-MRM experiment using an LC-triple quadruple (LC-QQQ) platform. The targeting quantitative study using LC-MRM could increase the confidence of quantitative analysis.
1. Resuspend the dried tryptic digest to 1 μg/μL.
2. Analyze 1 μg of the protein digest using LC-LTQ Orbitrap Velos system.
- 3. The LC system elution gradient setting is as following:
- 0 min: valve position: 1–2,
- 0–10 min: 5% solvent B,
- 10 min: valve position: 1–10,
- 10–65min: ramping of solvent B from 5 to 20%,
- 65–90 min: ramping of solvent B from 20 to 35%,
- 90–110 min: ramping of solvent B from 35 to 50%,
- 110–111 min: ramping of solvent B from 50 to 80%,
- 111–115 min: maintaining solvent B at 80%,
- 115min: valve position 1–2
- 115–116 min: decreasing solvent B to 5%, and
- 116–120 min: sustaining solvent B at 5%.
The LTQ OrbitrapVelos mass spectrometer equipped with a nano ESI source. The spray voltage is set to 1.5kV. The MS/MS setting contains two scan events. The first scan event: full MS scan of 400–2000 m/z range with a mass resolution of 15,000 (Figure 5). The mass resolution can be increased if needed. The second scan event: collision-induced dissociation (CID) for the 10 most intense ions, isolation width: 3.0 m/z, normalized collision energy (CE): 35%, activation time: 10ms, and activation Q value: 0.25. For glycoproteomics, two additional scan events are set. The third scan event: higher-energy collision dissociation (HCD), isolation width: 3.0 m/z, normalized CE: 45%, and activation time: 0.1ms. The fourth scan event: electron transfer dissociation (ETD), isolation width: 3.0 m/z, default charge state: 4, and reaction time: 150 ms with a supplemental activation.
Process the acquired data using MASCOT, GlypID,31, 32 GlycoFragWork33, 34, and Scaffold Q+. Create transition list for the proteins needed targeting analysis using Pinpoint software (Thermo Fisher Scientific Inc., Waltham, MA) (See Section 3.5).
Pool 1 μg protein digest from each biological sample to get a pooled sample that contains all the targeting proteins.
Analyze the pooled sample to test the transition list using LC-TSQ Vantage system.
The LC system set as step 3.4.3.
The TSQ Vantage mass spectrometer equipped with a nano ESI source. The spray voltage is set to 1.8kV. Data independent acquisition mode was used for MRM experiment. Using the transition list generated in step 5, predefined precursor and transition ions were monitored specifically to select targeted peptides corresponding to each candidate protein with 10.0sec chromatogram filter peak width. The MRM experiments were performed at a dwell time of 20ms for each transition and a Q1 peak width (FWHM) of 0.70Da. The collision energy (CE) value for each targeted peptide is predicted by Pinpoint (CE(+2)=0.034*m/z+3.314(eV),CE(+3)=0.044*m/z+3.314(eV)) with a collision gas pressure of 1.5mTorr in Q2. For glycoproteomic MRM experiments, CE value is set up as 45 for targeting oxonium ions as transitions. This value was optimized and used in our previous glycopeptide quantification using MRM experiments22, 24.
After the validation of the transition list, analyze each biological sample using LC-TSQ Vantage system.
Figure 5.
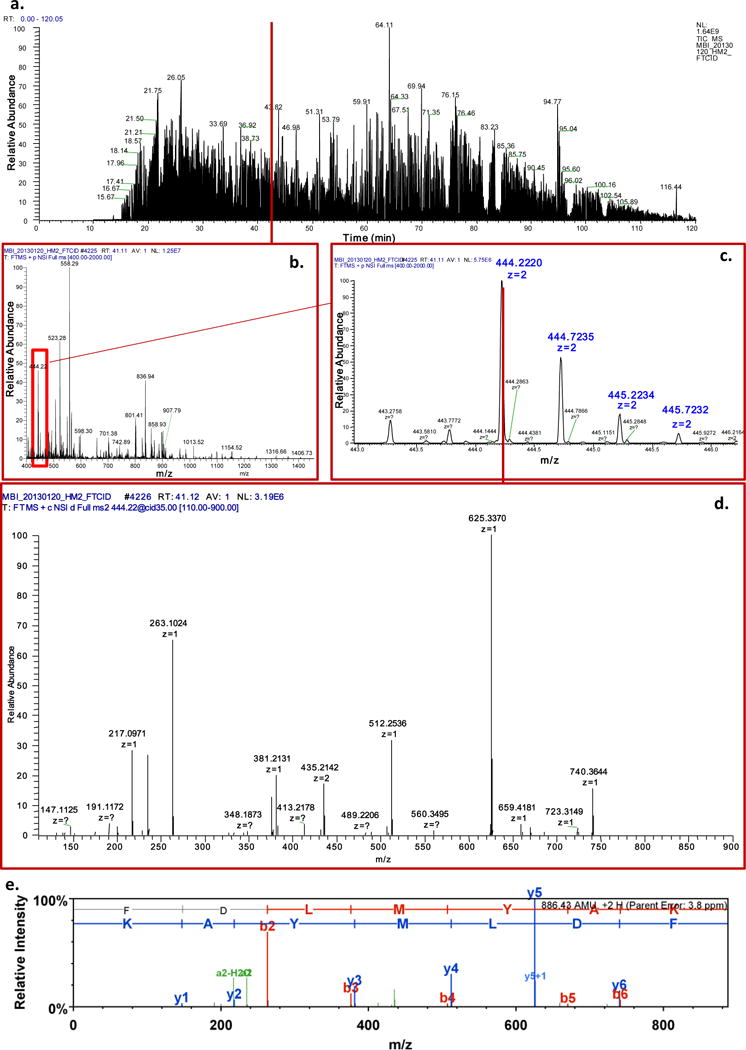
A data example of LC-MS/MS analysis of rat brain tissue generated by LTQ Orbitrap mass spectrometer. a, the total ion chromatogram. b, the full scan spectra at retention time 41.11 min. c, zoomed full scan spectra of m/z range 443.0 to 446.0. d, CID spectra of precursor ion m/z = 444.22. f, peptide identification using MASCOT and Scaffold shows the identity of the spectra in d.
3.6. Data Processing
Data collected from step 3.4.5 was employed for database searching using MASCOT (version 2.4.0, Matrix Science, London, UK). MASCOT was set up to search the UniProt protein database. Peptides were searched with a parent ion tolerance of 6ppm and a fragment ion mass tolerance of 0.8Da. Trypsin was selected as enzyme. The maximum missed cleavages were set up to 2. Carbamidomethylation of cysteine was set as a fixed modification while oxidation of methionine was set as a variable modification (Note 4).
Scaffold Q+ (version Scaffold_3.6.3, Proteome Software Inc., Portland, OR), was used to assign peptide and protein identifications probabilistically based on PeptideProphet and ProteinProphet algorithms, respectively. Peptide identifications were accepted with a probability greater than 95%, while protein identifications were accepted with a probability greater than 99% and contained at least two identified peptides. Identified proteins were then quantitated based on quantitative value (normalized spectral counts) calculated by Scaffold Q+. Student t-test was employed for statistical analysis on the quantitative value (Note 5).
For glycoproteomics, glycan structures are assigned from CID MS/MS while oxonium ions of glycopeptides are searched from HCD MS/MS. The examples of oxonium ions are m/z 138 (Hex-CH2O-2H2O), 204 (HexNAc), 274 (NeuAc-H2O), 366(Hex + HexNAc) and so on22, 35. The software tools for glycopeptide identification are GlypID31, 32 or GlycoFragWork.33, 34 Peptide backbone sequences are identified by ETD MS/MS using GlycoFragWork or MASCOT.
The statistically altered proteins are further investigated by targeting proteomics using LC-MRM experiment. A transition ion list for MRM experiment is created using the targeted protein list. For each targeted protein, two uinque peptides are selected using the following rules: (1) 7–25 amino acid residues length, (2) excluding the first 25 amino acids at the N-terminus of proteins, (3) completely digested by trypsin, (4) excluding peptides with M, RP, KP and glycosylation site (NXS/T), (5) excluding peptides with ragged ends (tryptic peptides cleaved between R/K, K/R, R/R and K/K), and (6) fixed carbamidomethylation of Cysteine. Next, 5 transitions of selected peptides were determined using the following rules: (1) precursor ions with charge states of two or three, (2) y series of fragment ions greater than y3 with a charge state of one, (3) the five most intense fragment ions in the MS/MS spectra from untargeted analysis, and (4) m/z values of precursor and transition ions between 300 and 1500 (Note 6).
The generated transition list is further tested by test analysis of a pooled sample described in step 3.4.7. Transition list could be adjusted based on the test analysis result. The retention time of each peptide is required to be highly related to the retention time of the same peptide in the LC-IT-OT experiment. The most intensive 3 transition ions of each peptide is usually picked as the final transition ions for the certain peptide. The final transition list is used for LC-MRM experiment of biological samples (step 3.5.10).
Data collected from step 3, 5, and 10 were used for targeting proteomic quantitation. Relative peptide abundance is calculated by summing up the peak area of the 3 transitions. Relative protein abundance is calculated by summing up the peak area of the 2 peptides corresponding to the protein. Statistical analysis is performed on the relative proteins abundance across the biological samples. Depending on the data, different statistical treatment could be performed.
The protein quantitative information collected from targeting proteomic quantitation is used for the final protein quantitative evaluation.
Footnotes
The LC-MS/MS and LC-MRM system used in this protocol is a Dionex nano LC system coupled with a Thermo Scientific LTQ Obitrap Velos mass spectrometer and a TSQ Vantage mass spectrometer. However, any high-resolution tandem mass spectrometer which can carry high throughput proteomic analysis is compatible with the global proteomic profiling while any triple, quadruple mass spectrometer designed for peptide analysis fits the targeting LC-MRM experiment.
The 5% SDC extraction solution inhibits trypsin activity. On the other hand, SDC has been shown to be a trypsin enhancer at concentration lower than 1% (w/v). Therefore, a 0.5% SDC in ABC buffer is used for tryptic digestion.
SDC is commonly removed by acidic precipitation or phase transfer. The method described in this protocol using the acidic precipitation protocol. By adding an acidified organic solvent (e.g.,. ethyl acetate with 1% formic acid), SDC could also be effectively removed.
If different mass spectrometer is used, the search parameter could be changed to fit the instrument capability. Meanwhile, another proteomics software which offers database search function is also compatible with the method described here.
Similar to note 4, other proteomic software that can perform label-free quantitation will fit for this method.
Since an LC-IT-OT system has been used for global proteomic profiling and an LC-QQQ system has been used for the target quantitative proteomics, the fragment ions resulting from the collision induced ionization (CID) taken place in ion trap is different from the one in quadruple. Therefore, the relative intensity of transition ions observed in LC-QQQ instrument could be different from those observed from LC-IT-OT instrument. In triple quadruple mass spectrometer, singly charged y ion is more likely to be observed. Therefore, the singly charged y ions are more preferred in this method.
References
- 1.Wilkins MR, Pasquali C, Appel RD, Ou K, Golaz O, Sanchez JC, Yan JX, Gooley AA, Hughes G, Humphery-Smith I, Williams KL, Hochstrasser DF. From proteins to proteomes: large scale protein identification by two-dimensional electrophoresis and amino acid analysis. Biotechnology (N Y) 1996;14(1):61–5. doi: 10.1038/nbt0196-61. [DOI] [PubMed] [Google Scholar]
- 2.Zhang Y, Fonslow BR, Shan B, Baek MC, Yates JR., 3rd Protein analysis by shotgun/bottom-up proteomics. Chem Rev. 2013;113(4):2343–94. doi: 10.1021/cr3003533. [DOI] [PMC free article] [PubMed] [Google Scholar]
- 3.Jung J, Dudek E, Michalak M. The role of N-glycan in folding, trafficking and pathogenicity of myelin oligodendrocyte glycoprotein (MOG) Biochim Biophys Acta. 2014 doi: 10.1016/j.bbamcr.2014.12.023. [DOI] [PubMed] [Google Scholar]
- 4.Klatt S, Rohe M, Alagesan K, Kolarich D, Konthur Z, Hartl D. Production of glycosylated soluble amyloid precursor protein alpha (sAPPalpha) in Leishmania tarentolae. J Proteome Res. 2013;12(1):396–403. doi: 10.1021/pr300693f. [DOI] [PubMed] [Google Scholar]
- 5.Hall MK, Cartwright TA, Fleming CM, Schwalbe RA. Importance of glycosylation on function of a potassium channel in neuroblastoma cells. PLoS One. 2011;6(4):e19317. doi: 10.1371/journal.pone.0019317. [DOI] [PMC free article] [PubMed] [Google Scholar]
- 6.Wolters DA, Washburn MP, Yates JR., 3rd An automated multidimensional protein identification technology for shotgun proteomics. Anal Chem. 2001;73(23):5683–90. doi: 10.1021/ac010617e. [DOI] [PubMed] [Google Scholar]
- 7.Yates JR., 3rd Mass spectral analysis in proteomics. Annu Rev Biophys Biomol Struct. 2004;33:297–316. doi: 10.1146/annurev.biophys.33.111502.082538. [DOI] [PubMed] [Google Scholar]
- 8.Peng J, Elias JE, Thoreen CC, Licklider LJ, Gygi SP. Evaluation of multidimensional chromatography coupled with tandem mass spectrometry (LC/LC-MS/MS) for large-scale protein analysis: the yeast proteome. J Proteome Res. 2003;2(1):43–50. doi: 10.1021/pr025556v. [DOI] [PubMed] [Google Scholar]
- 9.Figeys D, Ducret A, Yates JR, 3rd, Aebersold R. Protein identification by solid phase microextraction-capillary zone electrophoresis-microelectrospray-tandem mass spectrometry. Nat Biotechnol. 1996;14(11):1579–83. doi: 10.1038/nbt1196-1579. [DOI] [PubMed] [Google Scholar]
- 10.Link AJ, Eng J, Schieltz DM, Carmack E, Mize GJ, Morris DR, Garvik BM, Yates JR., 3rd Direct analysis of protein complexes using mass spectrometry. Nat Biotechnol. 1999;17(7):676–82. doi: 10.1038/10890. [DOI] [PubMed] [Google Scholar]
- 11.Washburn MP, Wolters D, Yates JR., 3rd Large-scale analysis of the yeast proteome by multidimensional protein identification technology. Nat Biotechnol. 2001;19(3):242–7. doi: 10.1038/85686. [DOI] [PubMed] [Google Scholar]
- 12.Beausoleil SA, Jedrychowski M, Schwartz D, Elias JE, Villen J, Li J, Cohn MA, Cantley LC, Gygi SP. Large-scale characterization of HeLa cell nuclear phosphoproteins. Proc Natl Acad Sci U S A. 2004;101(33):12130–5. doi: 10.1073/pnas.0404720101. [DOI] [PMC free article] [PubMed] [Google Scholar]
- 13.Senko MW, Remes PM, Canterbury JD, Mathur R, Song Q, Eliuk SM, Mullen C, Earley L, Hardman M, Blethrow JD, Bui H, Specht A, Lange O, Denisov E, Makarov A, Horning S, Zabrouskov V. Novel parallelized quadrupole/linear ion trap/Orbitrap tribrid mass spectrometer improving proteome coverage and peptide identification rates. Anal Chem. 2013;85(24):11710–4. doi: 10.1021/ac403115c. [DOI] [PubMed] [Google Scholar]
- 14.de Godoy LM, Olsen JV, Cox J, Nielsen ML, Hubner NC, Frohlich F, Walther TC, Mann M. Comprehensive mass-spectrometry-based proteome quantification of haploid versus diploid yeast. Nature. 2008;455(7217):1251–4. doi: 10.1038/nature07341. [DOI] [PubMed] [Google Scholar]
- 15.Webb KJ, Xu T, Park SK, Yates JR., 3rd Modified MuDPIT separation identified 4488 proteins in a system-wide analysis of quiescence in yeast. J Proteome Res. 2013;12(5):2177–84. doi: 10.1021/pr400027m. [DOI] [PMC free article] [PubMed] [Google Scholar]
- 16.Nagaraj N, Kulak NA, Cox J, Neuhauser N, Mayr K, Hoerning O, Vorm O, Mann M. System-wide perturbation analysis with nearly complete coverage of the yeast proteome by single-shot ultra HPLC runs on a bench top Orbitrap. Mol Cell Proteomics. 2012;11(3) doi: 10.1074/mcp.M111.013722. M111 013722. [DOI] [PMC free article] [PubMed] [Google Scholar]
- 17.Hebert AS, Richards AL, Bailey DJ, Ulbrich A, Coughlin EE, Westphall MS, Coon JJ. The one hour yeast proteome. Mol Cell Proteomics. 2014;13(1):339–47. doi: 10.1074/mcp.M113.034769. [DOI] [PMC free article] [PubMed] [Google Scholar]
- 18.Bantscheff M, Schirle M, Sweetman G, Rick J, Kuster B. Quantitative mass spectrometry in proteomics: a critical review. Anal Bioanal Chem. 2007;389(4):1017–31. doi: 10.1007/s00216-007-1486-6. [DOI] [PubMed] [Google Scholar]
- 19.Liu H, Sadygov RG, Yates JR., 3rd A model for random sampling and estimation of relative protein abundance in shotgun proteomics. Anal Chem. 2004;76(14):4193–201. doi: 10.1021/ac0498563. [DOI] [PubMed] [Google Scholar]
- 20.Anderson NL, Polanski M, Pieper R, Gatlin T, Tirumalai RS, Conrads TP, Veenstra TD, Adkins JN, Pounds JG, Fagan R, Lobley A. The human plasma proteome: a nonredundant list developed by combination of four separate sources. Mol Cell Proteomics. 2004;3(4):311–26. doi: 10.1074/mcp.M300127-MCP200. [DOI] [PubMed] [Google Scholar]
- 21.Anderson L, Hunter CL. Quantitative mass spectrometric multiple reaction monitoring assays for major plasma proteins. Mol Cell Proteomics. 2006;5(4):573–88. doi: 10.1074/mcp.M500331-MCP200. [DOI] [PubMed] [Google Scholar]
- 22.Song E, Pyreddy S, Mechref Y. Quantification of glycopeptides by multiple reaction monitoring liquid chromatography/tandem mass spectrometry. Rapid Communications in Mass Spectrometry. 2012;26(17):1941–1954. doi: 10.1002/rcm.6290. [DOI] [PMC free article] [PubMed] [Google Scholar]
- 23.Sanda M, Pompach P, Brnakova Z, Wu J, Makambi K, Goldman R. Quantitative liquid chromatography-mass spectrometry-multiple reaction monitoring (LC-MS-MRM) analysis of site-specific glycoforms of haptoglobin in liver disease. Mol Cell Proteomics. 2013;12(5):1294–305. doi: 10.1074/mcp.M112.023325. [DOI] [PMC free article] [PubMed] [Google Scholar]
- 24.Song E, Zhu R, Hammoud ZT, Mechref Y. LC–MS/MS Quantitation of Esophagus Disease Blood Serum Glycoproteins by Enrichment with Hydrazide Chemistry and Lectin Affinity Chromatography. J Proteome Res. 2014;13(11):4808–4820. doi: 10.1021/pr500570m. [DOI] [PMC free article] [PubMed] [Google Scholar]
- 25.Segu ZM, Mechref Y. Characterizing protein glycosylation sites through higher-energy C-trap dissociation. Rapid Communications in Mass Spectrometry. 2010;24(9):1217–1225. doi: 10.1002/rcm.4485. [DOI] [PubMed] [Google Scholar]
- 26.Mechref Y, Madera M, Novotny MV. Glycoprotein enrichment through lectin affinity techniques. Methods Mol Biol. 2008;424:373–96. doi: 10.1007/978-1-60327-064-9_29. [DOI] [PubMed] [Google Scholar]
- 27.Madera M, Mechref Y, Klouckova I, Novotny MV. High-sensitivity profiling of glycoproteins from human blood serum through multiple-lectin affinity chromatography and liquid chromatography/tandem mass spectrometry. J Chromatogr B Analyt Technol Biomed Life Sci. 2007;845(1):121–37. doi: 10.1016/j.jchromb.2006.07.067. [DOI] [PubMed] [Google Scholar]
- 28.Zhang H, Li XJ, Martin DB, Aebersold R. Identification and quantification of N-linked glycoproteins using hydrazide chemistry, stable isotope labeling and mass spectrometry. Nat Biotechnol. 2003;21(6):660–6. doi: 10.1038/nbt827. [DOI] [PubMed] [Google Scholar]
- 29.Buszewski B, Noga S. Hydrophilic interaction liquid chromatography (HILIC)–a powerful separation technique. Anal Bioanal Chem. 2012;402(1):231–47. doi: 10.1007/s00216-011-5308-5. [DOI] [PMC free article] [PubMed] [Google Scholar]
- 30.Selman MH, Hemayatkar M, Deelder AM, Wuhrer M. Cotton HILIC SPE microtips for microscale purification and enrichment of glycans and glycopeptides. Analytical chemistry. 2011;83(7):2492–9. doi: 10.1021/ac1027116. [DOI] [PubMed] [Google Scholar]
- 31.Mayampurath AM, Wu Y, Segu ZM, Mechref Y, Tang H. Improving confidence in detection and characterization of protein N-glycosylation sites and microheterogeneity. Rapid Commun Mass Spectrom. 2011;25(14):2007–19. doi: 10.1002/rcm.5059. [DOI] [PubMed] [Google Scholar]
- 32.Wu Y, Mechref Y, Klouckova I, Mayampurath A, Novotny MV, Tang H. Mapping site-specific protein N-glycosylations through liquid chromatography/mass spectrometry and targeted tandem mass spectrometry. Rapid Commun Mass Spectrom. 2010;24(7):965–72. doi: 10.1002/rcm.4474. [DOI] [PubMed] [Google Scholar]
- 33.Mayampurath A, Yu CY, Song E, Balan J, Mechref Y, Tang H. Computational framework for identification of intact glycopeptides in complex samples. Anal Chem. 2014;86(1):453–63. doi: 10.1021/ac402338u. [DOI] [PubMed] [Google Scholar]
- 34.Mayampurath A, Song E, Mathur A, Yu C-Y, Hammoud Z, Mechref Y, Tang H. Label-Free Glycopeptide Quantification for Biomarker Discovery in Human Sera. J Proteome Res. 2014;13(11):4821–4832. doi: 10.1021/pr500242m. [DOI] [PubMed] [Google Scholar]
- 35.Segu ZM, Hammad LA, Mechref Y. Rapid and efficient glycoprotein identification through microwave-assisted enzymatic digestion. Rapid Commun Mass Spectrom. 2010;24(23):3461–8. doi: 10.1002/rcm.4774. [DOI] [PubMed] [Google Scholar]


